
Key Insights
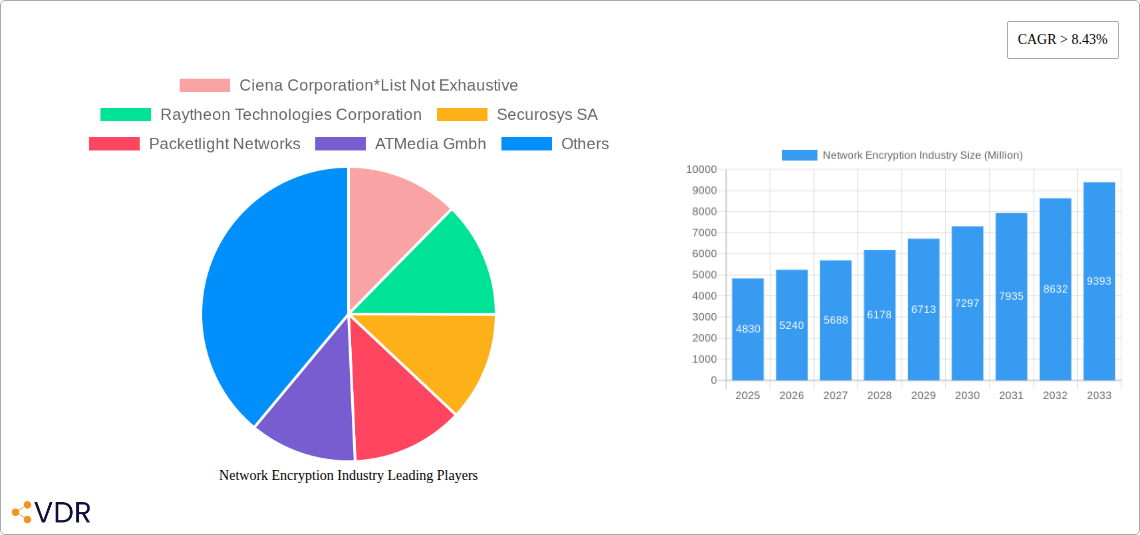
The network encryption market, valued at $4.83 billion in 2025, is experiencing robust growth, projected to expand at a Compound Annual Growth Rate (CAGR) exceeding 8.43% from 2025 to 2033. This surge is driven by the escalating need for robust cybersecurity solutions amidst increasing cyber threats targeting sensitive data across various industries. The rising adoption of cloud-based deployments, coupled with the proliferation of data-intensive applications and the growing emphasis on regulatory compliance (like GDPR and CCPA), are key catalysts. Furthermore, the market is segmented by deployment type (cloud and on-premise), component (hardware, solutions, and services), organization size (SMEs and large enterprises), and end-user industry (telecom & IT, BFSI, government, media & entertainment, and others). The cloud segment is expected to dominate due to its scalability, cost-effectiveness, and ease of management. Hardware components, including encryption devices and secure hardware modules, represent a significant market share, while the solutions and services segment fuels growth through managed security services and professional services. Large enterprises are currently the major consumers, but growing digitalization and awareness among SMEs are expanding this market segment. North America and Europe are currently leading regions, but the Asia-Pacific region exhibits significant growth potential due to rapid technological advancements and increasing digital infrastructure investments.
The competitive landscape comprises established players like Ciena Corporation, Raytheon Technologies Corporation, and Juniper Networks, alongside specialized cybersecurity firms and network equipment providers. The market's future growth hinges on continuous technological innovation, focusing on advanced encryption techniques like quantum-resistant cryptography and improved key management systems. Addressing the challenges of managing encryption keys effectively across diverse environments and mitigating the impact of increasing sophistication of cyberattacks remain crucial for sustained market expansion. The integration of network encryption with other cybersecurity solutions, such as intrusion detection and prevention systems, will further drive market growth by offering comprehensive security solutions. The rising adoption of 5G and IoT technologies will also create additional opportunities for network encryption solutions.
Network Encryption Industry Market Report: 2019-2033
This comprehensive report provides an in-depth analysis of the Network Encryption market, encompassing its current state, future trajectory, and key players. With a study period spanning 2019-2033, a base year of 2025, and a forecast period of 2025-2033, this report offers invaluable insights for industry professionals, investors, and strategists. The report analyzes the market across various segments, including deployment type (cloud, on-premise), component (hardware, solutions & services), organization size (SMEs, large enterprises), and end-user industry (telecom & IT, BFSI, government, media & entertainment, others). The market is valued at xx Million in 2025 and is projected to reach xx Million by 2033.
Network Encryption Industry Market Dynamics & Structure
The network encryption market is characterized by moderate concentration, with several key players holding significant market share. Technological innovation, particularly in areas like quantum-resistant cryptography and advanced encryption standards, is a primary growth driver. Stringent data privacy regulations (e.g., GDPR, CCPA) are further fueling demand for robust encryption solutions. Competitive pressures stem from both established players and emerging startups offering innovative solutions. The market witnesses frequent M&A activity, with larger players acquiring smaller companies to enhance their product portfolios and expand their market reach.
- Market Concentration: Moderately concentrated, with top 5 players holding approximately xx% market share in 2025.
- Technological Innovation: Focus on quantum-resistant cryptography, AI-driven threat detection, and improved key management systems.
- Regulatory Framework: Compliance with GDPR, CCPA, and other data privacy regulations is a key driver.
- Competitive Landscape: Intense competition among established players and emerging startups.
- M&A Activity: Significant M&A activity observed in recent years, with an average of xx deals annually (2019-2024).
- Innovation Barriers: High R&D costs, complexity of implementing new standards, and skilled workforce shortages.
Network Encryption Industry Growth Trends & Insights
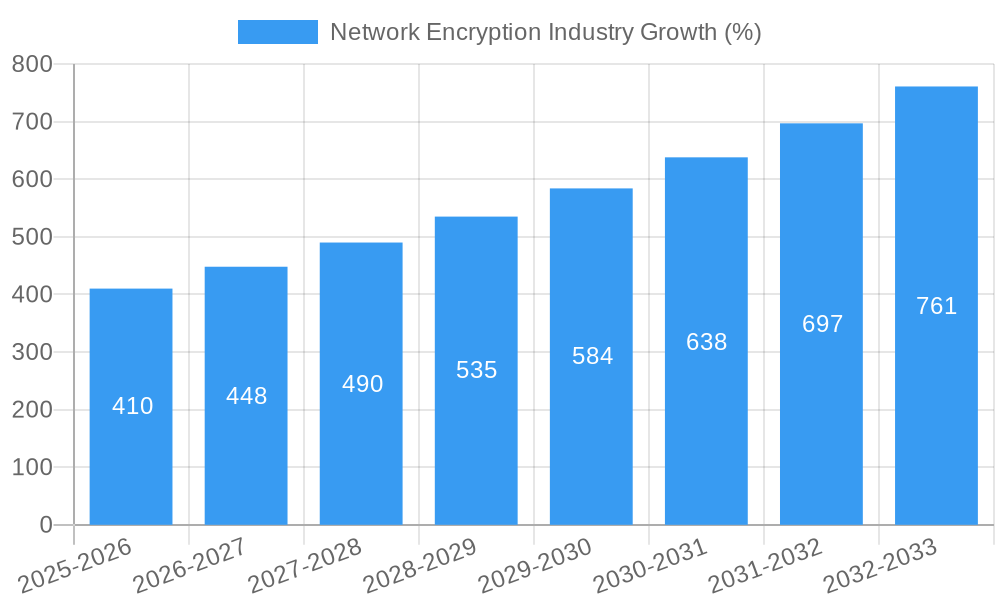
The network encryption market experienced robust growth during the historical period (2019-2024), driven by increasing adoption of cloud computing, the rise of IoT devices, and heightened cybersecurity concerns. The market is projected to maintain a healthy Compound Annual Growth Rate (CAGR) of xx% during the forecast period (2025-2033). This growth is fueled by the increasing digitization of businesses, the expanding adoption of 5G networks, and the growing need for secure data transmission across diverse platforms. Technological disruptions, such as the emergence of quantum computing, are also shaping the market landscape. Consumer behavior is shifting towards greater awareness of data privacy and security, further driving demand for robust encryption solutions.
Dominant Regions, Countries, or Segments in Network Encryption Industry
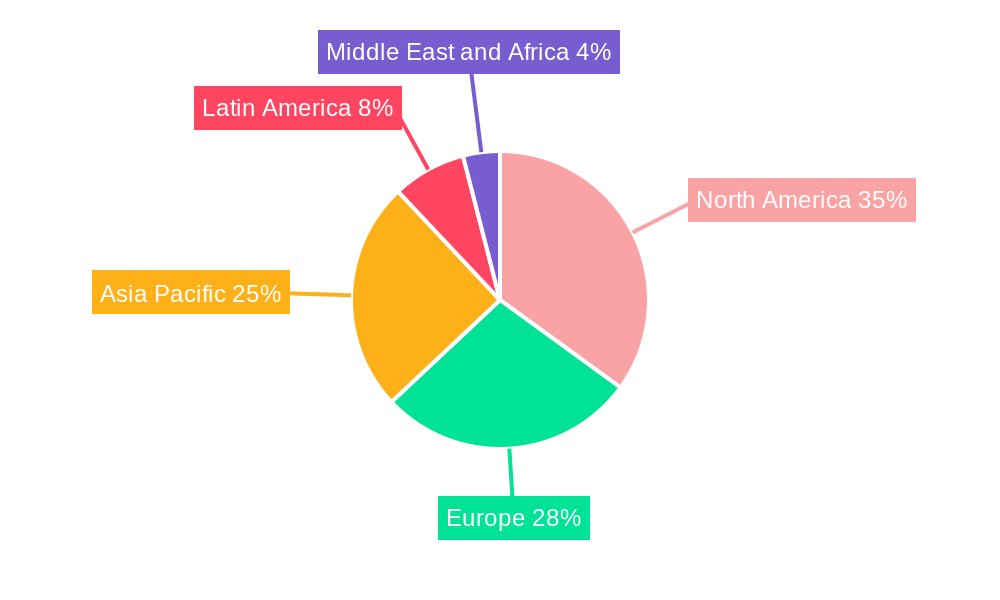
North America currently holds the largest market share in the network encryption industry, followed by Europe and Asia Pacific. The dominance of North America is attributed to the high adoption of cloud-based solutions, the presence of major technology players, and stringent data privacy regulations. Within segments, the cloud-based deployment type is exhibiting the fastest growth, driven by its scalability, cost-effectiveness, and ease of management. The Solutions & Services component dominates the market, indicating a growing preference for managed security services. Large enterprises are the major consumers of network encryption solutions, given their complex IT infrastructure and higher sensitivity to data breaches. The Telecom & IT sector is the largest end-user industry, followed by BFSI.
- Key Drivers (North America): Strong regulatory environment, high cloud adoption rate, significant IT spending.
- Key Drivers (Europe): Stringent data privacy regulations (GDPR), increasing digitalization across sectors.
- Key Drivers (Asia Pacific): Rapid growth of internet penetration, expanding e-commerce, and government initiatives for cybersecurity.
- Segment Dominance: Cloud deployment, Solutions & Services component, Large Enterprises, Telecom & IT end-user industry.
Network Encryption Industry Product Landscape
The network encryption market offers a diverse range of products, including hardware-based encryption devices, software-based encryption solutions, and managed security services. These solutions vary in their performance metrics, including encryption speed, key management capabilities, and scalability. Unique selling propositions often revolve around advanced features like quantum-resistant algorithms, AI-powered threat detection, and seamless integration with existing IT infrastructure. Continuous technological advancements are driving improvements in encryption speed, security protocols, and user-friendliness.
Key Drivers, Barriers & Challenges in Network Encryption Industry
Key Drivers:
- Growing cybersecurity threats.
- Increasing regulatory compliance needs.
- Expansion of cloud computing and IoT.
- Rising adoption of 5G networks.
Challenges & Restraints:
- High implementation costs.
- Complexity of integrating new solutions.
- Skill gap in cybersecurity professionals.
- Potential supply chain disruptions leading to xx% increase in hardware costs in 2024.
Emerging Opportunities in Network Encryption Industry
- Expanding into untapped markets in developing economies.
- Development of encryption solutions for new technologies (e.g., quantum computing).
- Growing demand for managed security services.
- Increased focus on user-friendly and easy-to-deploy solutions.
Growth Accelerators in the Network Encryption Industry
Strategic partnerships between encryption providers and cloud service providers are expected to accelerate market growth. Technological breakthroughs in quantum-resistant cryptography and AI-driven threat detection are also significant catalysts. Expansion into new geographical markets, particularly in developing economies, presents a major growth opportunity.
Key Players Shaping the Network Encryption Industry Market
- Ciena Corporation
- Raytheon Technologies Corporation
- Securosys SA
- Packetlight Networks
- ATMedia Gmbh
- Viasat Inc
- Certes Networks Inc
- Juniper Networks Inc
- Atos SE
- Senetas Corporation Ltd
- Colt Technology Services Group Ltd
- Rohde & Schwarz Cybersecurity GmbH
- Thales Trusted Cyber Technologies
Notable Milestones in Network Encryption Industry Sector
- October 2023: Nokia partners with DPR to provide network security and cloud-based DDoS defense solutions to K2 Telecom Brazil.
- February 2023: Sitehop secures over EUR 1 million (USD 1.13 million) in funding for its new telecom encryption solution.
In-Depth Network Encryption Industry Market Outlook
The network encryption market is poised for sustained growth driven by the convergence of several factors. The rising adoption of cloud technologies, increasing cybersecurity threats, and stringent data privacy regulations will continue to fuel demand for advanced encryption solutions. Strategic partnerships and technological advancements will further accelerate market expansion, creating significant opportunities for players with innovative solutions and strong market strategies.
Network Encryption Industry Segmentation
-
1. Deployment Type
- 1.1. Cloud
- 1.2. On-premise
-
2. Component
- 2.1. Hardware
- 2.2. Solutions & Services
-
3. Organization Size
- 3.1. Small and Medium-sized Enterprises
- 3.2. Large-sized Enterprises
-
4. End-user Industry
- 4.1. Telecom & IT
- 4.2. BFSI
- 4.3. Government
- 4.4. Media & Entertainment
- 4.5. Other End-user Industries
Network Encryption Industry Segmentation By Geography
- 1. North America
- 2. Europe
- 3. Asia Pacific
- 4. Latin America
- 5. Middle East and Africa
Network Encryption Industry REPORT HIGHLIGHTS
| Aspects | Details |
|---|---|
| Study Period | 2019-2033 |
| Base Year | 2024 |
| Estimated Year | 2025 |
| Forecast Period | 2025-2033 |
| Historical Period | 2019-2024 |
| Growth Rate | CAGR of > 8.43% from 2019-2033 |
| Segmentation |
|
Table of Contents
- 1. Introduction
- 1.1. Research Scope
- 1.2. Market Segmentation
- 1.3. Research Methodology
- 1.4. Definitions and Assumptions
- 2. Executive Summary
- 2.1. Introduction
- 3. Market Dynamics
- 3.1. Introduction
- 3.2. Market Drivers
- 3.2.1. Increasing Number of Network Security Breaches; Increasing Adoption of Cloud Technologies by Numerous Organizations
- 3.3. Market Restrains
- 3.3.1. Cybersecurity Threats to Satellite Communication; Reliance on High-cost Satellite Equipment
- 3.4. Market Trends
- 3.4.1. Telecom and IT Sector is Expected to Hold a Significant Share of the Market
- 4. Market Factor Analysis
- 4.1. Porters Five Forces
- 4.2. Supply/Value Chain
- 4.3. PESTEL analysis
- 4.4. Market Entropy
- 4.5. Patent/Trademark Analysis
- 5. Global Network Encryption Industry Analysis, Insights and Forecast, 2019-2031
- 5.1. Market Analysis, Insights and Forecast - by Deployment Type
- 5.1.1. Cloud
- 5.1.2. On-premise
- 5.2. Market Analysis, Insights and Forecast - by Component
- 5.2.1. Hardware
- 5.2.2. Solutions & Services
- 5.3. Market Analysis, Insights and Forecast - by Organization Size
- 5.3.1. Small and Medium-sized Enterprises
- 5.3.2. Large-sized Enterprises
- 5.4. Market Analysis, Insights and Forecast - by End-user Industry
- 5.4.1. Telecom & IT
- 5.4.2. BFSI
- 5.4.3. Government
- 5.4.4. Media & Entertainment
- 5.4.5. Other End-user Industries
- 5.5. Market Analysis, Insights and Forecast - by Region
- 5.5.1. North America
- 5.5.2. Europe
- 5.5.3. Asia Pacific
- 5.5.4. Latin America
- 5.5.5. Middle East and Africa
- 5.1. Market Analysis, Insights and Forecast - by Deployment Type
- 6. North America Network Encryption Industry Analysis, Insights and Forecast, 2019-2031
- 6.1. Market Analysis, Insights and Forecast - by Deployment Type
- 6.1.1. Cloud
- 6.1.2. On-premise
- 6.2. Market Analysis, Insights and Forecast - by Component
- 6.2.1. Hardware
- 6.2.2. Solutions & Services
- 6.3. Market Analysis, Insights and Forecast - by Organization Size
- 6.3.1. Small and Medium-sized Enterprises
- 6.3.2. Large-sized Enterprises
- 6.4. Market Analysis, Insights and Forecast - by End-user Industry
- 6.4.1. Telecom & IT
- 6.4.2. BFSI
- 6.4.3. Government
- 6.4.4. Media & Entertainment
- 6.4.5. Other End-user Industries
- 6.1. Market Analysis, Insights and Forecast - by Deployment Type
- 7. Europe Network Encryption Industry Analysis, Insights and Forecast, 2019-2031
- 7.1. Market Analysis, Insights and Forecast - by Deployment Type
- 7.1.1. Cloud
- 7.1.2. On-premise
- 7.2. Market Analysis, Insights and Forecast - by Component
- 7.2.1. Hardware
- 7.2.2. Solutions & Services
- 7.3. Market Analysis, Insights and Forecast - by Organization Size
- 7.3.1. Small and Medium-sized Enterprises
- 7.3.2. Large-sized Enterprises
- 7.4. Market Analysis, Insights and Forecast - by End-user Industry
- 7.4.1. Telecom & IT
- 7.4.2. BFSI
- 7.4.3. Government
- 7.4.4. Media & Entertainment
- 7.4.5. Other End-user Industries
- 7.1. Market Analysis, Insights and Forecast - by Deployment Type
- 8. Asia Pacific Network Encryption Industry Analysis, Insights and Forecast, 2019-2031
- 8.1. Market Analysis, Insights and Forecast - by Deployment Type
- 8.1.1. Cloud
- 8.1.2. On-premise
- 8.2. Market Analysis, Insights and Forecast - by Component
- 8.2.1. Hardware
- 8.2.2. Solutions & Services
- 8.3. Market Analysis, Insights and Forecast - by Organization Size
- 8.3.1. Small and Medium-sized Enterprises
- 8.3.2. Large-sized Enterprises
- 8.4. Market Analysis, Insights and Forecast - by End-user Industry
- 8.4.1. Telecom & IT
- 8.4.2. BFSI
- 8.4.3. Government
- 8.4.4. Media & Entertainment
- 8.4.5. Other End-user Industries
- 8.1. Market Analysis, Insights and Forecast - by Deployment Type
- 9. Latin America Network Encryption Industry Analysis, Insights and Forecast, 2019-2031
- 9.1. Market Analysis, Insights and Forecast - by Deployment Type
- 9.1.1. Cloud
- 9.1.2. On-premise
- 9.2. Market Analysis, Insights and Forecast - by Component
- 9.2.1. Hardware
- 9.2.2. Solutions & Services
- 9.3. Market Analysis, Insights and Forecast - by Organization Size
- 9.3.1. Small and Medium-sized Enterprises
- 9.3.2. Large-sized Enterprises
- 9.4. Market Analysis, Insights and Forecast - by End-user Industry
- 9.4.1. Telecom & IT
- 9.4.2. BFSI
- 9.4.3. Government
- 9.4.4. Media & Entertainment
- 9.4.5. Other End-user Industries
- 9.1. Market Analysis, Insights and Forecast - by Deployment Type
- 10. Middle East and Africa Network Encryption Industry Analysis, Insights and Forecast, 2019-2031
- 10.1. Market Analysis, Insights and Forecast - by Deployment Type
- 10.1.1. Cloud
- 10.1.2. On-premise
- 10.2. Market Analysis, Insights and Forecast - by Component
- 10.2.1. Hardware
- 10.2.2. Solutions & Services
- 10.3. Market Analysis, Insights and Forecast - by Organization Size
- 10.3.1. Small and Medium-sized Enterprises
- 10.3.2. Large-sized Enterprises
- 10.4. Market Analysis, Insights and Forecast - by End-user Industry
- 10.4.1. Telecom & IT
- 10.4.2. BFSI
- 10.4.3. Government
- 10.4.4. Media & Entertainment
- 10.4.5. Other End-user Industries
- 10.1. Market Analysis, Insights and Forecast - by Deployment Type
- 11. North America Network Encryption Industry Analysis, Insights and Forecast, 2019-2031
- 11.1. Market Analysis, Insights and Forecast - By Country/Sub-region
- 11.1.1.
- 12. Europe Network Encryption Industry Analysis, Insights and Forecast, 2019-2031
- 12.1. Market Analysis, Insights and Forecast - By Country/Sub-region
- 12.1.1.
- 13. Asia Pacific Network Encryption Industry Analysis, Insights and Forecast, 2019-2031
- 13.1. Market Analysis, Insights and Forecast - By Country/Sub-region
- 13.1.1.
- 14. Latin America Network Encryption Industry Analysis, Insights and Forecast, 2019-2031
- 14.1. Market Analysis, Insights and Forecast - By Country/Sub-region
- 14.1.1.
- 15. Middle East and Africa Network Encryption Industry Analysis, Insights and Forecast, 2019-2031
- 15.1. Market Analysis, Insights and Forecast - By Country/Sub-region
- 15.1.1.
- 16. Competitive Analysis
- 16.1. Global Market Share Analysis 2024
- 16.2. Company Profiles
- 16.2.1 Ciena Corporation*List Not Exhaustive
- 16.2.1.1. Overview
- 16.2.1.2. Products
- 16.2.1.3. SWOT Analysis
- 16.2.1.4. Recent Developments
- 16.2.1.5. Financials (Based on Availability)
- 16.2.2 Raytheon Technologies Corporation
- 16.2.2.1. Overview
- 16.2.2.2. Products
- 16.2.2.3. SWOT Analysis
- 16.2.2.4. Recent Developments
- 16.2.2.5. Financials (Based on Availability)
- 16.2.3 Securosys SA
- 16.2.3.1. Overview
- 16.2.3.2. Products
- 16.2.3.3. SWOT Analysis
- 16.2.3.4. Recent Developments
- 16.2.3.5. Financials (Based on Availability)
- 16.2.4 Packetlight Networks
- 16.2.4.1. Overview
- 16.2.4.2. Products
- 16.2.4.3. SWOT Analysis
- 16.2.4.4. Recent Developments
- 16.2.4.5. Financials (Based on Availability)
- 16.2.5 ATMedia Gmbh
- 16.2.5.1. Overview
- 16.2.5.2. Products
- 16.2.5.3. SWOT Analysis
- 16.2.5.4. Recent Developments
- 16.2.5.5. Financials (Based on Availability)
- 16.2.6 Viasat Inc
- 16.2.6.1. Overview
- 16.2.6.2. Products
- 16.2.6.3. SWOT Analysis
- 16.2.6.4. Recent Developments
- 16.2.6.5. Financials (Based on Availability)
- 16.2.7 Certes Networks Inc
- 16.2.7.1. Overview
- 16.2.7.2. Products
- 16.2.7.3. SWOT Analysis
- 16.2.7.4. Recent Developments
- 16.2.7.5. Financials (Based on Availability)
- 16.2.8 Juniper Networks Inc
- 16.2.8.1. Overview
- 16.2.8.2. Products
- 16.2.8.3. SWOT Analysis
- 16.2.8.4. Recent Developments
- 16.2.8.5. Financials (Based on Availability)
- 16.2.9 Atos SE
- 16.2.9.1. Overview
- 16.2.9.2. Products
- 16.2.9.3. SWOT Analysis
- 16.2.9.4. Recent Developments
- 16.2.9.5. Financials (Based on Availability)
- 16.2.10 Senetas Corporation Ltd
- 16.2.10.1. Overview
- 16.2.10.2. Products
- 16.2.10.3. SWOT Analysis
- 16.2.10.4. Recent Developments
- 16.2.10.5. Financials (Based on Availability)
- 16.2.11 Colt Technology Services Group Ltd
- 16.2.11.1. Overview
- 16.2.11.2. Products
- 16.2.11.3. SWOT Analysis
- 16.2.11.4. Recent Developments
- 16.2.11.5. Financials (Based on Availability)
- 16.2.12 Rohde & Schwarz Cybersecurity GmbH
- 16.2.12.1. Overview
- 16.2.12.2. Products
- 16.2.12.3. SWOT Analysis
- 16.2.12.4. Recent Developments
- 16.2.12.5. Financials (Based on Availability)
- 16.2.13 Thales Trusted Cyber Technologies
- 16.2.13.1. Overview
- 16.2.13.2. Products
- 16.2.13.3. SWOT Analysis
- 16.2.13.4. Recent Developments
- 16.2.13.5. Financials (Based on Availability)
- 16.2.1 Ciena Corporation*List Not Exhaustive
List of Figures
- Figure 1: Global Network Encryption Industry Revenue Breakdown (Million, %) by Region 2024 & 2032
- Figure 2: North America Network Encryption Industry Revenue (Million), by Country 2024 & 2032
- Figure 3: North America Network Encryption Industry Revenue Share (%), by Country 2024 & 2032
- Figure 4: Europe Network Encryption Industry Revenue (Million), by Country 2024 & 2032
- Figure 5: Europe Network Encryption Industry Revenue Share (%), by Country 2024 & 2032
- Figure 6: Asia Pacific Network Encryption Industry Revenue (Million), by Country 2024 & 2032
- Figure 7: Asia Pacific Network Encryption Industry Revenue Share (%), by Country 2024 & 2032
- Figure 8: Latin America Network Encryption Industry Revenue (Million), by Country 2024 & 2032
- Figure 9: Latin America Network Encryption Industry Revenue Share (%), by Country 2024 & 2032
- Figure 10: Middle East and Africa Network Encryption Industry Revenue (Million), by Country 2024 & 2032
- Figure 11: Middle East and Africa Network Encryption Industry Revenue Share (%), by Country 2024 & 2032
- Figure 12: North America Network Encryption Industry Revenue (Million), by Deployment Type 2024 & 2032
- Figure 13: North America Network Encryption Industry Revenue Share (%), by Deployment Type 2024 & 2032
- Figure 14: North America Network Encryption Industry Revenue (Million), by Component 2024 & 2032
- Figure 15: North America Network Encryption Industry Revenue Share (%), by Component 2024 & 2032
- Figure 16: North America Network Encryption Industry Revenue (Million), by Organization Size 2024 & 2032
- Figure 17: North America Network Encryption Industry Revenue Share (%), by Organization Size 2024 & 2032
- Figure 18: North America Network Encryption Industry Revenue (Million), by End-user Industry 2024 & 2032
- Figure 19: North America Network Encryption Industry Revenue Share (%), by End-user Industry 2024 & 2032
- Figure 20: North America Network Encryption Industry Revenue (Million), by Country 2024 & 2032
- Figure 21: North America Network Encryption Industry Revenue Share (%), by Country 2024 & 2032
- Figure 22: Europe Network Encryption Industry Revenue (Million), by Deployment Type 2024 & 2032
- Figure 23: Europe Network Encryption Industry Revenue Share (%), by Deployment Type 2024 & 2032
- Figure 24: Europe Network Encryption Industry Revenue (Million), by Component 2024 & 2032
- Figure 25: Europe Network Encryption Industry Revenue Share (%), by Component 2024 & 2032
- Figure 26: Europe Network Encryption Industry Revenue (Million), by Organization Size 2024 & 2032
- Figure 27: Europe Network Encryption Industry Revenue Share (%), by Organization Size 2024 & 2032
- Figure 28: Europe Network Encryption Industry Revenue (Million), by End-user Industry 2024 & 2032
- Figure 29: Europe Network Encryption Industry Revenue Share (%), by End-user Industry 2024 & 2032
- Figure 30: Europe Network Encryption Industry Revenue (Million), by Country 2024 & 2032
- Figure 31: Europe Network Encryption Industry Revenue Share (%), by Country 2024 & 2032
- Figure 32: Asia Pacific Network Encryption Industry Revenue (Million), by Deployment Type 2024 & 2032
- Figure 33: Asia Pacific Network Encryption Industry Revenue Share (%), by Deployment Type 2024 & 2032
- Figure 34: Asia Pacific Network Encryption Industry Revenue (Million), by Component 2024 & 2032
- Figure 35: Asia Pacific Network Encryption Industry Revenue Share (%), by Component 2024 & 2032
- Figure 36: Asia Pacific Network Encryption Industry Revenue (Million), by Organization Size 2024 & 2032
- Figure 37: Asia Pacific Network Encryption Industry Revenue Share (%), by Organization Size 2024 & 2032
- Figure 38: Asia Pacific Network Encryption Industry Revenue (Million), by End-user Industry 2024 & 2032
- Figure 39: Asia Pacific Network Encryption Industry Revenue Share (%), by End-user Industry 2024 & 2032
- Figure 40: Asia Pacific Network Encryption Industry Revenue (Million), by Country 2024 & 2032
- Figure 41: Asia Pacific Network Encryption Industry Revenue Share (%), by Country 2024 & 2032
- Figure 42: Latin America Network Encryption Industry Revenue (Million), by Deployment Type 2024 & 2032
- Figure 43: Latin America Network Encryption Industry Revenue Share (%), by Deployment Type 2024 & 2032
- Figure 44: Latin America Network Encryption Industry Revenue (Million), by Component 2024 & 2032
- Figure 45: Latin America Network Encryption Industry Revenue Share (%), by Component 2024 & 2032
- Figure 46: Latin America Network Encryption Industry Revenue (Million), by Organization Size 2024 & 2032
- Figure 47: Latin America Network Encryption Industry Revenue Share (%), by Organization Size 2024 & 2032
- Figure 48: Latin America Network Encryption Industry Revenue (Million), by End-user Industry 2024 & 2032
- Figure 49: Latin America Network Encryption Industry Revenue Share (%), by End-user Industry 2024 & 2032
- Figure 50: Latin America Network Encryption Industry Revenue (Million), by Country 2024 & 2032
- Figure 51: Latin America Network Encryption Industry Revenue Share (%), by Country 2024 & 2032
- Figure 52: Middle East and Africa Network Encryption Industry Revenue (Million), by Deployment Type 2024 & 2032
- Figure 53: Middle East and Africa Network Encryption Industry Revenue Share (%), by Deployment Type 2024 & 2032
- Figure 54: Middle East and Africa Network Encryption Industry Revenue (Million), by Component 2024 & 2032
- Figure 55: Middle East and Africa Network Encryption Industry Revenue Share (%), by Component 2024 & 2032
- Figure 56: Middle East and Africa Network Encryption Industry Revenue (Million), by Organization Size 2024 & 2032
- Figure 57: Middle East and Africa Network Encryption Industry Revenue Share (%), by Organization Size 2024 & 2032
- Figure 58: Middle East and Africa Network Encryption Industry Revenue (Million), by End-user Industry 2024 & 2032
- Figure 59: Middle East and Africa Network Encryption Industry Revenue Share (%), by End-user Industry 2024 & 2032
- Figure 60: Middle East and Africa Network Encryption Industry Revenue (Million), by Country 2024 & 2032
- Figure 61: Middle East and Africa Network Encryption Industry Revenue Share (%), by Country 2024 & 2032
List of Tables
- Table 1: Global Network Encryption Industry Revenue Million Forecast, by Region 2019 & 2032
- Table 2: Global Network Encryption Industry Revenue Million Forecast, by Deployment Type 2019 & 2032
- Table 3: Global Network Encryption Industry Revenue Million Forecast, by Component 2019 & 2032
- Table 4: Global Network Encryption Industry Revenue Million Forecast, by Organization Size 2019 & 2032
- Table 5: Global Network Encryption Industry Revenue Million Forecast, by End-user Industry 2019 & 2032
- Table 6: Global Network Encryption Industry Revenue Million Forecast, by Region 2019 & 2032
- Table 7: Global Network Encryption Industry Revenue Million Forecast, by Country 2019 & 2032
- Table 8: Network Encryption Industry Revenue (Million) Forecast, by Application 2019 & 2032
- Table 9: Global Network Encryption Industry Revenue Million Forecast, by Country 2019 & 2032
- Table 10: Network Encryption Industry Revenue (Million) Forecast, by Application 2019 & 2032
- Table 11: Global Network Encryption Industry Revenue Million Forecast, by Country 2019 & 2032
- Table 12: Network Encryption Industry Revenue (Million) Forecast, by Application 2019 & 2032
- Table 13: Global Network Encryption Industry Revenue Million Forecast, by Country 2019 & 2032
- Table 14: Network Encryption Industry Revenue (Million) Forecast, by Application 2019 & 2032
- Table 15: Global Network Encryption Industry Revenue Million Forecast, by Country 2019 & 2032
- Table 16: Network Encryption Industry Revenue (Million) Forecast, by Application 2019 & 2032
- Table 17: Global Network Encryption Industry Revenue Million Forecast, by Deployment Type 2019 & 2032
- Table 18: Global Network Encryption Industry Revenue Million Forecast, by Component 2019 & 2032
- Table 19: Global Network Encryption Industry Revenue Million Forecast, by Organization Size 2019 & 2032
- Table 20: Global Network Encryption Industry Revenue Million Forecast, by End-user Industry 2019 & 2032
- Table 21: Global Network Encryption Industry Revenue Million Forecast, by Country 2019 & 2032
- Table 22: Global Network Encryption Industry Revenue Million Forecast, by Deployment Type 2019 & 2032
- Table 23: Global Network Encryption Industry Revenue Million Forecast, by Component 2019 & 2032
- Table 24: Global Network Encryption Industry Revenue Million Forecast, by Organization Size 2019 & 2032
- Table 25: Global Network Encryption Industry Revenue Million Forecast, by End-user Industry 2019 & 2032
- Table 26: Global Network Encryption Industry Revenue Million Forecast, by Country 2019 & 2032
- Table 27: Global Network Encryption Industry Revenue Million Forecast, by Deployment Type 2019 & 2032
- Table 28: Global Network Encryption Industry Revenue Million Forecast, by Component 2019 & 2032
- Table 29: Global Network Encryption Industry Revenue Million Forecast, by Organization Size 2019 & 2032
- Table 30: Global Network Encryption Industry Revenue Million Forecast, by End-user Industry 2019 & 2032
- Table 31: Global Network Encryption Industry Revenue Million Forecast, by Country 2019 & 2032
- Table 32: Global Network Encryption Industry Revenue Million Forecast, by Deployment Type 2019 & 2032
- Table 33: Global Network Encryption Industry Revenue Million Forecast, by Component 2019 & 2032
- Table 34: Global Network Encryption Industry Revenue Million Forecast, by Organization Size 2019 & 2032
- Table 35: Global Network Encryption Industry Revenue Million Forecast, by End-user Industry 2019 & 2032
- Table 36: Global Network Encryption Industry Revenue Million Forecast, by Country 2019 & 2032
- Table 37: Global Network Encryption Industry Revenue Million Forecast, by Deployment Type 2019 & 2032
- Table 38: Global Network Encryption Industry Revenue Million Forecast, by Component 2019 & 2032
- Table 39: Global Network Encryption Industry Revenue Million Forecast, by Organization Size 2019 & 2032
- Table 40: Global Network Encryption Industry Revenue Million Forecast, by End-user Industry 2019 & 2032
- Table 41: Global Network Encryption Industry Revenue Million Forecast, by Country 2019 & 2032
Frequently Asked Questions
1. What is the projected Compound Annual Growth Rate (CAGR) of the Network Encryption Industry?
The projected CAGR is approximately > 8.43%.
2. Which companies are prominent players in the Network Encryption Industry?
Key companies in the market include Ciena Corporation*List Not Exhaustive, Raytheon Technologies Corporation, Securosys SA, Packetlight Networks, ATMedia Gmbh, Viasat Inc, Certes Networks Inc, Juniper Networks Inc, Atos SE, Senetas Corporation Ltd, Colt Technology Services Group Ltd, Rohde & Schwarz Cybersecurity GmbH, Thales Trusted Cyber Technologies.
3. What are the main segments of the Network Encryption Industry?
The market segments include Deployment Type, Component, Organization Size, End-user Industry.
4. Can you provide details about the market size?
The market size is estimated to be USD 4.83 Million as of 2022.
5. What are some drivers contributing to market growth?
Increasing Number of Network Security Breaches; Increasing Adoption of Cloud Technologies by Numerous Organizations.
6. What are the notable trends driving market growth?
Telecom and IT Sector is Expected to Hold a Significant Share of the Market.
7. Are there any restraints impacting market growth?
Cybersecurity Threats to Satellite Communication; Reliance on High-cost Satellite Equipment.
8. Can you provide examples of recent developments in the market?
October 2023 - Nokia announced that it has been selected with partner DPR by K2 Telecom Brazil to offer solutions that would assist the ISP to strengthen its network security and create new revenue streams. Nokia would deploy its identical and innovative BNG/CGNAT solution, enabling K2 Telecom to offer all IP infrastructure and ISP requirements as-a-service and providing cloud-based DDoS defense as-a-service
9. What pricing options are available for accessing the report?
Pricing options include single-user, multi-user, and enterprise licenses priced at USD 4750, USD 5250, and USD 8750 respectively.
10. Is the market size provided in terms of value or volume?
The market size is provided in terms of value, measured in Million.
11. Are there any specific market keywords associated with the report?
Yes, the market keyword associated with the report is "Network Encryption Industry," which aids in identifying and referencing the specific market segment covered.
12. How do I determine which pricing option suits my needs best?
The pricing options vary based on user requirements and access needs. Individual users may opt for single-user licenses, while businesses requiring broader access may choose multi-user or enterprise licenses for cost-effective access to the report.
13. Are there any additional resources or data provided in the Network Encryption Industry report?
While the report offers comprehensive insights, it's advisable to review the specific contents or supplementary materials provided to ascertain if additional resources or data are available.
14. How can I stay updated on further developments or reports in the Network Encryption Industry?
To stay informed about further developments, trends, and reports in the Network Encryption Industry, consider subscribing to industry newsletters, following relevant companies and organizations, or regularly checking reputable industry news sources and publications.
Methodology
Step 1 - Identification of Relevant Samples Size from Population Database


Step 2 - Approaches for Defining Global Market Size (Value, Volume* & Price*)

Note*: In applicable scenarios
Step 3 - Data Sources
Primary Research
- Web Analytics
- Survey Reports
- Research Institute
- Latest Research Reports
- Opinion Leaders
Secondary Research
- Annual Reports
- White Paper
- Latest Press Release
- Industry Association
- Paid Database
- Investor Presentations

Step 4 - Data Triangulation
Involves using different sources of information in order to increase the validity of a study
These sources are likely to be stakeholders in a program - participants, other researchers, program staff, other community members, and so on.
Then we put all data in single framework & apply various statistical tools to find out the dynamic on the market.
During the analysis stage, feedback from the stakeholder groups would be compared to determine areas of agreement as well as areas of divergence


