
Key Insights
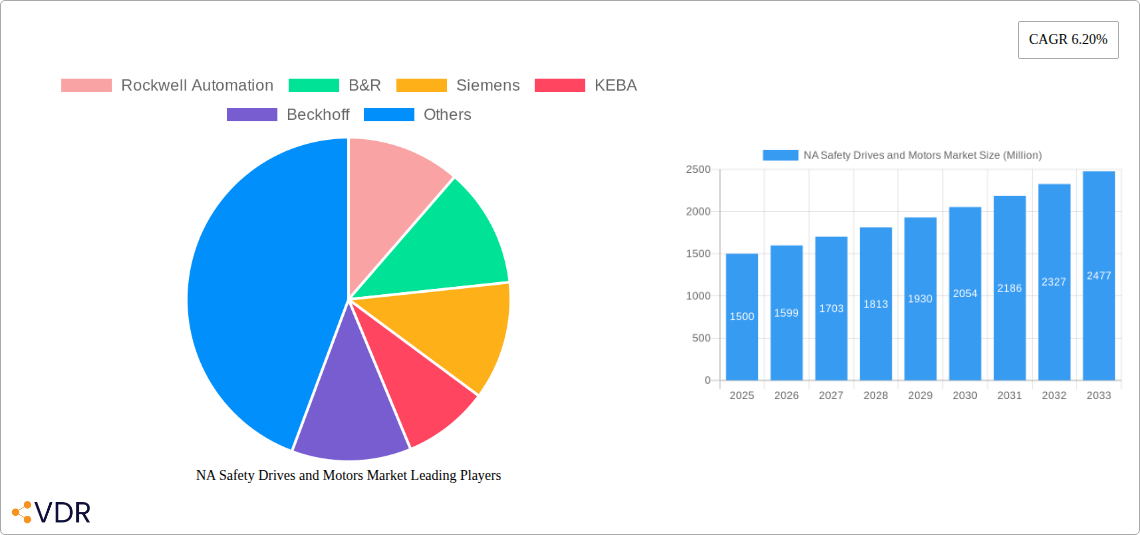
The North American safety drives and motors market is experiencing robust growth, driven by increasing automation across various end-user industries and stringent safety regulations. The market's Compound Annual Growth Rate (CAGR) of 6.20% from 2019 to 2024 suggests a significant expansion, projected to continue through 2033. Key drivers include the rising demand for enhanced safety features in industrial automation systems, particularly within sectors like energy and power, mining, oil and gas, manufacturing, and petrochemicals. The adoption of advanced technologies like programmable logic controllers (PLCs) and safety-instrumented systems (SIS) further fuels market growth. Growth is particularly strong in the US, benefiting from robust industrial production and a focus on worker safety. Canada also contributes significantly, driven by similar trends within its manufacturing and resource extraction sectors. The market is segmented by drive type (AC and DC drives), motor type, and end-user industry, offering various opportunities for specialized solutions. While data for specific market sizes in millions is not provided, a logical projection based on the 6.20% CAGR from 2019–2024 and considering market dynamics points towards substantial revenue generation, with significant growth expected in the coming years. Competitive landscape analysis reveals key players like Rockwell Automation, Siemens, ABB, and others, constantly innovating to meet the evolving demands of the market.
The market's segmentation allows for targeted strategies. For instance, focusing on the energy and power sector, characterized by high safety requirements and significant investments in upgrading infrastructure, presents a lucrative opportunity. Similarly, the increasing adoption of Industry 4.0 principles across various industries should drive demand for sophisticated safety drives and motors with advanced functionalities. Though potential restraints such as economic downturns could temporarily impact growth, the long-term outlook for the North American safety drives and motors market remains positive, driven by underlying trends towards increased automation and stricter safety standards. The market’s growth is expected to be further fueled by advancements in motor technology, offering greater efficiency and improved safety performance.
NA Safety Drives and Motors Market: A Comprehensive Report (2019-2033)
This in-depth report provides a comprehensive analysis of the North American (NA) Safety Drives and Motors market, covering market dynamics, growth trends, regional performance, product landscape, key players, and future outlook. The study period spans 2019-2033, with 2025 as the base and estimated year. The report segments the market by Type (Drives, DC Drives, Motors), End-User Industry (Energy and Power, Mining, Oil and Gas, Manufacturing, Petroleum and Chemical, Other End-User Industries), and Country (United States, Canada). Market size is presented in million units.
NA Safety Drives and Motors Market Dynamics & Structure
The NA safety drives and motors market is characterized by a moderately consolidated structure with key players like Rockwell Automation, Siemens, ABB, and others holding significant market share. Technological innovation, driven by the increasing demand for automation and safety in various industries, is a major growth driver. Stringent safety regulations across different sectors, particularly in manufacturing and energy, further propel market expansion. The market faces competition from alternative technologies, but the demand for enhanced safety and efficiency outweighs these challenges. Mergers and acquisitions (M&A) activity in the industry is expected to remain moderate, with strategic partnerships focusing on technological advancements and market penetration.
- Market Concentration: Moderately consolidated, with top players holding xx% market share (2024).
- Technological Innovation: Focus on compact designs, increased efficiency, and improved safety features.
- Regulatory Framework: Stringent safety regulations across various industries.
- Competitive Substitutes: Limited, due to the specialized nature of safety drives and motors.
- M&A Trends: Moderate activity, with strategic partnerships dominating.
- Innovation Barriers: High initial investment costs for R&D and regulatory compliance.
NA Safety Drives and Motors Market Growth Trends & Insights
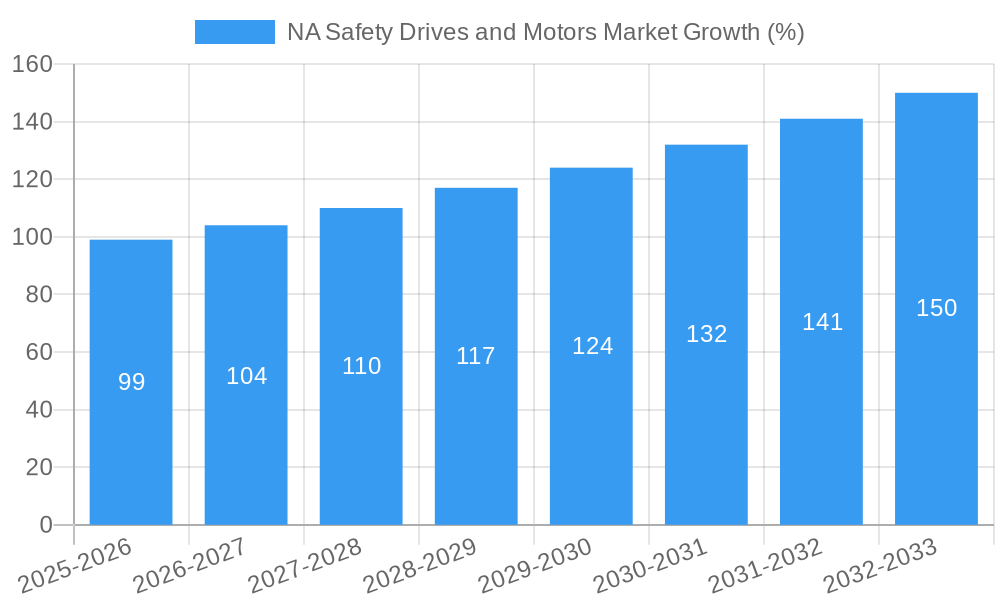
The NA safety drives and motors market exhibits a steady growth trajectory, driven by increasing automation across various end-user industries. The market is expected to experience a CAGR of xx% during the forecast period (2025-2033), reaching a market size of xx million units by 2033. Technological advancements, such as the development of more efficient and compact drives, are accelerating market adoption. The shift towards Industry 4.0 and the growing focus on safety in industrial settings are key factors driving market expansion. Consumer behavior trends indicate a preference for higher efficiency, enhanced safety features, and reduced maintenance needs.
Dominant Regions, Countries, or Segments in NA Safety Drives and Motors Market
The United States dominates the NA safety drives and motors market, accounting for xx% of the total market share in 2024, driven by robust manufacturing activity and a high concentration of industrial facilities. The manufacturing segment is the largest end-user industry, fueled by growing automation adoption and stringent safety norms. Within the product type segment, drives hold a larger market share compared to motors due to increased automation implementation and demand for advanced control systems. Canada holds a smaller but steadily growing market share.
- United States: High industrial activity, robust manufacturing sector, stringent safety regulations.
- Canada: Growing automation investments, government support for industrial growth.
- Manufacturing: Significant demand for safety drives and motors due to increased automation.
- Drives: Larger market share compared to motors driven by process automation needs.
NA Safety Drives and Motors Market Product Landscape
The NA safety drives and motors market features a diverse range of products offering various safety features, efficiency levels, and power ratings. Recent product innovations focus on compact design, higher efficiency, improved connectivity, and enhanced safety certifications. Unique selling propositions include advanced monitoring capabilities, predictive maintenance functionalities, and simplified integration with existing industrial control systems. Technological advancements focus on energy efficiency, improved safety, and smart functionalities, enabling seamless integration with IIoT platforms.
Key Drivers, Barriers & Challenges in NA Safety Drives and Motors Market
Key Drivers:
- Growing automation across various industries.
- Stringent safety regulations and increasing safety consciousness.
- Technological advancements offering improved efficiency and safety.
- Increased adoption of Industry 4.0 initiatives.
Key Challenges:
- High initial investment costs.
- Supply chain disruptions impacting component availability.
- Competitive landscape with established and emerging players.
- Regulatory complexities and compliance requirements.
Emerging Opportunities in NA Safety Drives and Motors Market
Emerging opportunities lie in the increasing adoption of IIoT technologies, the growth of smart factories, and the demand for customized safety solutions. Untapped markets include smaller and medium-sized enterprises (SMEs) that are gradually adopting automation. Innovative applications in renewable energy, smart grids, and robotics offer substantial growth potential. Evolving consumer preferences for energy-efficient, compact, and intelligent safety devices present further opportunities.
Growth Accelerators in the NA Safety Drives and Motors Market Industry
Long-term growth is driven by technological advancements such as AI-powered predictive maintenance, the increasing adoption of integrated safety solutions, and strategic partnerships for market expansion. Government initiatives promoting automation and industrial safety will further fuel market growth. Expansion into new applications like autonomous vehicles and robotics will create additional growth avenues.
Key Players Shaping the NA Safety Drives and Motors Market Market
- Rockwell Automation
- B&R
- Siemens
- KEBA
- Beckhoff
- WEG
- Hoerbiger
- SIGMATEK Safety Systems
- CG North America
- ABB Limited
- Pilz
- KOLLMORGEN
Notable Milestones in NA Safety Drives and Motors Market Sector
- October 2021: Rockwell Automation launched the PowerFlex 6000T drive, a compact and efficient solution for various industrial applications.
- September 2021: Siemens launched the SIMOTICS S-1FS2 line of servomotors, designed for cleanroom environments.
In-Depth NA Safety Drives and Motors Market Market Outlook
The NA safety drives and motors market is poised for sustained growth, driven by the ongoing trend of automation, Industry 4.0 initiatives, and increasing focus on safety. Strategic partnerships, technological innovations, and expansion into new applications will unlock significant growth potential. The market presents compelling opportunities for companies focusing on energy efficiency, smart functionalities, and enhanced safety features.
NA Safety Drives and Motors Market Segmentation
-
1. Type
-
1.1. Drives
- 1.1.1. AC Drives
- 1.1.2. DC Drives
-
1.2. Motors
- 1.2.1. AC Motors
- 1.2.2. DC Motors
-
1.1. Drives
-
2. End-User Industry
- 2.1. Energy and Power
- 2.2. Mining
- 2.3. Oil and gas
- 2.4. Manufacturing
- 2.5. Petrolium and Chemical
- 2.6. Other End-User Industries
NA Safety Drives and Motors Market Segmentation By Geography
-
1. North America
- 1.1. United States
- 1.2. Canada
- 1.3. Mexico
-
2. South America
- 2.1. Brazil
- 2.2. Argentina
- 2.3. Rest of South America
-
3. Europe
- 3.1. United Kingdom
- 3.2. Germany
- 3.3. France
- 3.4. Italy
- 3.5. Spain
- 3.6. Russia
- 3.7. Benelux
- 3.8. Nordics
- 3.9. Rest of Europe
-
4. Middle East & Africa
- 4.1. Turkey
- 4.2. Israel
- 4.3. GCC
- 4.4. North Africa
- 4.5. South Africa
- 4.6. Rest of Middle East & Africa
-
5. Asia Pacific
- 5.1. China
- 5.2. India
- 5.3. Japan
- 5.4. South Korea
- 5.5. ASEAN
- 5.6. Oceania
- 5.7. Rest of Asia Pacific
NA Safety Drives and Motors Market REPORT HIGHLIGHTS
| Aspects | Details |
|---|---|
| Study Period | 2019-2033 |
| Base Year | 2024 |
| Estimated Year | 2025 |
| Forecast Period | 2025-2033 |
| Historical Period | 2019-2024 |
| Growth Rate | CAGR of 6.20% from 2019-2033 |
| Segmentation |
|
Table of Contents
- 1. Introduction
- 1.1. Research Scope
- 1.2. Market Segmentation
- 1.3. Research Methodology
- 1.4. Definitions and Assumptions
- 2. Executive Summary
- 2.1. Introduction
- 3. Market Dynamics
- 3.1. Introduction
- 3.2. Market Drivers
- 3.2.1. Industry Safety Standards; Demand for Safe Equipment; Flexible Functionality; High Degree of Cost-Effectiveness
- 3.3. Market Restrains
- 3.3.1. Complexity of Standards
- 3.4. Market Trends
- 3.4.1. Oil and Gas Sector is Expected to Hold the Maximum Market Share
- 4. Market Factor Analysis
- 4.1. Porters Five Forces
- 4.2. Supply/Value Chain
- 4.3. PESTEL analysis
- 4.4. Market Entropy
- 4.5. Patent/Trademark Analysis
- 5. Global NA Safety Drives and Motors Market Analysis, Insights and Forecast, 2019-2031
- 5.1. Market Analysis, Insights and Forecast - by Type
- 5.1.1. Drives
- 5.1.1.1. AC Drives
- 5.1.1.2. DC Drives
- 5.1.2. Motors
- 5.1.2.1. AC Motors
- 5.1.2.2. DC Motors
- 5.1.1. Drives
- 5.2. Market Analysis, Insights and Forecast - by End-User Industry
- 5.2.1. Energy and Power
- 5.2.2. Mining
- 5.2.3. Oil and gas
- 5.2.4. Manufacturing
- 5.2.5. Petrolium and Chemical
- 5.2.6. Other End-User Industries
- 5.3. Market Analysis, Insights and Forecast - by Region
- 5.3.1. North America
- 5.3.2. South America
- 5.3.3. Europe
- 5.3.4. Middle East & Africa
- 5.3.5. Asia Pacific
- 5.1. Market Analysis, Insights and Forecast - by Type
- 6. North America NA Safety Drives and Motors Market Analysis, Insights and Forecast, 2019-2031
- 6.1. Market Analysis, Insights and Forecast - by Type
- 6.1.1. Drives
- 6.1.1.1. AC Drives
- 6.1.1.2. DC Drives
- 6.1.2. Motors
- 6.1.2.1. AC Motors
- 6.1.2.2. DC Motors
- 6.1.1. Drives
- 6.2. Market Analysis, Insights and Forecast - by End-User Industry
- 6.2.1. Energy and Power
- 6.2.2. Mining
- 6.2.3. Oil and gas
- 6.2.4. Manufacturing
- 6.2.5. Petrolium and Chemical
- 6.2.6. Other End-User Industries
- 6.1. Market Analysis, Insights and Forecast - by Type
- 7. South America NA Safety Drives and Motors Market Analysis, Insights and Forecast, 2019-2031
- 7.1. Market Analysis, Insights and Forecast - by Type
- 7.1.1. Drives
- 7.1.1.1. AC Drives
- 7.1.1.2. DC Drives
- 7.1.2. Motors
- 7.1.2.1. AC Motors
- 7.1.2.2. DC Motors
- 7.1.1. Drives
- 7.2. Market Analysis, Insights and Forecast - by End-User Industry
- 7.2.1. Energy and Power
- 7.2.2. Mining
- 7.2.3. Oil and gas
- 7.2.4. Manufacturing
- 7.2.5. Petrolium and Chemical
- 7.2.6. Other End-User Industries
- 7.1. Market Analysis, Insights and Forecast - by Type
- 8. Europe NA Safety Drives and Motors Market Analysis, Insights and Forecast, 2019-2031
- 8.1. Market Analysis, Insights and Forecast - by Type
- 8.1.1. Drives
- 8.1.1.1. AC Drives
- 8.1.1.2. DC Drives
- 8.1.2. Motors
- 8.1.2.1. AC Motors
- 8.1.2.2. DC Motors
- 8.1.1. Drives
- 8.2. Market Analysis, Insights and Forecast - by End-User Industry
- 8.2.1. Energy and Power
- 8.2.2. Mining
- 8.2.3. Oil and gas
- 8.2.4. Manufacturing
- 8.2.5. Petrolium and Chemical
- 8.2.6. Other End-User Industries
- 8.1. Market Analysis, Insights and Forecast - by Type
- 9. Middle East & Africa NA Safety Drives and Motors Market Analysis, Insights and Forecast, 2019-2031
- 9.1. Market Analysis, Insights and Forecast - by Type
- 9.1.1. Drives
- 9.1.1.1. AC Drives
- 9.1.1.2. DC Drives
- 9.1.2. Motors
- 9.1.2.1. AC Motors
- 9.1.2.2. DC Motors
- 9.1.1. Drives
- 9.2. Market Analysis, Insights and Forecast - by End-User Industry
- 9.2.1. Energy and Power
- 9.2.2. Mining
- 9.2.3. Oil and gas
- 9.2.4. Manufacturing
- 9.2.5. Petrolium and Chemical
- 9.2.6. Other End-User Industries
- 9.1. Market Analysis, Insights and Forecast - by Type
- 10. Asia Pacific NA Safety Drives and Motors Market Analysis, Insights and Forecast, 2019-2031
- 10.1. Market Analysis, Insights and Forecast - by Type
- 10.1.1. Drives
- 10.1.1.1. AC Drives
- 10.1.1.2. DC Drives
- 10.1.2. Motors
- 10.1.2.1. AC Motors
- 10.1.2.2. DC Motors
- 10.1.1. Drives
- 10.2. Market Analysis, Insights and Forecast - by End-User Industry
- 10.2.1. Energy and Power
- 10.2.2. Mining
- 10.2.3. Oil and gas
- 10.2.4. Manufacturing
- 10.2.5. Petrolium and Chemical
- 10.2.6. Other End-User Industries
- 10.1. Market Analysis, Insights and Forecast - by Type
- 11. North America NA Safety Drives and Motors Market Analysis, Insights and Forecast, 2019-2031
- 11.1. Market Analysis, Insights and Forecast - By Country/Sub-region
- 11.1.1.
- 12. Europe NA Safety Drives and Motors Market Analysis, Insights and Forecast, 2019-2031
- 12.1. Market Analysis, Insights and Forecast - By Country/Sub-region
- 12.1.1.
- 13. Asia Pacific NA Safety Drives and Motors Market Analysis, Insights and Forecast, 2019-2031
- 13.1. Market Analysis, Insights and Forecast - By Country/Sub-region
- 13.1.1.
- 14. Latin America NA Safety Drives and Motors Market Analysis, Insights and Forecast, 2019-2031
- 14.1. Market Analysis, Insights and Forecast - By Country/Sub-region
- 14.1.1.
- 15. Middle East NA Safety Drives and Motors Market Analysis, Insights and Forecast, 2019-2031
- 15.1. Market Analysis, Insights and Forecast - By Country/Sub-region
- 15.1.1.
- 16. Competitive Analysis
- 16.1. Global Market Share Analysis 2024
- 16.2. Company Profiles
- 16.2.1 Rockwell Automation
- 16.2.1.1. Overview
- 16.2.1.2. Products
- 16.2.1.3. SWOT Analysis
- 16.2.1.4. Recent Developments
- 16.2.1.5. Financials (Based on Availability)
- 16.2.2 B&R
- 16.2.2.1. Overview
- 16.2.2.2. Products
- 16.2.2.3. SWOT Analysis
- 16.2.2.4. Recent Developments
- 16.2.2.5. Financials (Based on Availability)
- 16.2.3 Siemens
- 16.2.3.1. Overview
- 16.2.3.2. Products
- 16.2.3.3. SWOT Analysis
- 16.2.3.4. Recent Developments
- 16.2.3.5. Financials (Based on Availability)
- 16.2.4 KEBA
- 16.2.4.1. Overview
- 16.2.4.2. Products
- 16.2.4.3. SWOT Analysis
- 16.2.4.4. Recent Developments
- 16.2.4.5. Financials (Based on Availability)
- 16.2.5 Beckhoff
- 16.2.5.1. Overview
- 16.2.5.2. Products
- 16.2.5.3. SWOT Analysis
- 16.2.5.4. Recent Developments
- 16.2.5.5. Financials (Based on Availability)
- 16.2.6 WEG
- 16.2.6.1. Overview
- 16.2.6.2. Products
- 16.2.6.3. SWOT Analysis
- 16.2.6.4. Recent Developments
- 16.2.6.5. Financials (Based on Availability)
- 16.2.7 Hoerbiger
- 16.2.7.1. Overview
- 16.2.7.2. Products
- 16.2.7.3. SWOT Analysis
- 16.2.7.4. Recent Developments
- 16.2.7.5. Financials (Based on Availability)
- 16.2.8 SIGMATEK Safety Systems
- 16.2.8.1. Overview
- 16.2.8.2. Products
- 16.2.8.3. SWOT Analysis
- 16.2.8.4. Recent Developments
- 16.2.8.5. Financials (Based on Availability)
- 16.2.9 CG North Americ
- 16.2.9.1. Overview
- 16.2.9.2. Products
- 16.2.9.3. SWOT Analysis
- 16.2.9.4. Recent Developments
- 16.2.9.5. Financials (Based on Availability)
- 16.2.10 ABB Limited
- 16.2.10.1. Overview
- 16.2.10.2. Products
- 16.2.10.3. SWOT Analysis
- 16.2.10.4. Recent Developments
- 16.2.10.5. Financials (Based on Availability)
- 16.2.11 Pilz
- 16.2.11.1. Overview
- 16.2.11.2. Products
- 16.2.11.3. SWOT Analysis
- 16.2.11.4. Recent Developments
- 16.2.11.5. Financials (Based on Availability)
- 16.2.12 KOLLMORGEN
- 16.2.12.1. Overview
- 16.2.12.2. Products
- 16.2.12.3. SWOT Analysis
- 16.2.12.4. Recent Developments
- 16.2.12.5. Financials (Based on Availability)
- 16.2.1 Rockwell Automation
List of Figures
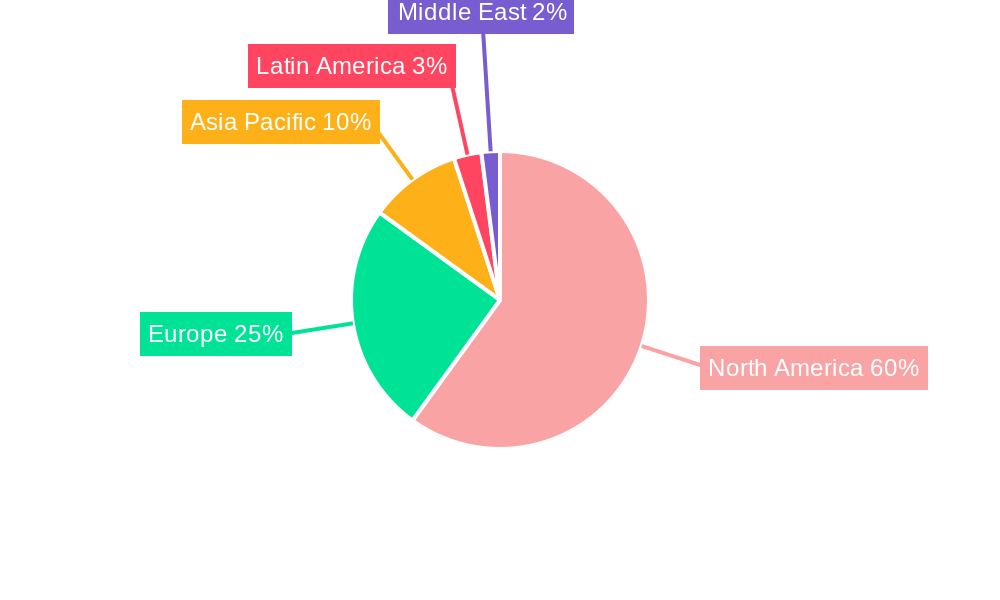
- Figure 1: Global NA Safety Drives and Motors Market Revenue Breakdown (Million, %) by Region 2024 & 2032
- Figure 2: North America NA Safety Drives and Motors Market Revenue (Million), by Country 2024 & 2032
- Figure 3: North America NA Safety Drives and Motors Market Revenue Share (%), by Country 2024 & 2032
- Figure 4: Europe NA Safety Drives and Motors Market Revenue (Million), by Country 2024 & 2032
- Figure 5: Europe NA Safety Drives and Motors Market Revenue Share (%), by Country 2024 & 2032
- Figure 6: Asia Pacific NA Safety Drives and Motors Market Revenue (Million), by Country 2024 & 2032
- Figure 7: Asia Pacific NA Safety Drives and Motors Market Revenue Share (%), by Country 2024 & 2032
- Figure 8: Latin America NA Safety Drives and Motors Market Revenue (Million), by Country 2024 & 2032
- Figure 9: Latin America NA Safety Drives and Motors Market Revenue Share (%), by Country 2024 & 2032
- Figure 10: Middle East NA Safety Drives and Motors Market Revenue (Million), by Country 2024 & 2032
- Figure 11: Middle East NA Safety Drives and Motors Market Revenue Share (%), by Country 2024 & 2032
- Figure 12: North America NA Safety Drives and Motors Market Revenue (Million), by Type 2024 & 2032
- Figure 13: North America NA Safety Drives and Motors Market Revenue Share (%), by Type 2024 & 2032
- Figure 14: North America NA Safety Drives and Motors Market Revenue (Million), by End-User Industry 2024 & 2032
- Figure 15: North America NA Safety Drives and Motors Market Revenue Share (%), by End-User Industry 2024 & 2032
- Figure 16: North America NA Safety Drives and Motors Market Revenue (Million), by Country 2024 & 2032
- Figure 17: North America NA Safety Drives and Motors Market Revenue Share (%), by Country 2024 & 2032
- Figure 18: South America NA Safety Drives and Motors Market Revenue (Million), by Type 2024 & 2032
- Figure 19: South America NA Safety Drives and Motors Market Revenue Share (%), by Type 2024 & 2032
- Figure 20: South America NA Safety Drives and Motors Market Revenue (Million), by End-User Industry 2024 & 2032
- Figure 21: South America NA Safety Drives and Motors Market Revenue Share (%), by End-User Industry 2024 & 2032
- Figure 22: South America NA Safety Drives and Motors Market Revenue (Million), by Country 2024 & 2032
- Figure 23: South America NA Safety Drives and Motors Market Revenue Share (%), by Country 2024 & 2032
- Figure 24: Europe NA Safety Drives and Motors Market Revenue (Million), by Type 2024 & 2032
- Figure 25: Europe NA Safety Drives and Motors Market Revenue Share (%), by Type 2024 & 2032
- Figure 26: Europe NA Safety Drives and Motors Market Revenue (Million), by End-User Industry 2024 & 2032
- Figure 27: Europe NA Safety Drives and Motors Market Revenue Share (%), by End-User Industry 2024 & 2032
- Figure 28: Europe NA Safety Drives and Motors Market Revenue (Million), by Country 2024 & 2032
- Figure 29: Europe NA Safety Drives and Motors Market Revenue Share (%), by Country 2024 & 2032
- Figure 30: Middle East & Africa NA Safety Drives and Motors Market Revenue (Million), by Type 2024 & 2032
- Figure 31: Middle East & Africa NA Safety Drives and Motors Market Revenue Share (%), by Type 2024 & 2032
- Figure 32: Middle East & Africa NA Safety Drives and Motors Market Revenue (Million), by End-User Industry 2024 & 2032
- Figure 33: Middle East & Africa NA Safety Drives and Motors Market Revenue Share (%), by End-User Industry 2024 & 2032
- Figure 34: Middle East & Africa NA Safety Drives and Motors Market Revenue (Million), by Country 2024 & 2032
- Figure 35: Middle East & Africa NA Safety Drives and Motors Market Revenue Share (%), by Country 2024 & 2032
- Figure 36: Asia Pacific NA Safety Drives and Motors Market Revenue (Million), by Type 2024 & 2032
- Figure 37: Asia Pacific NA Safety Drives and Motors Market Revenue Share (%), by Type 2024 & 2032
- Figure 38: Asia Pacific NA Safety Drives and Motors Market Revenue (Million), by End-User Industry 2024 & 2032
- Figure 39: Asia Pacific NA Safety Drives and Motors Market Revenue Share (%), by End-User Industry 2024 & 2032
- Figure 40: Asia Pacific NA Safety Drives and Motors Market Revenue (Million), by Country 2024 & 2032
- Figure 41: Asia Pacific NA Safety Drives and Motors Market Revenue Share (%), by Country 2024 & 2032
List of Tables
- Table 1: Global NA Safety Drives and Motors Market Revenue Million Forecast, by Region 2019 & 2032
- Table 2: Global NA Safety Drives and Motors Market Revenue Million Forecast, by Type 2019 & 2032
- Table 3: Global NA Safety Drives and Motors Market Revenue Million Forecast, by End-User Industry 2019 & 2032
- Table 4: Global NA Safety Drives and Motors Market Revenue Million Forecast, by Region 2019 & 2032
- Table 5: Global NA Safety Drives and Motors Market Revenue Million Forecast, by Country 2019 & 2032
- Table 6: NA Safety Drives and Motors Market Revenue (Million) Forecast, by Application 2019 & 2032
- Table 7: Global NA Safety Drives and Motors Market Revenue Million Forecast, by Country 2019 & 2032
- Table 8: NA Safety Drives and Motors Market Revenue (Million) Forecast, by Application 2019 & 2032
- Table 9: Global NA Safety Drives and Motors Market Revenue Million Forecast, by Country 2019 & 2032
- Table 10: NA Safety Drives and Motors Market Revenue (Million) Forecast, by Application 2019 & 2032
- Table 11: Global NA Safety Drives and Motors Market Revenue Million Forecast, by Country 2019 & 2032
- Table 12: NA Safety Drives and Motors Market Revenue (Million) Forecast, by Application 2019 & 2032
- Table 13: Global NA Safety Drives and Motors Market Revenue Million Forecast, by Country 2019 & 2032
- Table 14: NA Safety Drives and Motors Market Revenue (Million) Forecast, by Application 2019 & 2032
- Table 15: Global NA Safety Drives and Motors Market Revenue Million Forecast, by Type 2019 & 2032
- Table 16: Global NA Safety Drives and Motors Market Revenue Million Forecast, by End-User Industry 2019 & 2032
- Table 17: Global NA Safety Drives and Motors Market Revenue Million Forecast, by Country 2019 & 2032
- Table 18: United States NA Safety Drives and Motors Market Revenue (Million) Forecast, by Application 2019 & 2032
- Table 19: Canada NA Safety Drives and Motors Market Revenue (Million) Forecast, by Application 2019 & 2032
- Table 20: Mexico NA Safety Drives and Motors Market Revenue (Million) Forecast, by Application 2019 & 2032
- Table 21: Global NA Safety Drives and Motors Market Revenue Million Forecast, by Type 2019 & 2032
- Table 22: Global NA Safety Drives and Motors Market Revenue Million Forecast, by End-User Industry 2019 & 2032
- Table 23: Global NA Safety Drives and Motors Market Revenue Million Forecast, by Country 2019 & 2032
- Table 24: Brazil NA Safety Drives and Motors Market Revenue (Million) Forecast, by Application 2019 & 2032
- Table 25: Argentina NA Safety Drives and Motors Market Revenue (Million) Forecast, by Application 2019 & 2032
- Table 26: Rest of South America NA Safety Drives and Motors Market Revenue (Million) Forecast, by Application 2019 & 2032
- Table 27: Global NA Safety Drives and Motors Market Revenue Million Forecast, by Type 2019 & 2032
- Table 28: Global NA Safety Drives and Motors Market Revenue Million Forecast, by End-User Industry 2019 & 2032
- Table 29: Global NA Safety Drives and Motors Market Revenue Million Forecast, by Country 2019 & 2032
- Table 30: United Kingdom NA Safety Drives and Motors Market Revenue (Million) Forecast, by Application 2019 & 2032
- Table 31: Germany NA Safety Drives and Motors Market Revenue (Million) Forecast, by Application 2019 & 2032
- Table 32: France NA Safety Drives and Motors Market Revenue (Million) Forecast, by Application 2019 & 2032
- Table 33: Italy NA Safety Drives and Motors Market Revenue (Million) Forecast, by Application 2019 & 2032
- Table 34: Spain NA Safety Drives and Motors Market Revenue (Million) Forecast, by Application 2019 & 2032
- Table 35: Russia NA Safety Drives and Motors Market Revenue (Million) Forecast, by Application 2019 & 2032
- Table 36: Benelux NA Safety Drives and Motors Market Revenue (Million) Forecast, by Application 2019 & 2032
- Table 37: Nordics NA Safety Drives and Motors Market Revenue (Million) Forecast, by Application 2019 & 2032
- Table 38: Rest of Europe NA Safety Drives and Motors Market Revenue (Million) Forecast, by Application 2019 & 2032
- Table 39: Global NA Safety Drives and Motors Market Revenue Million Forecast, by Type 2019 & 2032
- Table 40: Global NA Safety Drives and Motors Market Revenue Million Forecast, by End-User Industry 2019 & 2032
- Table 41: Global NA Safety Drives and Motors Market Revenue Million Forecast, by Country 2019 & 2032
- Table 42: Turkey NA Safety Drives and Motors Market Revenue (Million) Forecast, by Application 2019 & 2032
- Table 43: Israel NA Safety Drives and Motors Market Revenue (Million) Forecast, by Application 2019 & 2032
- Table 44: GCC NA Safety Drives and Motors Market Revenue (Million) Forecast, by Application 2019 & 2032
- Table 45: North Africa NA Safety Drives and Motors Market Revenue (Million) Forecast, by Application 2019 & 2032
- Table 46: South Africa NA Safety Drives and Motors Market Revenue (Million) Forecast, by Application 2019 & 2032
- Table 47: Rest of Middle East & Africa NA Safety Drives and Motors Market Revenue (Million) Forecast, by Application 2019 & 2032
- Table 48: Global NA Safety Drives and Motors Market Revenue Million Forecast, by Type 2019 & 2032
- Table 49: Global NA Safety Drives and Motors Market Revenue Million Forecast, by End-User Industry 2019 & 2032
- Table 50: Global NA Safety Drives and Motors Market Revenue Million Forecast, by Country 2019 & 2032
- Table 51: China NA Safety Drives and Motors Market Revenue (Million) Forecast, by Application 2019 & 2032
- Table 52: India NA Safety Drives and Motors Market Revenue (Million) Forecast, by Application 2019 & 2032
- Table 53: Japan NA Safety Drives and Motors Market Revenue (Million) Forecast, by Application 2019 & 2032
- Table 54: South Korea NA Safety Drives and Motors Market Revenue (Million) Forecast, by Application 2019 & 2032
- Table 55: ASEAN NA Safety Drives and Motors Market Revenue (Million) Forecast, by Application 2019 & 2032
- Table 56: Oceania NA Safety Drives and Motors Market Revenue (Million) Forecast, by Application 2019 & 2032
- Table 57: Rest of Asia Pacific NA Safety Drives and Motors Market Revenue (Million) Forecast, by Application 2019 & 2032
Frequently Asked Questions
1. What is the projected Compound Annual Growth Rate (CAGR) of the NA Safety Drives and Motors Market?
The projected CAGR is approximately 6.20%.
2. Which companies are prominent players in the NA Safety Drives and Motors Market?
Key companies in the market include Rockwell Automation, B&R, Siemens, KEBA, Beckhoff, WEG, Hoerbiger, SIGMATEK Safety Systems, CG North Americ, ABB Limited, Pilz, KOLLMORGEN.
3. What are the main segments of the NA Safety Drives and Motors Market?
The market segments include Type, End-User Industry.
4. Can you provide details about the market size?
The market size is estimated to be USD XX Million as of 2022.
5. What are some drivers contributing to market growth?
Industry Safety Standards; Demand for Safe Equipment; Flexible Functionality; High Degree of Cost-Effectiveness.
6. What are the notable trends driving market growth?
Oil and Gas Sector is Expected to Hold the Maximum Market Share.
7. Are there any restraints impacting market growth?
Complexity of Standards.
8. Can you provide examples of recent developments in the market?
October 2021 - Rockwell Automation Ltd. launched the PowerFlex 6000T drive that delivers efficient performance in a compact design. The drive can accept up to 13.8 kV primary voltage in a best-in-class footprint of 2,310 to 3,010 mm (7.58 to 9.87 feet). Because of its compact design, the drive is ideal for new and retrofit industrial applications in IEC markets, particularly those where space is limited. The drive can save money by allowing high-voltage feeds from the main distribution line to be connected directly without a step-down transformer or substation equipment.
9. What pricing options are available for accessing the report?
Pricing options include single-user, multi-user, and enterprise licenses priced at USD 4750, USD 4950, and USD 6800 respectively.
10. Is the market size provided in terms of value or volume?
The market size is provided in terms of value, measured in Million.
11. Are there any specific market keywords associated with the report?
Yes, the market keyword associated with the report is "NA Safety Drives and Motors Market," which aids in identifying and referencing the specific market segment covered.
12. How do I determine which pricing option suits my needs best?
The pricing options vary based on user requirements and access needs. Individual users may opt for single-user licenses, while businesses requiring broader access may choose multi-user or enterprise licenses for cost-effective access to the report.
13. Are there any additional resources or data provided in the NA Safety Drives and Motors Market report?
While the report offers comprehensive insights, it's advisable to review the specific contents or supplementary materials provided to ascertain if additional resources or data are available.
14. How can I stay updated on further developments or reports in the NA Safety Drives and Motors Market?
To stay informed about further developments, trends, and reports in the NA Safety Drives and Motors Market, consider subscribing to industry newsletters, following relevant companies and organizations, or regularly checking reputable industry news sources and publications.
Methodology
Step 1 - Identification of Relevant Samples Size from Population Database


Step 2 - Approaches for Defining Global Market Size (Value, Volume* & Price*)

Note*: In applicable scenarios
Step 3 - Data Sources
Primary Research
- Web Analytics
- Survey Reports
- Research Institute
- Latest Research Reports
- Opinion Leaders
Secondary Research
- Annual Reports
- White Paper
- Latest Press Release
- Industry Association
- Paid Database
- Investor Presentations

Step 4 - Data Triangulation
Involves using different sources of information in order to increase the validity of a study
These sources are likely to be stakeholders in a program - participants, other researchers, program staff, other community members, and so on.
Then we put all data in single framework & apply various statistical tools to find out the dynamic on the market.
During the analysis stage, feedback from the stakeholder groups would be compared to determine areas of agreement as well as areas of divergence


