

Key Insights
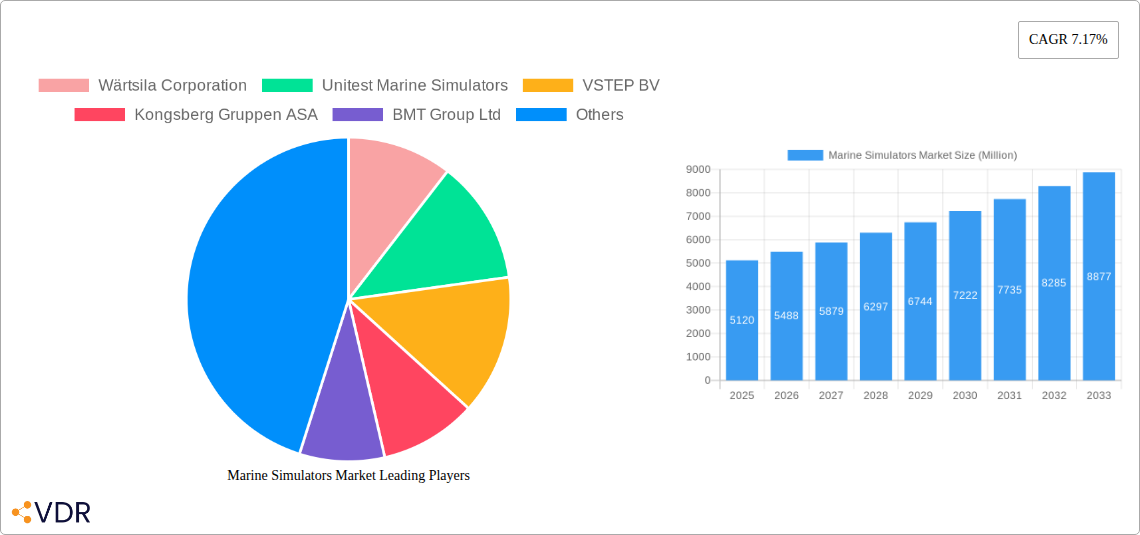
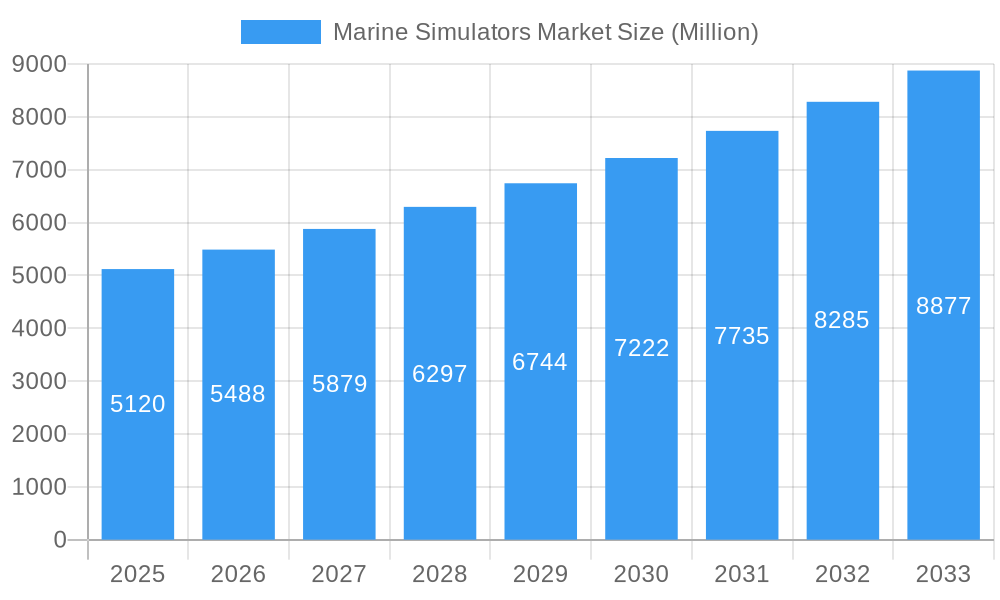
The global Marine Simulators Market is poised for robust expansion, projected to grow from an estimated $5.12 billion in 2025 to reach a significant valuation by 2033. This growth is underpinned by a Compound Annual Growth Rate (CAGR) of 7.17%, indicating a dynamic and expanding industry driven by the increasing demand for advanced training and operational efficiency in maritime sectors. Key market drivers include the escalating need for enhanced maritime safety, the growing complexity of naval operations, and the imperative to comply with stringent international regulations for crew competency. Furthermore, the rapid integration of digital technologies, such as virtual reality (VR) and augmented reality (AR), is revolutionizing simulator capabilities, offering more immersive and realistic training experiences that directly translate to improved performance and reduced risk in real-world scenarios. The commercial maritime sector, encompassing shipping and cargo logistics, represents a substantial portion of the market, driven by the continuous need to train a skilled workforce for efficient vessel operations and cargo management.
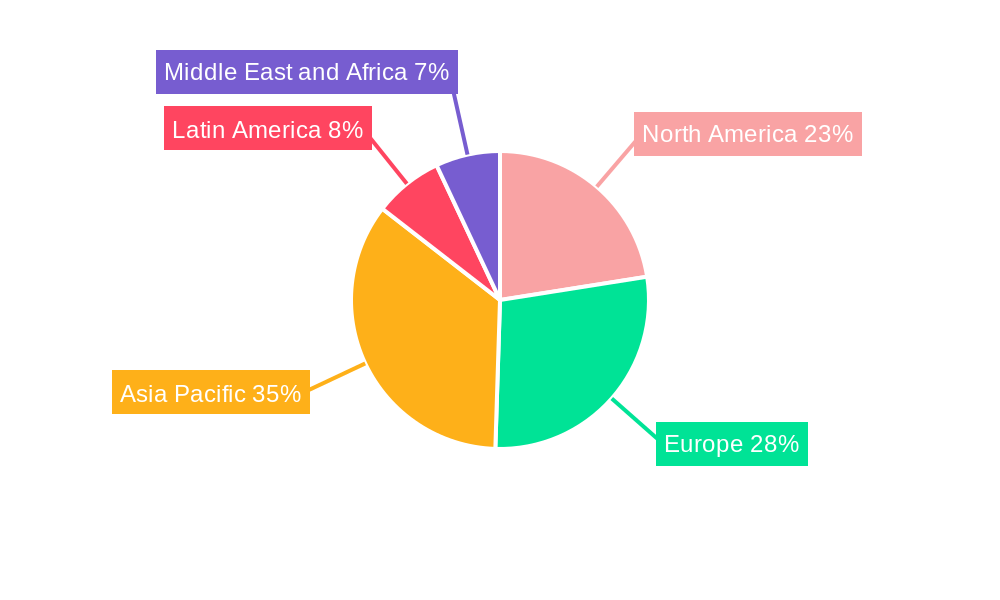
Marine Simulators Market Market Size (In Billion)
The market is segmented by simulator type, with Ship Bridge Simulators and Engine Room Simulators taking prominence due to their critical role in fundamental vessel operation training. Cargo Handling Simulators are also gaining traction as the complexity of cargo management and safety protocols increases. The application landscape is dominated by Training and Education, reflecting the core function of these simulators in developing competent maritime professionals. However, Fleet Operations and Port and Terminal Operations are emerging as significant growth areas, as organizations leverage simulation technology for optimizing logistics, enhancing emergency response preparedness, and improving overall operational efficiency. Geographically, the Asia Pacific region, particularly China and India, is expected to witness the highest growth rates due to rapid expansion in their maritime industries and increased investment in training infrastructure. North America and Europe remain mature but significant markets, driven by their established maritime traditions and strong emphasis on technological adoption for safety and efficiency. Restraints, such as the high initial investment costs and the need for continuous technological updates, are being effectively addressed by advancements in cloud-based solutions and the increasing cost-effectiveness of simulation technologies.
Marine Simulators Market Company Market Share
This in-depth market research report provides a comprehensive analysis of the global marine simulators market, offering detailed insights into market dynamics, growth trends, competitive landscape, and future outlook. Covering the historical period from 2019 to 2024, the base and estimated year of 2025, and a robust forecast period from 2025 to 2033, this report is an essential resource for industry stakeholders seeking to understand and capitalize on opportunities within this vital sector. We meticulously analyze the maritime simulation training market, ship simulation technology, naval simulation solutions, and offshore training simulators, integrating high-traffic keywords to maximize search engine visibility and engagement. The report delves into the parent market of maritime training solutions and its child markets, such as advanced navigation simulators and engine room operation trainers, providing a holistic view. All quantitative values are presented in Million units for clear comprehension.
Marine Simulators Market Market Dynamics & Structure
The global marine simulators market exhibits a moderately consolidated structure, characterized by a blend of established industry giants and emerging innovators. Technological innovation is a primary driver, fueled by the increasing demand for realistic training environments that enhance safety, efficiency, and compliance with stringent international maritime regulations. The continuous evolution of VR maritime simulators and AR in marine training technologies is pushing the boundaries of simulation fidelity. Regulatory frameworks, such as those set by the International Maritime Organization (IMO), mandate standardized training for seafarers, thereby bolstering the demand for sophisticated simulation solutions. Competitive product substitutes, primarily traditional classroom-based training and on-vessel apprenticeship, are gradually being displaced by the superior efficacy and cost-effectiveness of simulation. End-user demographics span both commercial shipping fleets and military naval operations, with a growing emphasis on sustainability and digitalization influencing purchasing decisions. Mergers and acquisitions (M&A) are a notable trend, as larger players aim to expand their product portfolios and geographical reach, as seen in recent strategic alliances and acquisitions aimed at integrating advanced AI-driven training modules.
- Market Concentration: Moderately consolidated, with key players holding significant market share.
- Technological Innovation Drivers: Advancements in AI, VR, AR, and haptic feedback systems; demand for realistic operational scenarios.
- Regulatory Frameworks: IMO regulations, STCW Convention, and national maritime authority mandates driving demand for certified training.
- Competitive Product Substitutes: Traditional training methods, on-the-job training.
- End-User Demographics: Commercial shipping companies, naval forces, port authorities, maritime academies.
- M&A Trends: Strategic acquisitions for technology integration and market expansion.
Marine Simulators Market Growth Trends & Insights
The global marine simulators market is poised for significant growth, driven by an escalating emphasis on maritime safety, operational efficiency, and the need for advanced crew competency development. The market size is projected to witness a robust expansion from an estimated value of XX million units in 2025 to over XXX million units by 2033, exhibiting a Compound Annual Growth Rate (CAGR) of approximately XX% during the forecast period. Adoption rates are accelerating as maritime organizations increasingly recognize the tangible benefits of simulation-based training, including reduced risk of accidents, optimized fuel consumption, and enhanced preparedness for diverse operational scenarios. Technological disruptions, particularly the integration of Artificial Intelligence (AI) for personalized learning paths and real-time performance feedback, are transforming the training landscape. Furthermore, the proliferation of digitalization within the maritime industry, including the concept of the "smart ship," necessitates simulation environments that mirror these advanced technologies. Consumer behavior shifts are evident, with a growing preference for interactive, immersive, and outcome-based training programs that can be delivered both remotely and in situ. The increasing complexity of modern vessels and their intricate systems further amplifies the need for specialized engine room simulators and cargo handling simulators that provide hands-on experience without real-world risks. The push for a skilled maritime workforce capable of navigating evolving operational challenges, including the integration of autonomous systems, is a key factor underpinning sustained market growth. The report identifies the increasing adoption of digital twin technology in marine simulation as a critical growth enabler, allowing for highly accurate replication of real-world vessel behavior and environmental conditions.
Dominant Regions, Countries, or Segments in Marine Simulators Market
The training and education segment, within the Application category, stands out as the dominant force driving growth in the global marine simulators market. This segment is propelled by the continuous need for certified seafarer training and the ongoing professional development of maritime personnel across all ranks. Maritime academies, training institutions, and shipping companies are consistently investing in advanced simulation solutions to meet stringent regulatory requirements and enhance the competency of their workforce.
- Dominant Segment (Application): Training and Education: This segment is experiencing unparalleled demand due to:
- Regulatory Mandates: International Maritime Organization (IMO) and STCW convention requirements necessitate comprehensive simulator training for various competencies.
- Safety Imperative: A constant focus on reducing maritime accidents drives investment in realistic risk-free training environments.
- Workforce Development: The need to equip seafarers with skills for increasingly complex vessels and evolving operational technologies.
- Cost-Effectiveness: Simulation offers a more economical and efficient alternative to traditional at-sea training for certain skills.
Among the types of simulators, Ship Bridge Simulators are leading the market, followed closely by Engine Room Simulators. Ship bridge simulators are crucial for training in navigation, collision avoidance, ship handling, and emergency procedures, areas critical for safe maritime operations. The increasing complexity of modern bridge systems and the growing emphasis on situational awareness further boost their demand.
- Leading Type: Ship Bridge Simulators: Key drivers include:
- Navigation Safety: Essential for training in complex navigation, traffic management, and adverse weather conditions.
- Advanced Technology Integration: Simulators are increasingly incorporating ECDIS, radar, AIS, and GMDSS to reflect real-world bridge environments.
- Fleet Operations Efficiency: Training on optimal route planning and fuel-efficient navigation techniques.
In terms of End Use, the Commercial sector is the largest contributor to market revenue, driven by the vast global shipping industry. However, the Military segment is also a significant and growing contributor, with navies worldwide investing heavily in advanced simulation capabilities for training in tactical operations, fleet coordination, and combat readiness.
- Dominant End Use: Commercial: This sector's dominance is attributed to:
- Global Trade Volume: The sheer scale of commercial shipping operations worldwide.
- Fleet Modernization: Continuous investment in new vessels requiring skilled crews.
- Operational Efficiency Goals: Focus on optimizing routes, fuel consumption, and cargo handling.
Geographically, Asia-Pacific is emerging as a dominant region, driven by the presence of major shipbuilding nations, a rapidly expanding commercial fleet, and significant investments in maritime education and training infrastructure. North America and Europe remain strong markets due to their established maritime industries and advanced technological adoption.
Marine Simulators Market Product Landscape
The marine simulators market is characterized by a dynamic product landscape driven by continuous innovation in simulation technology. Key product innovations include the widespread integration of Virtual Reality (VR) and Augmented Reality (AR) to create highly immersive and interactive training experiences, significantly enhancing user engagement and knowledge retention. Advanced visualization techniques, realistic hydrodynamic modeling, and dynamic environmental simulation contribute to the fidelity of platforms like ship bridge simulators and engine room simulators. Performance metrics are increasingly focused on training effectiveness, measured by improvements in user response times, error reduction, and compliance with operational procedures. Unique selling propositions often revolve around customizable training scenarios, multi-user networked capabilities for collaborative training, and the ability to simulate a wide range of vessel types and operational conditions, from routine navigation to complex emergency response. The development of AI-powered adaptive learning modules further distinguishes leading products, offering personalized training pathways tailored to individual learner needs and performance.
Key Drivers, Barriers & Challenges in Marine Simulators Market
The marine simulators market is propelled by several key drivers, including the unrelenting demand for enhanced maritime safety and operational efficiency. The stringent regulatory environment, mandating certified training for seafarers, acts as a significant growth catalyst. Technological advancements, particularly in VR, AR, and AI, are enabling the creation of more realistic and effective training solutions. The increasing complexity of modern vessels and the need to train crews on new technologies and environmental regulations further boost market expansion.
Key barriers and challenges include the high initial cost of sophisticated simulation systems, which can be a hurdle for smaller organizations. The need for continuous software updates and maintenance also adds to operational expenses. Supply chain disruptions for specialized hardware components can impact delivery timelines and costs. Furthermore, the inertia of adopting new technologies and the resistance to change from traditional training methods can pose challenges. Competitive pressures among simulator manufacturers also lead to price sensitivity in certain market segments.
Emerging Opportunities in Marine Simulators Market
Emerging opportunities in the marine simulators market are abundant, driven by advancements in technology and evolving industry needs. The integration of digital twins for highly accurate, real-time vessel performance simulation presents a significant avenue for growth, enabling predictive maintenance and optimized operational strategies. The increasing focus on autonomous shipping and unmanned vessel operations is creating a demand for specialized simulators to train operators and maintenance personnel for these future technologies. Furthermore, the growing emphasis on environmental sustainability is driving the development of simulators that can train crews on energy-efficient navigation techniques and the operation of greener propulsion systems. The expansion of simulator training into offshore renewable energy sectors, such as wind farm operations and maintenance, represents a nascent but promising market.
Growth Accelerators in the Marine Simulators Market Industry
Several catalysts are accelerating growth in the marine simulators market industry. The ongoing digital transformation within the maritime sector, encompassing the adoption of IoT, AI, and big data analytics, necessitates simulation environments that mirror these advancements. Strategic partnerships between simulator manufacturers and maritime training institutions are crucial for developing tailored solutions and expanding market reach. The continuous push for enhanced crew competency and safety standards, driven by both regulatory bodies and industry best practices, provides a consistent demand for advanced training tools. Furthermore, the increasing global trade volume and the expansion of commercial fleets, particularly in emerging economies, are creating a substantial base for simulator adoption. Investments in research and development are leading to more sophisticated and cost-effective simulation technologies, further fueling market expansion.
Key Players Shaping the Marine Simulators Market Market
- Wärtsilä Corporation
- Unitest Marine Simulators
- VSTEP BV
- Kongsberg Gruppen ASA
- BMT Group Ltd
- Virtual Marine Inc
- FORCE Technology
- NAUDEQ
- Altair Engineering Inc
- Global Dynamic Systems
- Pivot Maritime International
Notable Milestones in Marine Simulators Market Sector
- January 2024: FORCE Technology was chosen to implement its SimFlex4 AR solution in a comprehensive upgrade for Smartship Australia, a Queensland maritime simulation and training facility.
- May 2023: The MoD awarded BMT a hydrodynamic marine simulator training contract to provide safety, operational efficiency, readiness, and an advanced 5-bridge training platform capability in customized navigation training for the Admiralty Pilots and Tug Masters of the Queen Elizabeth-class aircraft carriers.
In-Depth Marine Simulators Market Market Outlook
The future outlook for the marine simulators market is exceptionally bright, propelled by sustained investments in safety, efficiency, and technological innovation. The continued evolution of maritime training technologies, including the increasing integration of AI for personalized learning and advanced sensor data simulation, will redefine crew competency development. Strategic collaborations between simulator developers, shipyards, and maritime operators are expected to foster the creation of integrated training ecosystems that align with the digital transformation of the shipping industry. The growing demand for simulation solutions in emerging maritime sectors, such as offshore wind farm operations and the nascent autonomous shipping market, presents significant untapped potential. As the industry navigates towards a more sustainable and digitally-driven future, advanced marine simulators will remain indispensable tools for ensuring a competent, safe, and efficient global maritime workforce.
Marine Simulators Market Segmentation
-
1. Type
- 1.1. Ship Bridge Simulators
- 1.2. Engine Room Simulators
- 1.3. Cargo Handling Simulators
- 1.4. Communic
- 1.5. Other Types
-
2. Application
- 2.1. Training and Education
- 2.2. Fleet Operations
- 2.3. Port and Terminal Operations
-
3. End Use
- 3.1. Commercial
- 3.2. Military
Marine Simulators Market Segmentation By Geography
-
1. North America
- 1.1. United States
- 1.2. Canada
-
2. Europe
- 2.1. Germany
- 2.2. United Kingdom
- 2.3. Russia
- 2.4. France
- 2.5. Rest of Europe
-
3. Asia Pacific
- 3.1. India
- 3.2. China
- 3.3. Japan
- 3.4. South Korea
- 3.5. Rest of Asia Pacific
-
4. Latin America
- 4.1. Brazil
- 4.2. Rest of Latin America
-
5. Middle East and Africa
- 5.1. United Arab Emirates
- 5.2. Saudi Arabia
- 5.3. Israel
- 5.4. Rest of Middle East and Africa
Marine Simulators Market Regional Market Share
Geographic Coverage of Marine Simulators Market
Marine Simulators Market REPORT HIGHLIGHTS
| Aspects | Details |
|---|---|
| Study Period | 2020-2034 |
| Base Year | 2025 |
| Estimated Year | 2026 |
| Forecast Period | 2026-2034 |
| Historical Period | 2020-2025 |
| Growth Rate | CAGR of 7.17% from 2020-2034 |
| Segmentation |
|
Table of Contents
- 1. Introduction
- 1.1. Research Scope
- 1.2. Market Segmentation
- 1.3. Research Objective
- 1.4. Definitions and Assumptions
- 2. Executive Summary
- 2.1. Market Snapshot
- 3. Market Dynamics
- 3.1. Market Drivers
- 3.2. Market Restrains
- 3.3. Market Trends
- 3.4. Market Opportunities
- 4. Market Factor Analysis
- 4.1. Porters Five Forces
- 4.1.1. Bargaining Power of Suppliers
- 4.1.2. Bargaining Power of Buyers
- 4.1.3. Threat of New Entrants
- 4.1.4. Threat of Substitutes
- 4.1.5. Competitive Rivalry
- 4.2. PESTEL analysis
- 4.3. BCG Analysis
- 4.3.1. Stars (High Growth, High Market Share)
- 4.3.2. Cash Cows (Low Growth, High Market Share)
- 4.3.3. Question Mark (High Growth, Low Market Share)
- 4.3.4. Dogs (Low Growth, Low Market Share)
- 4.4. Ansoff Matrix Analysis
- 4.5. Supply Chain Analysis
- 4.6. Regulatory Landscape
- 4.7. Current Market Potential and Opportunity Assessment (TAM–SAM–SOM Framework)
- 4.8. VDR Analyst Note
- 4.1. Porters Five Forces
- 5. Market Analysis, Insights and Forecast 2021-2033
- 5.1. Market Analysis, Insights and Forecast - by Type
- 5.1.1. Ship Bridge Simulators
- 5.1.2. Engine Room Simulators
- 5.1.3. Cargo Handling Simulators
- 5.1.4. Communic
- 5.1.5. Other Types
- 5.2. Market Analysis, Insights and Forecast - by Application
- 5.2.1. Training and Education
- 5.2.2. Fleet Operations
- 5.2.3. Port and Terminal Operations
- 5.3. Market Analysis, Insights and Forecast - by End Use
- 5.3.1. Commercial
- 5.3.2. Military
- 5.4. Market Analysis, Insights and Forecast - by Region
- 5.4.1. North America
- 5.4.2. Europe
- 5.4.3. Asia Pacific
- 5.4.4. Latin America
- 5.4.5. Middle East and Africa
- 5.1. Market Analysis, Insights and Forecast - by Type
- 6. Global Marine Simulators Market Analysis, Insights and Forecast, 2021-2033
- 6.1. Market Analysis, Insights and Forecast - by Type
- 6.1.1. Ship Bridge Simulators
- 6.1.2. Engine Room Simulators
- 6.1.3. Cargo Handling Simulators
- 6.1.4. Communic
- 6.1.5. Other Types
- 6.2. Market Analysis, Insights and Forecast - by Application
- 6.2.1. Training and Education
- 6.2.2. Fleet Operations
- 6.2.3. Port and Terminal Operations
- 6.3. Market Analysis, Insights and Forecast - by End Use
- 6.3.1. Commercial
- 6.3.2. Military
- 6.1. Market Analysis, Insights and Forecast - by Type
- 7. North America Marine Simulators Market Analysis, Insights and Forecast, 2021-2033
- 7.1. Market Analysis, Insights and Forecast - by Type
- 7.1.1. Ship Bridge Simulators
- 7.1.2. Engine Room Simulators
- 7.1.3. Cargo Handling Simulators
- 7.1.4. Communic
- 7.1.5. Other Types
- 7.2. Market Analysis, Insights and Forecast - by Application
- 7.2.1. Training and Education
- 7.2.2. Fleet Operations
- 7.2.3. Port and Terminal Operations
- 7.3. Market Analysis, Insights and Forecast - by End Use
- 7.3.1. Commercial
- 7.3.2. Military
- 7.1. Market Analysis, Insights and Forecast - by Type
- 8. Europe Marine Simulators Market Analysis, Insights and Forecast, 2021-2033
- 8.1. Market Analysis, Insights and Forecast - by Type
- 8.1.1. Ship Bridge Simulators
- 8.1.2. Engine Room Simulators
- 8.1.3. Cargo Handling Simulators
- 8.1.4. Communic
- 8.1.5. Other Types
- 8.2. Market Analysis, Insights and Forecast - by Application
- 8.2.1. Training and Education
- 8.2.2. Fleet Operations
- 8.2.3. Port and Terminal Operations
- 8.3. Market Analysis, Insights and Forecast - by End Use
- 8.3.1. Commercial
- 8.3.2. Military
- 8.1. Market Analysis, Insights and Forecast - by Type
- 9. Asia Pacific Marine Simulators Market Analysis, Insights and Forecast, 2021-2033
- 9.1. Market Analysis, Insights and Forecast - by Type
- 9.1.1. Ship Bridge Simulators
- 9.1.2. Engine Room Simulators
- 9.1.3. Cargo Handling Simulators
- 9.1.4. Communic
- 9.1.5. Other Types
- 9.2. Market Analysis, Insights and Forecast - by Application
- 9.2.1. Training and Education
- 9.2.2. Fleet Operations
- 9.2.3. Port and Terminal Operations
- 9.3. Market Analysis, Insights and Forecast - by End Use
- 9.3.1. Commercial
- 9.3.2. Military
- 9.1. Market Analysis, Insights and Forecast - by Type
- 10. Latin America Marine Simulators Market Analysis, Insights and Forecast, 2021-2033
- 10.1. Market Analysis, Insights and Forecast - by Type
- 10.1.1. Ship Bridge Simulators
- 10.1.2. Engine Room Simulators
- 10.1.3. Cargo Handling Simulators
- 10.1.4. Communic
- 10.1.5. Other Types
- 10.2. Market Analysis, Insights and Forecast - by Application
- 10.2.1. Training and Education
- 10.2.2. Fleet Operations
- 10.2.3. Port and Terminal Operations
- 10.3. Market Analysis, Insights and Forecast - by End Use
- 10.3.1. Commercial
- 10.3.2. Military
- 10.1. Market Analysis, Insights and Forecast - by Type
- 11. Middle East and Africa Marine Simulators Market Analysis, Insights and Forecast, 2021-2033
- 11.1. Market Analysis, Insights and Forecast - by Type
- 11.1.1. Ship Bridge Simulators
- 11.1.2. Engine Room Simulators
- 11.1.3. Cargo Handling Simulators
- 11.1.4. Communic
- 11.1.5. Other Types
- 11.2. Market Analysis, Insights and Forecast - by Application
- 11.2.1. Training and Education
- 11.2.2. Fleet Operations
- 11.2.3. Port and Terminal Operations
- 11.3. Market Analysis, Insights and Forecast - by End Use
- 11.3.1. Commercial
- 11.3.2. Military
- 11.1. Market Analysis, Insights and Forecast - by Type
- 12. Competitive Analysis
- 12.1. Company Profiles
- 12.1.1 Wärtsila Corporation
- 12.1.1.1. Company Overview
- 12.1.1.2. Products
- 12.1.1.3. Company Financials
- 12.1.1.4. SWOT Analysis
- 12.1.2 Unitest Marine Simulators
- 12.1.2.1. Company Overview
- 12.1.2.2. Products
- 12.1.2.3. Company Financials
- 12.1.2.4. SWOT Analysis
- 12.1.3 VSTEP BV
- 12.1.3.1. Company Overview
- 12.1.3.2. Products
- 12.1.3.3. Company Financials
- 12.1.3.4. SWOT Analysis
- 12.1.4 Kongsberg Gruppen ASA
- 12.1.4.1. Company Overview
- 12.1.4.2. Products
- 12.1.4.3. Company Financials
- 12.1.4.4. SWOT Analysis
- 12.1.5 BMT Group Ltd
- 12.1.5.1. Company Overview
- 12.1.5.2. Products
- 12.1.5.3. Company Financials
- 12.1.5.4. SWOT Analysis
- 12.1.6 Virtual Marine Inc
- 12.1.6.1. Company Overview
- 12.1.6.2. Products
- 12.1.6.3. Company Financials
- 12.1.6.4. SWOT Analysis
- 12.1.7 FORCE Technology
- 12.1.7.1. Company Overview
- 12.1.7.2. Products
- 12.1.7.3. Company Financials
- 12.1.7.4. SWOT Analysis
- 12.1.8 NAUDEQ
- 12.1.8.1. Company Overview
- 12.1.8.2. Products
- 12.1.8.3. Company Financials
- 12.1.8.4. SWOT Analysis
- 12.1.9 Altair Engineering Inc
- 12.1.9.1. Company Overview
- 12.1.9.2. Products
- 12.1.9.3. Company Financials
- 12.1.9.4. SWOT Analysis
- 12.1.10 Global Dynamic Systems
- 12.1.10.1. Company Overview
- 12.1.10.2. Products
- 12.1.10.3. Company Financials
- 12.1.10.4. SWOT Analysis
- 12.1.11 Pivot Maritime Internationa
- 12.1.11.1. Company Overview
- 12.1.11.2. Products
- 12.1.11.3. Company Financials
- 12.1.11.4. SWOT Analysis
- 12.1.1 Wärtsila Corporation
- 12.2. Market Entropy
- 12.2.1 Company's Key Areas Served
- 12.2.2 Recent Developments
- 12.3. Company Market Share Analysis 2025
- 12.3.1 Top 5 Companies Market Share Analysis
- 12.3.2 Top 3 Companies Market Share Analysis
- 12.4. List of Potential Customers
- 13. Research Methodology
List of Figures
- Figure 1: Global Marine Simulators Market Revenue Breakdown (Million, %) by Region 2025 & 2033
- Figure 2: Global Marine Simulators Market Volume Breakdown (Billion, %) by Region 2025 & 2033
- Figure 3: North America Marine Simulators Market Revenue (Million), by Type 2025 & 2033
- Figure 4: North America Marine Simulators Market Volume (Billion), by Type 2025 & 2033
- Figure 5: North America Marine Simulators Market Revenue Share (%), by Type 2025 & 2033
- Figure 6: North America Marine Simulators Market Volume Share (%), by Type 2025 & 2033
- Figure 7: North America Marine Simulators Market Revenue (Million), by Application 2025 & 2033
- Figure 8: North America Marine Simulators Market Volume (Billion), by Application 2025 & 2033
- Figure 9: North America Marine Simulators Market Revenue Share (%), by Application 2025 & 2033
- Figure 10: North America Marine Simulators Market Volume Share (%), by Application 2025 & 2033
- Figure 11: North America Marine Simulators Market Revenue (Million), by End Use 2025 & 2033
- Figure 12: North America Marine Simulators Market Volume (Billion), by End Use 2025 & 2033
- Figure 13: North America Marine Simulators Market Revenue Share (%), by End Use 2025 & 2033
- Figure 14: North America Marine Simulators Market Volume Share (%), by End Use 2025 & 2033
- Figure 15: North America Marine Simulators Market Revenue (Million), by Country 2025 & 2033
- Figure 16: North America Marine Simulators Market Volume (Billion), by Country 2025 & 2033
- Figure 17: North America Marine Simulators Market Revenue Share (%), by Country 2025 & 2033
- Figure 18: North America Marine Simulators Market Volume Share (%), by Country 2025 & 2033
- Figure 19: Europe Marine Simulators Market Revenue (Million), by Type 2025 & 2033
- Figure 20: Europe Marine Simulators Market Volume (Billion), by Type 2025 & 2033
- Figure 21: Europe Marine Simulators Market Revenue Share (%), by Type 2025 & 2033
- Figure 22: Europe Marine Simulators Market Volume Share (%), by Type 2025 & 2033
- Figure 23: Europe Marine Simulators Market Revenue (Million), by Application 2025 & 2033
- Figure 24: Europe Marine Simulators Market Volume (Billion), by Application 2025 & 2033
- Figure 25: Europe Marine Simulators Market Revenue Share (%), by Application 2025 & 2033
- Figure 26: Europe Marine Simulators Market Volume Share (%), by Application 2025 & 2033
- Figure 27: Europe Marine Simulators Market Revenue (Million), by End Use 2025 & 2033
- Figure 28: Europe Marine Simulators Market Volume (Billion), by End Use 2025 & 2033
- Figure 29: Europe Marine Simulators Market Revenue Share (%), by End Use 2025 & 2033
- Figure 30: Europe Marine Simulators Market Volume Share (%), by End Use 2025 & 2033
- Figure 31: Europe Marine Simulators Market Revenue (Million), by Country 2025 & 2033
- Figure 32: Europe Marine Simulators Market Volume (Billion), by Country 2025 & 2033
- Figure 33: Europe Marine Simulators Market Revenue Share (%), by Country 2025 & 2033
- Figure 34: Europe Marine Simulators Market Volume Share (%), by Country 2025 & 2033
- Figure 35: Asia Pacific Marine Simulators Market Revenue (Million), by Type 2025 & 2033
- Figure 36: Asia Pacific Marine Simulators Market Volume (Billion), by Type 2025 & 2033
- Figure 37: Asia Pacific Marine Simulators Market Revenue Share (%), by Type 2025 & 2033
- Figure 38: Asia Pacific Marine Simulators Market Volume Share (%), by Type 2025 & 2033
- Figure 39: Asia Pacific Marine Simulators Market Revenue (Million), by Application 2025 & 2033
- Figure 40: Asia Pacific Marine Simulators Market Volume (Billion), by Application 2025 & 2033
- Figure 41: Asia Pacific Marine Simulators Market Revenue Share (%), by Application 2025 & 2033
- Figure 42: Asia Pacific Marine Simulators Market Volume Share (%), by Application 2025 & 2033
- Figure 43: Asia Pacific Marine Simulators Market Revenue (Million), by End Use 2025 & 2033
- Figure 44: Asia Pacific Marine Simulators Market Volume (Billion), by End Use 2025 & 2033
- Figure 45: Asia Pacific Marine Simulators Market Revenue Share (%), by End Use 2025 & 2033
- Figure 46: Asia Pacific Marine Simulators Market Volume Share (%), by End Use 2025 & 2033
- Figure 47: Asia Pacific Marine Simulators Market Revenue (Million), by Country 2025 & 2033
- Figure 48: Asia Pacific Marine Simulators Market Volume (Billion), by Country 2025 & 2033
- Figure 49: Asia Pacific Marine Simulators Market Revenue Share (%), by Country 2025 & 2033
- Figure 50: Asia Pacific Marine Simulators Market Volume Share (%), by Country 2025 & 2033
- Figure 51: Latin America Marine Simulators Market Revenue (Million), by Type 2025 & 2033
- Figure 52: Latin America Marine Simulators Market Volume (Billion), by Type 2025 & 2033
- Figure 53: Latin America Marine Simulators Market Revenue Share (%), by Type 2025 & 2033
- Figure 54: Latin America Marine Simulators Market Volume Share (%), by Type 2025 & 2033
- Figure 55: Latin America Marine Simulators Market Revenue (Million), by Application 2025 & 2033
- Figure 56: Latin America Marine Simulators Market Volume (Billion), by Application 2025 & 2033
- Figure 57: Latin America Marine Simulators Market Revenue Share (%), by Application 2025 & 2033
- Figure 58: Latin America Marine Simulators Market Volume Share (%), by Application 2025 & 2033
- Figure 59: Latin America Marine Simulators Market Revenue (Million), by End Use 2025 & 2033
- Figure 60: Latin America Marine Simulators Market Volume (Billion), by End Use 2025 & 2033
- Figure 61: Latin America Marine Simulators Market Revenue Share (%), by End Use 2025 & 2033
- Figure 62: Latin America Marine Simulators Market Volume Share (%), by End Use 2025 & 2033
- Figure 63: Latin America Marine Simulators Market Revenue (Million), by Country 2025 & 2033
- Figure 64: Latin America Marine Simulators Market Volume (Billion), by Country 2025 & 2033
- Figure 65: Latin America Marine Simulators Market Revenue Share (%), by Country 2025 & 2033
- Figure 66: Latin America Marine Simulators Market Volume Share (%), by Country 2025 & 2033
- Figure 67: Middle East and Africa Marine Simulators Market Revenue (Million), by Type 2025 & 2033
- Figure 68: Middle East and Africa Marine Simulators Market Volume (Billion), by Type 2025 & 2033
- Figure 69: Middle East and Africa Marine Simulators Market Revenue Share (%), by Type 2025 & 2033
- Figure 70: Middle East and Africa Marine Simulators Market Volume Share (%), by Type 2025 & 2033
- Figure 71: Middle East and Africa Marine Simulators Market Revenue (Million), by Application 2025 & 2033
- Figure 72: Middle East and Africa Marine Simulators Market Volume (Billion), by Application 2025 & 2033
- Figure 73: Middle East and Africa Marine Simulators Market Revenue Share (%), by Application 2025 & 2033
- Figure 74: Middle East and Africa Marine Simulators Market Volume Share (%), by Application 2025 & 2033
- Figure 75: Middle East and Africa Marine Simulators Market Revenue (Million), by End Use 2025 & 2033
- Figure 76: Middle East and Africa Marine Simulators Market Volume (Billion), by End Use 2025 & 2033
- Figure 77: Middle East and Africa Marine Simulators Market Revenue Share (%), by End Use 2025 & 2033
- Figure 78: Middle East and Africa Marine Simulators Market Volume Share (%), by End Use 2025 & 2033
- Figure 79: Middle East and Africa Marine Simulators Market Revenue (Million), by Country 2025 & 2033
- Figure 80: Middle East and Africa Marine Simulators Market Volume (Billion), by Country 2025 & 2033
- Figure 81: Middle East and Africa Marine Simulators Market Revenue Share (%), by Country 2025 & 2033
- Figure 82: Middle East and Africa Marine Simulators Market Volume Share (%), by Country 2025 & 2033
List of Tables
- Table 1: Global Marine Simulators Market Revenue Million Forecast, by Type 2020 & 2033
- Table 2: Global Marine Simulators Market Volume Billion Forecast, by Type 2020 & 2033
- Table 3: Global Marine Simulators Market Revenue Million Forecast, by Application 2020 & 2033
- Table 4: Global Marine Simulators Market Volume Billion Forecast, by Application 2020 & 2033
- Table 5: Global Marine Simulators Market Revenue Million Forecast, by End Use 2020 & 2033
- Table 6: Global Marine Simulators Market Volume Billion Forecast, by End Use 2020 & 2033
- Table 7: Global Marine Simulators Market Revenue Million Forecast, by Region 2020 & 2033
- Table 8: Global Marine Simulators Market Volume Billion Forecast, by Region 2020 & 2033
- Table 9: Global Marine Simulators Market Revenue Million Forecast, by Type 2020 & 2033
- Table 10: Global Marine Simulators Market Volume Billion Forecast, by Type 2020 & 2033
- Table 11: Global Marine Simulators Market Revenue Million Forecast, by Application 2020 & 2033
- Table 12: Global Marine Simulators Market Volume Billion Forecast, by Application 2020 & 2033
- Table 13: Global Marine Simulators Market Revenue Million Forecast, by End Use 2020 & 2033
- Table 14: Global Marine Simulators Market Volume Billion Forecast, by End Use 2020 & 2033
- Table 15: Global Marine Simulators Market Revenue Million Forecast, by Country 2020 & 2033
- Table 16: Global Marine Simulators Market Volume Billion Forecast, by Country 2020 & 2033
- Table 17: United States Marine Simulators Market Revenue (Million) Forecast, by Application 2020 & 2033
- Table 18: United States Marine Simulators Market Volume (Billion) Forecast, by Application 2020 & 2033
- Table 19: Canada Marine Simulators Market Revenue (Million) Forecast, by Application 2020 & 2033
- Table 20: Canada Marine Simulators Market Volume (Billion) Forecast, by Application 2020 & 2033
- Table 21: Global Marine Simulators Market Revenue Million Forecast, by Type 2020 & 2033
- Table 22: Global Marine Simulators Market Volume Billion Forecast, by Type 2020 & 2033
- Table 23: Global Marine Simulators Market Revenue Million Forecast, by Application 2020 & 2033
- Table 24: Global Marine Simulators Market Volume Billion Forecast, by Application 2020 & 2033
- Table 25: Global Marine Simulators Market Revenue Million Forecast, by End Use 2020 & 2033
- Table 26: Global Marine Simulators Market Volume Billion Forecast, by End Use 2020 & 2033
- Table 27: Global Marine Simulators Market Revenue Million Forecast, by Country 2020 & 2033
- Table 28: Global Marine Simulators Market Volume Billion Forecast, by Country 2020 & 2033
- Table 29: Germany Marine Simulators Market Revenue (Million) Forecast, by Application 2020 & 2033
- Table 30: Germany Marine Simulators Market Volume (Billion) Forecast, by Application 2020 & 2033
- Table 31: United Kingdom Marine Simulators Market Revenue (Million) Forecast, by Application 2020 & 2033
- Table 32: United Kingdom Marine Simulators Market Volume (Billion) Forecast, by Application 2020 & 2033
- Table 33: Russia Marine Simulators Market Revenue (Million) Forecast, by Application 2020 & 2033
- Table 34: Russia Marine Simulators Market Volume (Billion) Forecast, by Application 2020 & 2033
- Table 35: France Marine Simulators Market Revenue (Million) Forecast, by Application 2020 & 2033
- Table 36: France Marine Simulators Market Volume (Billion) Forecast, by Application 2020 & 2033
- Table 37: Rest of Europe Marine Simulators Market Revenue (Million) Forecast, by Application 2020 & 2033
- Table 38: Rest of Europe Marine Simulators Market Volume (Billion) Forecast, by Application 2020 & 2033
- Table 39: Global Marine Simulators Market Revenue Million Forecast, by Type 2020 & 2033
- Table 40: Global Marine Simulators Market Volume Billion Forecast, by Type 2020 & 2033
- Table 41: Global Marine Simulators Market Revenue Million Forecast, by Application 2020 & 2033
- Table 42: Global Marine Simulators Market Volume Billion Forecast, by Application 2020 & 2033
- Table 43: Global Marine Simulators Market Revenue Million Forecast, by End Use 2020 & 2033
- Table 44: Global Marine Simulators Market Volume Billion Forecast, by End Use 2020 & 2033
- Table 45: Global Marine Simulators Market Revenue Million Forecast, by Country 2020 & 2033
- Table 46: Global Marine Simulators Market Volume Billion Forecast, by Country 2020 & 2033
- Table 47: India Marine Simulators Market Revenue (Million) Forecast, by Application 2020 & 2033
- Table 48: India Marine Simulators Market Volume (Billion) Forecast, by Application 2020 & 2033
- Table 49: China Marine Simulators Market Revenue (Million) Forecast, by Application 2020 & 2033
- Table 50: China Marine Simulators Market Volume (Billion) Forecast, by Application 2020 & 2033
- Table 51: Japan Marine Simulators Market Revenue (Million) Forecast, by Application 2020 & 2033
- Table 52: Japan Marine Simulators Market Volume (Billion) Forecast, by Application 2020 & 2033
- Table 53: South Korea Marine Simulators Market Revenue (Million) Forecast, by Application 2020 & 2033
- Table 54: South Korea Marine Simulators Market Volume (Billion) Forecast, by Application 2020 & 2033
- Table 55: Rest of Asia Pacific Marine Simulators Market Revenue (Million) Forecast, by Application 2020 & 2033
- Table 56: Rest of Asia Pacific Marine Simulators Market Volume (Billion) Forecast, by Application 2020 & 2033
- Table 57: Global Marine Simulators Market Revenue Million Forecast, by Type 2020 & 2033
- Table 58: Global Marine Simulators Market Volume Billion Forecast, by Type 2020 & 2033
- Table 59: Global Marine Simulators Market Revenue Million Forecast, by Application 2020 & 2033
- Table 60: Global Marine Simulators Market Volume Billion Forecast, by Application 2020 & 2033
- Table 61: Global Marine Simulators Market Revenue Million Forecast, by End Use 2020 & 2033
- Table 62: Global Marine Simulators Market Volume Billion Forecast, by End Use 2020 & 2033
- Table 63: Global Marine Simulators Market Revenue Million Forecast, by Country 2020 & 2033
- Table 64: Global Marine Simulators Market Volume Billion Forecast, by Country 2020 & 2033
- Table 65: Brazil Marine Simulators Market Revenue (Million) Forecast, by Application 2020 & 2033
- Table 66: Brazil Marine Simulators Market Volume (Billion) Forecast, by Application 2020 & 2033
- Table 67: Rest of Latin America Marine Simulators Market Revenue (Million) Forecast, by Application 2020 & 2033
- Table 68: Rest of Latin America Marine Simulators Market Volume (Billion) Forecast, by Application 2020 & 2033
- Table 69: Global Marine Simulators Market Revenue Million Forecast, by Type 2020 & 2033
- Table 70: Global Marine Simulators Market Volume Billion Forecast, by Type 2020 & 2033
- Table 71: Global Marine Simulators Market Revenue Million Forecast, by Application 2020 & 2033
- Table 72: Global Marine Simulators Market Volume Billion Forecast, by Application 2020 & 2033
- Table 73: Global Marine Simulators Market Revenue Million Forecast, by End Use 2020 & 2033
- Table 74: Global Marine Simulators Market Volume Billion Forecast, by End Use 2020 & 2033
- Table 75: Global Marine Simulators Market Revenue Million Forecast, by Country 2020 & 2033
- Table 76: Global Marine Simulators Market Volume Billion Forecast, by Country 2020 & 2033
- Table 77: United Arab Emirates Marine Simulators Market Revenue (Million) Forecast, by Application 2020 & 2033
- Table 78: United Arab Emirates Marine Simulators Market Volume (Billion) Forecast, by Application 2020 & 2033
- Table 79: Saudi Arabia Marine Simulators Market Revenue (Million) Forecast, by Application 2020 & 2033
- Table 80: Saudi Arabia Marine Simulators Market Volume (Billion) Forecast, by Application 2020 & 2033
- Table 81: Israel Marine Simulators Market Revenue (Million) Forecast, by Application 2020 & 2033
- Table 82: Israel Marine Simulators Market Volume (Billion) Forecast, by Application 2020 & 2033
- Table 83: Rest of Middle East and Africa Marine Simulators Market Revenue (Million) Forecast, by Application 2020 & 2033
- Table 84: Rest of Middle East and Africa Marine Simulators Market Volume (Billion) Forecast, by Application 2020 & 2033
Frequently Asked Questions
1. What is the projected Compound Annual Growth Rate (CAGR) of the Marine Simulators Market?
The projected CAGR is approximately 7.17%.
2. Which companies are prominent players in the Marine Simulators Market?
Key companies in the market include Wärtsila Corporation, Unitest Marine Simulators, VSTEP BV, Kongsberg Gruppen ASA, BMT Group Ltd, Virtual Marine Inc, FORCE Technology, NAUDEQ, Altair Engineering Inc, Global Dynamic Systems, Pivot Maritime Internationa.
3. What are the main segments of the Marine Simulators Market?
The market segments include Type, Application, End Use.
4. Can you provide details about the market size?
The market size is estimated to be USD 5.12 Million as of 2022.
5. What are some drivers contributing to market growth?
N/A
6. What are the notable trends driving market growth?
The Military Segment is Expected to Showcase Significant Growth During the Forecast Period.
7. Are there any restraints impacting market growth?
N/A
8. Can you provide examples of recent developments in the market?
January 2024: FORCE Technology was chosen to implement its SimFlex4 AR solution in a comprehensive upgrade for Smartship Australia, a Queensland maritime simulation and training facility.
9. What pricing options are available for accessing the report?
Pricing options include single-user, multi-user, and enterprise licenses priced at USD 4750, USD 5250, and USD 8750 respectively.
10. Is the market size provided in terms of value or volume?
The market size is provided in terms of value, measured in Million and volume, measured in Billion.
11. Are there any specific market keywords associated with the report?
Yes, the market keyword associated with the report is "Marine Simulators Market," which aids in identifying and referencing the specific market segment covered.
12. How do I determine which pricing option suits my needs best?
The pricing options vary based on user requirements and access needs. Individual users may opt for single-user licenses, while businesses requiring broader access may choose multi-user or enterprise licenses for cost-effective access to the report.
13. Are there any additional resources or data provided in the Marine Simulators Market report?
While the report offers comprehensive insights, it's advisable to review the specific contents or supplementary materials provided to ascertain if additional resources or data are available.
14. How can I stay updated on further developments or reports in the Marine Simulators Market?
To stay informed about further developments, trends, and reports in the Marine Simulators Market, consider subscribing to industry newsletters, following relevant companies and organizations, or regularly checking reputable industry news sources and publications.
Methodology
Step 1 - Identification of Relevant Samples Size from Population Database


Step 2 - Approaches for Defining Global Market Size (Value, Volume* & Price*)

Note*: In applicable scenarios
Step 3 - Data Sources
Primary Research
- Web Analytics
- Survey Reports
- Research Institute
- Latest Research Reports
- Opinion Leaders
Secondary Research
- Annual Reports
- White Paper
- Latest Press Release
- Industry Association
- Paid Database
- Investor Presentations

Step 4 - Data Triangulation
Involves using different sources of information in order to increase the validity of a study
These sources are likely to be stakeholders in a program - participants, other researchers, program staff, other community members, and so on.
Then we put all data in single framework & apply various statistical tools to find out the dynamic on the market.
During the analysis stage, feedback from the stakeholder groups would be compared to determine areas of agreement as well as areas of divergence