

Key Insights
The global Naval Smart Weapons Market is projected to experience robust growth, reaching an estimated market size of $12.02 billion by 2025. This expansion is driven by increasing geopolitical complexities, heightened maritime security imperatives, and global naval modernization initiatives. Nations are prioritizing investments in advanced naval assets, with a focus on smart weapon systems offering superior precision, extended range, and enhanced target acquisition. Key growth catalysts include the integration of artificial intelligence, cutting-edge sensor technology, and networked warfare capabilities. Surging demand for advanced anti-ship missiles, smart torpedoes, and guided artillery reflects navies' efforts to maintain a technological advantage in contested maritime domains. Continuous research and development of next-generation, adaptable, and resilient smart weapon systems capable of operating in complex electromagnetic environments further support market expansion.
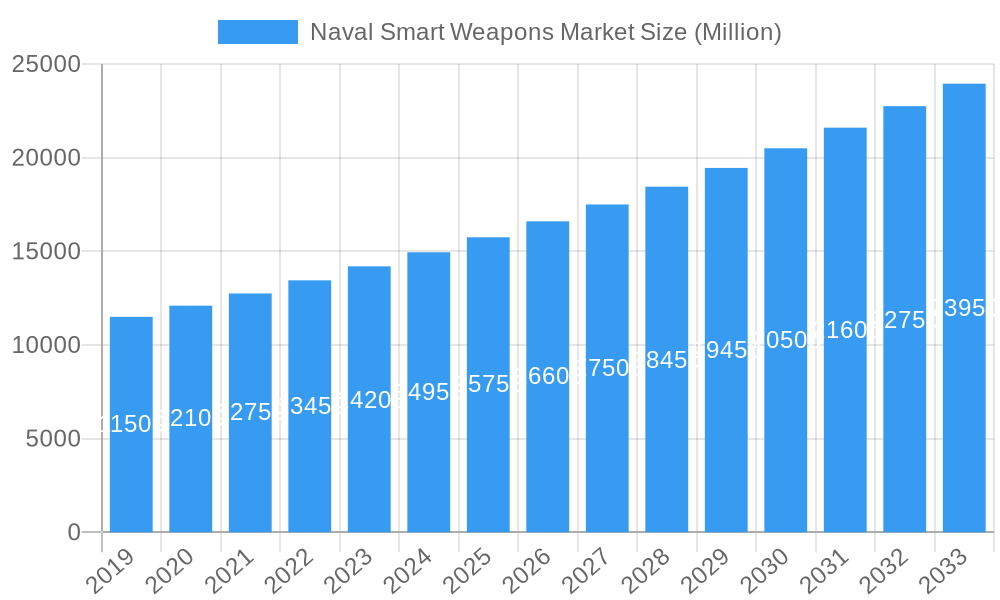
Naval Smart Weapons Market Market Size (In Billion)
Market dynamics are shaped by intense competition among leading defense manufacturers, emphasizing innovation and technological leadership. While the demand for advanced naval armaments is a significant growth driver, potential restraints include substantial R&D expenditures, prolonged procurement processes, and cybersecurity vulnerabilities. Global economic volatility and regional defense budget limitations may also influence investment. Nevertheless, the pervasive trend toward digitalization and automation in naval operations, coupled with an increased emphasis on precision strike capabilities, signals a positive trajectory for the Naval Smart Weapons Market. Significant growth is anticipated in advanced missile systems and guided munitions for anti-submarine warfare and fleet defense.
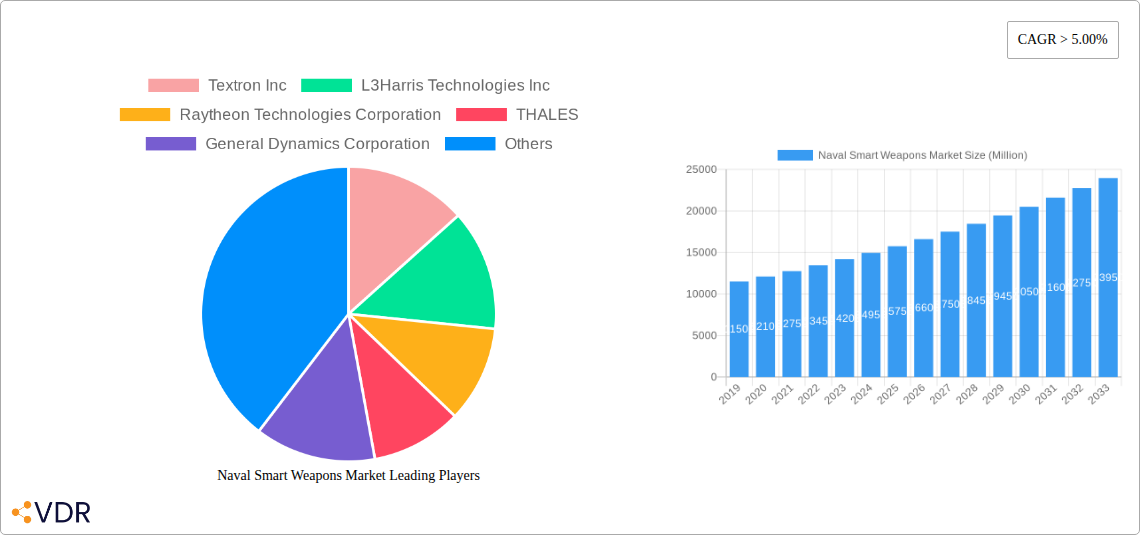
Naval Smart Weapons Market Company Market Share
The Naval Smart Weapons Market is anticipated to grow at a Compound Annual Growth Rate (CAGR) of 7.75% from the base year 2025.
Naval Smart Weapons Market Report: Comprehensive Analysis & Future Outlook (2019-2033)
This in-depth report offers a strategic analysis of the global Naval Smart Weapons Market, providing critical insights into its dynamics, growth trajectory, and competitive landscape. Covering a study period from 2019 to 2033, with a base year of 2025, this report details production and consumption analyses, import/export market evaluations (value and volume), and price trend assessments. It is an essential resource for defense contractors, naval strategists, policymakers, and investors seeking to understand the evolution of advanced naval armament.
Naval Smart Weapons Market Market Dynamics & Structure
The Naval Smart Weapons Market is characterized by a moderate to high level of market concentration, with a few dominant players like Raytheon Technologies Corporation, Lockheed Martin Corporation, and BAE Systems plc holding significant market shares. Technological innovation is the primary driver, fueled by increasing defense budgets and the escalating need for precision-guided munitions, anti-ship missiles, and advanced electronic warfare systems. Regulatory frameworks, particularly international arms control treaties and national defense procurement policies, play a crucial role in shaping market access and product development. Competitive product substitutes, such as advanced non-smart munitions and potential cyber warfare alternatives, are present but currently struggle to match the precision and effectiveness of smart naval weapons. End-user demographics are primarily national navies and coast guards, with a growing emphasis on modernizing fleets to counter emerging threats from peer competitors. Mergers and acquisitions (M&A) trends are moderately active, with larger defense conglomerates acquiring specialized technology firms to enhance their smart weapon portfolios.
- Market Concentration: Dominated by key global defense prime contractors.
- Technological Innovation Drivers: Precision, range, guidance systems, miniaturization, and integration with networked warfare capabilities.
- Regulatory Frameworks: Export control regulations, international treaties, and national defense strategies.
- Competitive Product Substitutes: Advanced conventional munitions, unmanned systems, and electronic countermeasures.
- End-User Demographics: National Navies, Coast Guards, and Maritime Security Agencies.
- M&A Trends: Strategic acquisitions to bolster smart weapon capabilities and market presence.
Naval Smart Weapons Market Growth Trends & Insights
The Naval Smart Weapons Market is poised for substantial growth, driven by the continuous need for enhanced maritime security and power projection capabilities. The market size is projected to expand significantly, reflecting increased investments in naval modernization programs across major economies. Adoption rates of advanced smart weapon systems, including precision-guided missiles, naval cruise missiles, and smart torpedoes, are steadily rising as navies prioritize operational effectiveness and reduced collateral damage. Technological disruptions, such as the integration of artificial intelligence (AI) for target acquisition and autonomous decision-making in weapon systems, are set to redefine the market landscape. Consumer behavior shifts are observed in the demand for networked, multi-domain capable smart weapons that can operate seamlessly within joint force operations. The CAGR for the forecast period is expected to be robust, indicating sustained growth and increasing market penetration of sophisticated naval smart weapon solutions.
The market's evolution is also shaped by the increasing integration of smart weapons with unmanned naval platforms, such as autonomous underwater vehicles (AUVs) and unmanned surface vessels (USVs). This symbiotic relationship enhances operational reach, reduces personnel risk, and allows for more persistent surveillance and strike capabilities. Furthermore, advancements in seeker technologies, including multi-mode seekers that combine radar, infrared, and electro-optical sensors, are significantly improving weapon accuracy and effectiveness against diverse targets in challenging environments. The development of hypersonic naval missiles, while still in its nascent stages for widespread naval deployment, represents a major disruptive technology that could fundamentally alter naval warfare paradigms and drive significant future market demand.
The growing geopolitical tensions and the rise of asymmetric warfare scenarios necessitate advanced naval capabilities, further propelling the demand for smart weapons. Nations are investing heavily in systems that offer standoff strike capabilities, allowing them to engage targets from safe distances while ensuring mission success. The increasing sophistication of adversarial naval and air defense systems also mandates the development of smarter, more agile, and harder-to-intercept munitions. This continuous arms race, albeit a somber reality, acts as a powerful catalyst for innovation and market expansion in the naval smart weapons sector. The trend towards modular and adaptable weapon systems that can be quickly reconfigured for different mission profiles is also gaining traction, offering greater flexibility and cost-effectiveness to naval forces.
Dominant Regions, Countries, or Segments in Naval Smart Weapons Market
North America, particularly the United States, stands as a dominant region in the Naval Smart Weapons Market, driven by its substantial defense spending, advanced technological capabilities, and continuous modernization of its naval fleet. The US Navy's vast inventory and ongoing procurement of next-generation smart weapons, including advanced anti-ship missiles and vertical launch system (VLS) compatible munitions, significantly contribute to this dominance. The country's robust industrial base, encompassing leading defense contractors like Lockheed Martin Corporation, Northrop Grumman Corporation, and Raytheon Technologies Corporation, ensures a consistent supply of cutting-edge smart weapon systems.
Production Analysis: North America leads production, with the United States accounting for a substantial portion. Europe, particularly countries like the UK, France, and Germany, also exhibits strong production capabilities in specific segments of naval smart weapons. Asia-Pacific is emerging as a significant production hub, with countries like China and Japan increasing their domestic manufacturing capacity.
Consumption Analysis: The consumption landscape mirrors production dominance, with North America and Europe being the largest consumers due to their established naval forces and ongoing upgrades. The Asia-Pacific region is experiencing the fastest growth in consumption, fueled by rapid naval expansion and modernization efforts in countries like China, India, and South Korea.
Import Market Analysis (Value & Volume): The import market is crucial for nations looking to acquire advanced capabilities that may not be available domestically. The United States, despite its strong domestic production, also imports specialized components and technologies. However, countries in the Asia-Pacific and Middle East are significant importers of naval smart weapons, seeking to bolster their defensive and offensive maritime capabilities. The value of imports is high due to the advanced nature and sophistication of these systems.
Export Market Analysis (Value & Volume): The United States is the largest exporter of naval smart weapons globally, followed by European nations. Key export markets include allied nations in the Middle East, Asia-Pacific, and NATO. The export market is heavily influenced by geopolitical alliances, strategic partnerships, and the perceived threat landscape in various regions.
Price Trend Analysis: The price trend for naval smart weapons is generally upward, driven by the increasing complexity of technology, R&D costs, and the specialized nature of these systems. Economies of scale can influence prices for high-volume production, but the overall trend reflects the high value and critical nature of these armaments.
Dominance Factors:
- Economic Policies: Robust defense budgets and government support for indigenous defense industries.
- Technological Prowess: Leading research and development in areas like guidance, propulsion, and warheads.
- Naval Modernization Programs: Continuous investment in upgrading and expanding naval fleets.
- Geopolitical Alliances: Strong partnerships facilitating technology transfer and joint procurement.
- Market Demand: Growing regional security concerns driving demand for advanced maritime strike capabilities.
Naval Smart Weapons Market Product Landscape
The product landscape of the Naval Smart Weapons Market is characterized by continuous innovation aimed at enhancing accuracy, range, lethality, and survivability. Key products include advanced anti-ship missiles with multi-mode seekers and low-observable characteristics, precision-guided naval artillery munitions, smart torpedoes with sophisticated acoustic homing and counter-countermeasure capabilities, and sophisticated naval cruise missiles for land-attack and anti-ship roles. Emerging product categories include directed energy weapons and hypersonic missiles, representing the next frontier in naval armament. Unique selling propositions revolve around superior target discrimination, networked warfare integration, reduced launch platform vulnerability, and the ability to defeat advanced countermeasures. Technological advancements are focused on AI-driven target recognition, improved electronic countermeasures resistance, and miniaturization for deployment on smaller unmanned platforms.
Key Drivers, Barriers & Challenges in Naval Smart Weapons Market
Key Drivers:
- Geopolitical Tensions and Regional Conflicts: Escalating global tensions necessitate enhanced naval power projection and defense capabilities.
- Naval Modernization Programs: Nations worldwide are investing heavily in upgrading their naval fleets, driving demand for advanced weaponry.
- Technological Advancements: Continuous innovation in guidance systems, seeker technologies, and warheads fuels the development of more effective smart weapons.
- Need for Precision Strike Capabilities: The demand for weapons that can accurately engage targets while minimizing collateral damage.
Barriers & Challenges:
- High Development and Production Costs: The advanced nature of smart weapons leads to significant R&D and manufacturing expenses.
- Strict Regulatory and Export Controls: International arms treaties and national policies can restrict the proliferation and adoption of certain weapon systems.
- Long Procurement Cycles: The defense procurement process is often lengthy and complex, leading to extended timelines for new systems.
- Supply Chain Vulnerabilities: Reliance on specialized components and global supply chains can be susceptible to disruptions.
- Emergence of Counter-Technologies: Adversaries developing advanced countermeasures and electronic warfare capabilities pose an ongoing challenge.
Emerging Opportunities in Naval Smart Weapons Market
Emerging opportunities in the Naval Smart Weapons Market lie in the development of highly autonomous and AI-integrated weapon systems capable of operating in contested environments. The increasing adoption of unmanned naval platforms presents a significant opportunity for smaller, more specialized smart weapons tailored for these systems, such as autonomous loitering munitions and swarming weapon concepts. Furthermore, the growing demand for cyber-resilient weapon systems that can operate effectively in sophisticated electronic warfare environments opens avenues for innovation. The development of modular and adaptable weapon systems that can be quickly reconfigured for various mission profiles, catering to diverse naval requirements, also represents a promising growth area. The exploration of directed energy weapons for naval applications, while still in its early stages, holds transformative potential.
Growth Accelerators in the Naval Smart Weapons Market Industry
Long-term growth in the Naval Smart Weapons Market will be significantly accelerated by sustained investments in research and development, particularly in areas like artificial intelligence, hypersonic technologies, and advanced materials. Strategic partnerships between defense prime contractors and smaller technology firms specializing in cutting-edge components will foster innovation and expedite product development. Market expansion strategies will likely focus on emerging naval powers in the Asia-Pacific and Middle East regions, where rapid naval modernization is a key priority. The increasing emphasis on networked warfare and the integration of smart weapons into a broader combat system ecosystem will also act as a major growth accelerator, driving demand for interoperable and adaptable solutions.
Key Players Shaping the Naval Smart Weapons Market Market
- Textron Inc
- L3Harris Technologies Inc
- Raytheon Technologies Corporation
- THALES
- General Dynamics Corporation
- Rheinmetall AG
- Lockheed Martin Corporation
- MBDA
- Leonardo S p A
- BAE Systems plc
- Northrop Grumman Corporation
- The Boeing Company
Notable Milestones in Naval Smart Weapons Market Sector
- February 2023: The US Navy placed an order worth USD 92 million for weapon assemblies for LAIRCM missile-defense systems with Northrop Grumman Corporation.
- November 2022: The German Navy has tested its first high-energy laser weapon, the frigate Sachsen against drones in the Baltic near Putlos military training area. The laser weapon demonstrator was developed by the High-Energy Laser Naval Demonstrator working committee.
In-Depth Naval Smart Weapons Market Market Outlook
The outlook for the Naval Smart Weapons Market remains exceptionally strong, driven by persistent global security challenges and an ongoing imperative for naval superiority. Growth accelerators, including continued investment in AI and hypersonic weapon development, alongside strategic alliances, will unlock new market potentials. The increasing demand from rapidly modernizing navies in emerging economies presents significant opportunities for market expansion. As nations prioritize advanced capabilities for maritime defense and power projection, the market for sophisticated and networked naval smart weapons is poised for sustained and robust growth throughout the forecast period.
Naval Smart Weapons Market Segmentation
- 1. Production Analysis
- 2. Consumption Analysis
- 3. Import Market Analysis (Value & Volume)
- 4. Export Market Analysis (Value & Volume)
- 5. Price Trend Analysis
Naval Smart Weapons Market Segmentation By Geography
-
1. North America
- 1.1. United States
- 1.2. Canada
- 1.3. Mexico
-
2. South America
- 2.1. Brazil
- 2.2. Argentina
- 2.3. Rest of South America
-
3. Europe
- 3.1. United Kingdom
- 3.2. Germany
- 3.3. France
- 3.4. Italy
- 3.5. Spain
- 3.6. Russia
- 3.7. Benelux
- 3.8. Nordics
- 3.9. Rest of Europe
-
4. Middle East & Africa
- 4.1. Turkey
- 4.2. Israel
- 4.3. GCC
- 4.4. North Africa
- 4.5. South Africa
- 4.6. Rest of Middle East & Africa
-
5. Asia Pacific
- 5.1. China
- 5.2. India
- 5.3. Japan
- 5.4. South Korea
- 5.5. ASEAN
- 5.6. Oceania
- 5.7. Rest of Asia Pacific
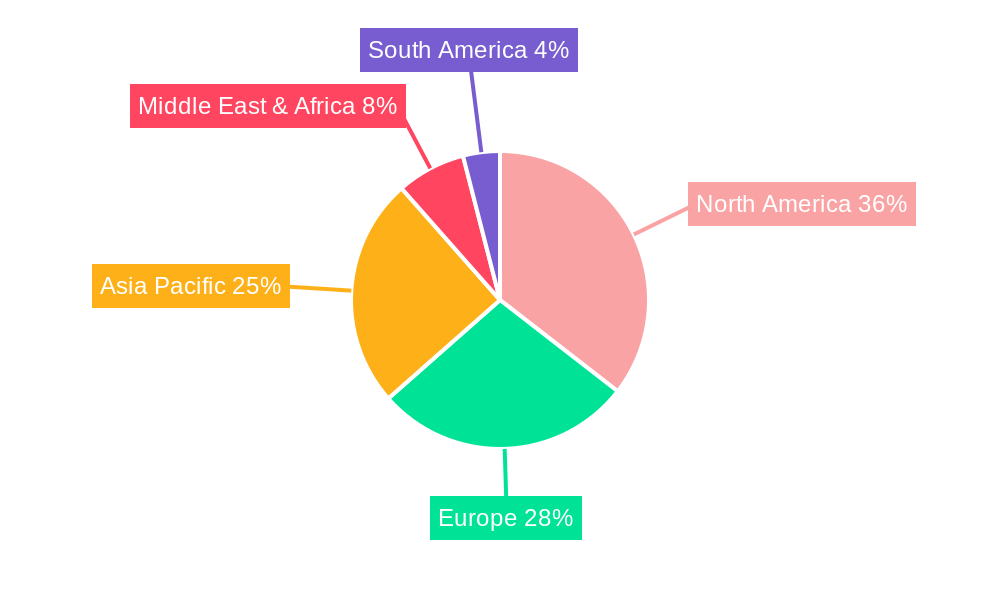
Naval Smart Weapons Market Regional Market Share
Geographic Coverage of Naval Smart Weapons Market
Naval Smart Weapons Market REPORT HIGHLIGHTS
| Aspects | Details |
|---|---|
| Study Period | 2020-2034 |
| Base Year | 2025 |
| Estimated Year | 2026 |
| Forecast Period | 2026-2034 |
| Historical Period | 2020-2025 |
| Growth Rate | CAGR of 7.75% from 2020-2034 |
| Segmentation |
|
Table of Contents
- 1. Introduction
- 1.1. Research Scope
- 1.2. Market Segmentation
- 1.3. Research Objective
- 1.4. Definitions and Assumptions
- 2. Executive Summary
- 2.1. Market Snapshot
- 3. Market Dynamics
- 3.1. Market Drivers
- 3.2. Market Restrains
- 3.3. Market Trends
- 3.4. Market Opportunities
- 4. Market Factor Analysis
- 4.1. Porters Five Forces
- 4.1.1. Bargaining Power of Suppliers
- 4.1.2. Bargaining Power of Buyers
- 4.1.3. Threat of New Entrants
- 4.1.4. Threat of Substitutes
- 4.1.5. Competitive Rivalry
- 4.2. PESTEL analysis
- 4.3. BCG Analysis
- 4.3.1. Stars (High Growth, High Market Share)
- 4.3.2. Cash Cows (Low Growth, High Market Share)
- 4.3.3. Question Mark (High Growth, Low Market Share)
- 4.3.4. Dogs (Low Growth, Low Market Share)
- 4.4. Ansoff Matrix Analysis
- 4.5. Supply Chain Analysis
- 4.6. Regulatory Landscape
- 4.7. Current Market Potential and Opportunity Assessment (TAM–SAM–SOM Framework)
- 4.8. VDR Analyst Note
- 4.1. Porters Five Forces
- 5. Market Analysis, Insights and Forecast 2021-2033
- 5.1. Market Analysis, Insights and Forecast - by Production Analysis
- 5.2. Market Analysis, Insights and Forecast - by Consumption Analysis
- 5.3. Market Analysis, Insights and Forecast - by Import Market Analysis (Value & Volume)
- 5.4. Market Analysis, Insights and Forecast - by Export Market Analysis (Value & Volume)
- 5.5. Market Analysis, Insights and Forecast - by Price Trend Analysis
- 5.6. Market Analysis, Insights and Forecast - by Region
- 5.6.1. North America
- 5.6.2. South America
- 5.6.3. Europe
- 5.6.4. Middle East & Africa
- 5.6.5. Asia Pacific
- 6. Global Naval Smart Weapons Market Analysis, Insights and Forecast, 2021-2033
- 6.1. Market Analysis, Insights and Forecast - by Production Analysis
- 6.2. Market Analysis, Insights and Forecast - by Consumption Analysis
- 6.3. Market Analysis, Insights and Forecast - by Import Market Analysis (Value & Volume)
- 6.4. Market Analysis, Insights and Forecast - by Export Market Analysis (Value & Volume)
- 6.5. Market Analysis, Insights and Forecast - by Price Trend Analysis
- 7. North America Naval Smart Weapons Market Analysis, Insights and Forecast, 2021-2033
- 7.1. Market Analysis, Insights and Forecast - by Production Analysis
- 7.2. Market Analysis, Insights and Forecast - by Consumption Analysis
- 7.3. Market Analysis, Insights and Forecast - by Import Market Analysis (Value & Volume)
- 7.4. Market Analysis, Insights and Forecast - by Export Market Analysis (Value & Volume)
- 7.5. Market Analysis, Insights and Forecast - by Price Trend Analysis
- 8. South America Naval Smart Weapons Market Analysis, Insights and Forecast, 2021-2033
- 8.1. Market Analysis, Insights and Forecast - by Production Analysis
- 8.2. Market Analysis, Insights and Forecast - by Consumption Analysis
- 8.3. Market Analysis, Insights and Forecast - by Import Market Analysis (Value & Volume)
- 8.4. Market Analysis, Insights and Forecast - by Export Market Analysis (Value & Volume)
- 8.5. Market Analysis, Insights and Forecast - by Price Trend Analysis
- 9. Europe Naval Smart Weapons Market Analysis, Insights and Forecast, 2021-2033
- 9.1. Market Analysis, Insights and Forecast - by Production Analysis
- 9.2. Market Analysis, Insights and Forecast - by Consumption Analysis
- 9.3. Market Analysis, Insights and Forecast - by Import Market Analysis (Value & Volume)
- 9.4. Market Analysis, Insights and Forecast - by Export Market Analysis (Value & Volume)
- 9.5. Market Analysis, Insights and Forecast - by Price Trend Analysis
- 10. Middle East & Africa Naval Smart Weapons Market Analysis, Insights and Forecast, 2021-2033
- 10.1. Market Analysis, Insights and Forecast - by Production Analysis
- 10.2. Market Analysis, Insights and Forecast - by Consumption Analysis
- 10.3. Market Analysis, Insights and Forecast - by Import Market Analysis (Value & Volume)
- 10.4. Market Analysis, Insights and Forecast - by Export Market Analysis (Value & Volume)
- 10.5. Market Analysis, Insights and Forecast - by Price Trend Analysis
- 11. Asia Pacific Naval Smart Weapons Market Analysis, Insights and Forecast, 2021-2033
- 11.1. Market Analysis, Insights and Forecast - by Production Analysis
- 11.2. Market Analysis, Insights and Forecast - by Consumption Analysis
- 11.3. Market Analysis, Insights and Forecast - by Import Market Analysis (Value & Volume)
- 11.4. Market Analysis, Insights and Forecast - by Export Market Analysis (Value & Volume)
- 11.5. Market Analysis, Insights and Forecast - by Price Trend Analysis
- 12. Competitive Analysis
- 12.1. Company Profiles
- 12.1.1 Textron Inc
- 12.1.1.1. Company Overview
- 12.1.1.2. Products
- 12.1.1.3. Company Financials
- 12.1.1.4. SWOT Analysis
- 12.1.2 L3Harris Technologies Inc
- 12.1.2.1. Company Overview
- 12.1.2.2. Products
- 12.1.2.3. Company Financials
- 12.1.2.4. SWOT Analysis
- 12.1.3 Raytheon Technologies Corporation
- 12.1.3.1. Company Overview
- 12.1.3.2. Products
- 12.1.3.3. Company Financials
- 12.1.3.4. SWOT Analysis
- 12.1.4 THALES
- 12.1.4.1. Company Overview
- 12.1.4.2. Products
- 12.1.4.3. Company Financials
- 12.1.4.4. SWOT Analysis
- 12.1.5 General Dynamics Corporation
- 12.1.5.1. Company Overview
- 12.1.5.2. Products
- 12.1.5.3. Company Financials
- 12.1.5.4. SWOT Analysis
- 12.1.6 Rheinmetall AG
- 12.1.6.1. Company Overview
- 12.1.6.2. Products
- 12.1.6.3. Company Financials
- 12.1.6.4. SWOT Analysis
- 12.1.7 Lockheed Martin Corporation
- 12.1.7.1. Company Overview
- 12.1.7.2. Products
- 12.1.7.3. Company Financials
- 12.1.7.4. SWOT Analysis
- 12.1.8 MBDA
- 12.1.8.1. Company Overview
- 12.1.8.2. Products
- 12.1.8.3. Company Financials
- 12.1.8.4. SWOT Analysis
- 12.1.9 Leonardo S p A
- 12.1.9.1. Company Overview
- 12.1.9.2. Products
- 12.1.9.3. Company Financials
- 12.1.9.4. SWOT Analysis
- 12.1.10 BAE Systems plc
- 12.1.10.1. Company Overview
- 12.1.10.2. Products
- 12.1.10.3. Company Financials
- 12.1.10.4. SWOT Analysis
- 12.1.11 Northrop Grumman Corporation
- 12.1.11.1. Company Overview
- 12.1.11.2. Products
- 12.1.11.3. Company Financials
- 12.1.11.4. SWOT Analysis
- 12.1.12 The Boeing Company
- 12.1.12.1. Company Overview
- 12.1.12.2. Products
- 12.1.12.3. Company Financials
- 12.1.12.4. SWOT Analysis
- 12.1.1 Textron Inc
- 12.2. Market Entropy
- 12.2.1 Company's Key Areas Served
- 12.2.2 Recent Developments
- 12.3. Company Market Share Analysis 2025
- 12.3.1 Top 5 Companies Market Share Analysis
- 12.3.2 Top 3 Companies Market Share Analysis
- 12.4. List of Potential Customers
- 13. Research Methodology
List of Figures
- Figure 1: Global Naval Smart Weapons Market Revenue Breakdown (billion, %) by Region 2025 & 2033
- Figure 2: North America Naval Smart Weapons Market Revenue (billion), by Production Analysis 2025 & 2033
- Figure 3: North America Naval Smart Weapons Market Revenue Share (%), by Production Analysis 2025 & 2033
- Figure 4: North America Naval Smart Weapons Market Revenue (billion), by Consumption Analysis 2025 & 2033
- Figure 5: North America Naval Smart Weapons Market Revenue Share (%), by Consumption Analysis 2025 & 2033
- Figure 6: North America Naval Smart Weapons Market Revenue (billion), by Import Market Analysis (Value & Volume) 2025 & 2033
- Figure 7: North America Naval Smart Weapons Market Revenue Share (%), by Import Market Analysis (Value & Volume) 2025 & 2033
- Figure 8: North America Naval Smart Weapons Market Revenue (billion), by Export Market Analysis (Value & Volume) 2025 & 2033
- Figure 9: North America Naval Smart Weapons Market Revenue Share (%), by Export Market Analysis (Value & Volume) 2025 & 2033
- Figure 10: North America Naval Smart Weapons Market Revenue (billion), by Price Trend Analysis 2025 & 2033
- Figure 11: North America Naval Smart Weapons Market Revenue Share (%), by Price Trend Analysis 2025 & 2033
- Figure 12: North America Naval Smart Weapons Market Revenue (billion), by Country 2025 & 2033
- Figure 13: North America Naval Smart Weapons Market Revenue Share (%), by Country 2025 & 2033
- Figure 14: South America Naval Smart Weapons Market Revenue (billion), by Production Analysis 2025 & 2033
- Figure 15: South America Naval Smart Weapons Market Revenue Share (%), by Production Analysis 2025 & 2033
- Figure 16: South America Naval Smart Weapons Market Revenue (billion), by Consumption Analysis 2025 & 2033
- Figure 17: South America Naval Smart Weapons Market Revenue Share (%), by Consumption Analysis 2025 & 2033
- Figure 18: South America Naval Smart Weapons Market Revenue (billion), by Import Market Analysis (Value & Volume) 2025 & 2033
- Figure 19: South America Naval Smart Weapons Market Revenue Share (%), by Import Market Analysis (Value & Volume) 2025 & 2033
- Figure 20: South America Naval Smart Weapons Market Revenue (billion), by Export Market Analysis (Value & Volume) 2025 & 2033
- Figure 21: South America Naval Smart Weapons Market Revenue Share (%), by Export Market Analysis (Value & Volume) 2025 & 2033
- Figure 22: South America Naval Smart Weapons Market Revenue (billion), by Price Trend Analysis 2025 & 2033
- Figure 23: South America Naval Smart Weapons Market Revenue Share (%), by Price Trend Analysis 2025 & 2033
- Figure 24: South America Naval Smart Weapons Market Revenue (billion), by Country 2025 & 2033
- Figure 25: South America Naval Smart Weapons Market Revenue Share (%), by Country 2025 & 2033
- Figure 26: Europe Naval Smart Weapons Market Revenue (billion), by Production Analysis 2025 & 2033
- Figure 27: Europe Naval Smart Weapons Market Revenue Share (%), by Production Analysis 2025 & 2033
- Figure 28: Europe Naval Smart Weapons Market Revenue (billion), by Consumption Analysis 2025 & 2033
- Figure 29: Europe Naval Smart Weapons Market Revenue Share (%), by Consumption Analysis 2025 & 2033
- Figure 30: Europe Naval Smart Weapons Market Revenue (billion), by Import Market Analysis (Value & Volume) 2025 & 2033
- Figure 31: Europe Naval Smart Weapons Market Revenue Share (%), by Import Market Analysis (Value & Volume) 2025 & 2033
- Figure 32: Europe Naval Smart Weapons Market Revenue (billion), by Export Market Analysis (Value & Volume) 2025 & 2033
- Figure 33: Europe Naval Smart Weapons Market Revenue Share (%), by Export Market Analysis (Value & Volume) 2025 & 2033
- Figure 34: Europe Naval Smart Weapons Market Revenue (billion), by Price Trend Analysis 2025 & 2033
- Figure 35: Europe Naval Smart Weapons Market Revenue Share (%), by Price Trend Analysis 2025 & 2033
- Figure 36: Europe Naval Smart Weapons Market Revenue (billion), by Country 2025 & 2033
- Figure 37: Europe Naval Smart Weapons Market Revenue Share (%), by Country 2025 & 2033
- Figure 38: Middle East & Africa Naval Smart Weapons Market Revenue (billion), by Production Analysis 2025 & 2033
- Figure 39: Middle East & Africa Naval Smart Weapons Market Revenue Share (%), by Production Analysis 2025 & 2033
- Figure 40: Middle East & Africa Naval Smart Weapons Market Revenue (billion), by Consumption Analysis 2025 & 2033
- Figure 41: Middle East & Africa Naval Smart Weapons Market Revenue Share (%), by Consumption Analysis 2025 & 2033
- Figure 42: Middle East & Africa Naval Smart Weapons Market Revenue (billion), by Import Market Analysis (Value & Volume) 2025 & 2033
- Figure 43: Middle East & Africa Naval Smart Weapons Market Revenue Share (%), by Import Market Analysis (Value & Volume) 2025 & 2033
- Figure 44: Middle East & Africa Naval Smart Weapons Market Revenue (billion), by Export Market Analysis (Value & Volume) 2025 & 2033
- Figure 45: Middle East & Africa Naval Smart Weapons Market Revenue Share (%), by Export Market Analysis (Value & Volume) 2025 & 2033
- Figure 46: Middle East & Africa Naval Smart Weapons Market Revenue (billion), by Price Trend Analysis 2025 & 2033
- Figure 47: Middle East & Africa Naval Smart Weapons Market Revenue Share (%), by Price Trend Analysis 2025 & 2033
- Figure 48: Middle East & Africa Naval Smart Weapons Market Revenue (billion), by Country 2025 & 2033
- Figure 49: Middle East & Africa Naval Smart Weapons Market Revenue Share (%), by Country 2025 & 2033
- Figure 50: Asia Pacific Naval Smart Weapons Market Revenue (billion), by Production Analysis 2025 & 2033
- Figure 51: Asia Pacific Naval Smart Weapons Market Revenue Share (%), by Production Analysis 2025 & 2033
- Figure 52: Asia Pacific Naval Smart Weapons Market Revenue (billion), by Consumption Analysis 2025 & 2033
- Figure 53: Asia Pacific Naval Smart Weapons Market Revenue Share (%), by Consumption Analysis 2025 & 2033
- Figure 54: Asia Pacific Naval Smart Weapons Market Revenue (billion), by Import Market Analysis (Value & Volume) 2025 & 2033
- Figure 55: Asia Pacific Naval Smart Weapons Market Revenue Share (%), by Import Market Analysis (Value & Volume) 2025 & 2033
- Figure 56: Asia Pacific Naval Smart Weapons Market Revenue (billion), by Export Market Analysis (Value & Volume) 2025 & 2033
- Figure 57: Asia Pacific Naval Smart Weapons Market Revenue Share (%), by Export Market Analysis (Value & Volume) 2025 & 2033
- Figure 58: Asia Pacific Naval Smart Weapons Market Revenue (billion), by Price Trend Analysis 2025 & 2033
- Figure 59: Asia Pacific Naval Smart Weapons Market Revenue Share (%), by Price Trend Analysis 2025 & 2033
- Figure 60: Asia Pacific Naval Smart Weapons Market Revenue (billion), by Country 2025 & 2033
- Figure 61: Asia Pacific Naval Smart Weapons Market Revenue Share (%), by Country 2025 & 2033
List of Tables
- Table 1: Global Naval Smart Weapons Market Revenue billion Forecast, by Production Analysis 2020 & 2033
- Table 2: Global Naval Smart Weapons Market Revenue billion Forecast, by Consumption Analysis 2020 & 2033
- Table 3: Global Naval Smart Weapons Market Revenue billion Forecast, by Import Market Analysis (Value & Volume) 2020 & 2033
- Table 4: Global Naval Smart Weapons Market Revenue billion Forecast, by Export Market Analysis (Value & Volume) 2020 & 2033
- Table 5: Global Naval Smart Weapons Market Revenue billion Forecast, by Price Trend Analysis 2020 & 2033
- Table 6: Global Naval Smart Weapons Market Revenue billion Forecast, by Region 2020 & 2033
- Table 7: Global Naval Smart Weapons Market Revenue billion Forecast, by Production Analysis 2020 & 2033
- Table 8: Global Naval Smart Weapons Market Revenue billion Forecast, by Consumption Analysis 2020 & 2033
- Table 9: Global Naval Smart Weapons Market Revenue billion Forecast, by Import Market Analysis (Value & Volume) 2020 & 2033
- Table 10: Global Naval Smart Weapons Market Revenue billion Forecast, by Export Market Analysis (Value & Volume) 2020 & 2033
- Table 11: Global Naval Smart Weapons Market Revenue billion Forecast, by Price Trend Analysis 2020 & 2033
- Table 12: Global Naval Smart Weapons Market Revenue billion Forecast, by Country 2020 & 2033
- Table 13: United States Naval Smart Weapons Market Revenue (billion) Forecast, by Application 2020 & 2033
- Table 14: Canada Naval Smart Weapons Market Revenue (billion) Forecast, by Application 2020 & 2033
- Table 15: Mexico Naval Smart Weapons Market Revenue (billion) Forecast, by Application 2020 & 2033
- Table 16: Global Naval Smart Weapons Market Revenue billion Forecast, by Production Analysis 2020 & 2033
- Table 17: Global Naval Smart Weapons Market Revenue billion Forecast, by Consumption Analysis 2020 & 2033
- Table 18: Global Naval Smart Weapons Market Revenue billion Forecast, by Import Market Analysis (Value & Volume) 2020 & 2033
- Table 19: Global Naval Smart Weapons Market Revenue billion Forecast, by Export Market Analysis (Value & Volume) 2020 & 2033
- Table 20: Global Naval Smart Weapons Market Revenue billion Forecast, by Price Trend Analysis 2020 & 2033
- Table 21: Global Naval Smart Weapons Market Revenue billion Forecast, by Country 2020 & 2033
- Table 22: Brazil Naval Smart Weapons Market Revenue (billion) Forecast, by Application 2020 & 2033
- Table 23: Argentina Naval Smart Weapons Market Revenue (billion) Forecast, by Application 2020 & 2033
- Table 24: Rest of South America Naval Smart Weapons Market Revenue (billion) Forecast, by Application 2020 & 2033
- Table 25: Global Naval Smart Weapons Market Revenue billion Forecast, by Production Analysis 2020 & 2033
- Table 26: Global Naval Smart Weapons Market Revenue billion Forecast, by Consumption Analysis 2020 & 2033
- Table 27: Global Naval Smart Weapons Market Revenue billion Forecast, by Import Market Analysis (Value & Volume) 2020 & 2033
- Table 28: Global Naval Smart Weapons Market Revenue billion Forecast, by Export Market Analysis (Value & Volume) 2020 & 2033
- Table 29: Global Naval Smart Weapons Market Revenue billion Forecast, by Price Trend Analysis 2020 & 2033
- Table 30: Global Naval Smart Weapons Market Revenue billion Forecast, by Country 2020 & 2033
- Table 31: United Kingdom Naval Smart Weapons Market Revenue (billion) Forecast, by Application 2020 & 2033
- Table 32: Germany Naval Smart Weapons Market Revenue (billion) Forecast, by Application 2020 & 2033
- Table 33: France Naval Smart Weapons Market Revenue (billion) Forecast, by Application 2020 & 2033
- Table 34: Italy Naval Smart Weapons Market Revenue (billion) Forecast, by Application 2020 & 2033
- Table 35: Spain Naval Smart Weapons Market Revenue (billion) Forecast, by Application 2020 & 2033
- Table 36: Russia Naval Smart Weapons Market Revenue (billion) Forecast, by Application 2020 & 2033
- Table 37: Benelux Naval Smart Weapons Market Revenue (billion) Forecast, by Application 2020 & 2033
- Table 38: Nordics Naval Smart Weapons Market Revenue (billion) Forecast, by Application 2020 & 2033
- Table 39: Rest of Europe Naval Smart Weapons Market Revenue (billion) Forecast, by Application 2020 & 2033
- Table 40: Global Naval Smart Weapons Market Revenue billion Forecast, by Production Analysis 2020 & 2033
- Table 41: Global Naval Smart Weapons Market Revenue billion Forecast, by Consumption Analysis 2020 & 2033
- Table 42: Global Naval Smart Weapons Market Revenue billion Forecast, by Import Market Analysis (Value & Volume) 2020 & 2033
- Table 43: Global Naval Smart Weapons Market Revenue billion Forecast, by Export Market Analysis (Value & Volume) 2020 & 2033
- Table 44: Global Naval Smart Weapons Market Revenue billion Forecast, by Price Trend Analysis 2020 & 2033
- Table 45: Global Naval Smart Weapons Market Revenue billion Forecast, by Country 2020 & 2033
- Table 46: Turkey Naval Smart Weapons Market Revenue (billion) Forecast, by Application 2020 & 2033
- Table 47: Israel Naval Smart Weapons Market Revenue (billion) Forecast, by Application 2020 & 2033
- Table 48: GCC Naval Smart Weapons Market Revenue (billion) Forecast, by Application 2020 & 2033
- Table 49: North Africa Naval Smart Weapons Market Revenue (billion) Forecast, by Application 2020 & 2033
- Table 50: South Africa Naval Smart Weapons Market Revenue (billion) Forecast, by Application 2020 & 2033
- Table 51: Rest of Middle East & Africa Naval Smart Weapons Market Revenue (billion) Forecast, by Application 2020 & 2033
- Table 52: Global Naval Smart Weapons Market Revenue billion Forecast, by Production Analysis 2020 & 2033
- Table 53: Global Naval Smart Weapons Market Revenue billion Forecast, by Consumption Analysis 2020 & 2033
- Table 54: Global Naval Smart Weapons Market Revenue billion Forecast, by Import Market Analysis (Value & Volume) 2020 & 2033
- Table 55: Global Naval Smart Weapons Market Revenue billion Forecast, by Export Market Analysis (Value & Volume) 2020 & 2033
- Table 56: Global Naval Smart Weapons Market Revenue billion Forecast, by Price Trend Analysis 2020 & 2033
- Table 57: Global Naval Smart Weapons Market Revenue billion Forecast, by Country 2020 & 2033
- Table 58: China Naval Smart Weapons Market Revenue (billion) Forecast, by Application 2020 & 2033
- Table 59: India Naval Smart Weapons Market Revenue (billion) Forecast, by Application 2020 & 2033
- Table 60: Japan Naval Smart Weapons Market Revenue (billion) Forecast, by Application 2020 & 2033
- Table 61: South Korea Naval Smart Weapons Market Revenue (billion) Forecast, by Application 2020 & 2033
- Table 62: ASEAN Naval Smart Weapons Market Revenue (billion) Forecast, by Application 2020 & 2033
- Table 63: Oceania Naval Smart Weapons Market Revenue (billion) Forecast, by Application 2020 & 2033
- Table 64: Rest of Asia Pacific Naval Smart Weapons Market Revenue (billion) Forecast, by Application 2020 & 2033
Frequently Asked Questions
1. What is the projected Compound Annual Growth Rate (CAGR) of the Naval Smart Weapons Market?
The projected CAGR is approximately 7.75%.
2. Which companies are prominent players in the Naval Smart Weapons Market?
Key companies in the market include Textron Inc, L3Harris Technologies Inc, Raytheon Technologies Corporation, THALES, General Dynamics Corporation, Rheinmetall AG, Lockheed Martin Corporation, MBDA, Leonardo S p A, BAE Systems plc, Northrop Grumman Corporation, The Boeing Company.
3. What are the main segments of the Naval Smart Weapons Market?
The market segments include Production Analysis, Consumption Analysis, Import Market Analysis (Value & Volume), Export Market Analysis (Value & Volume), Price Trend Analysis.
4. Can you provide details about the market size?
The market size is estimated to be USD 12.02 billion as of 2022.
5. What are some drivers contributing to market growth?
Increase in Internet of Things (IoT) and Autonomous Systems; Rise in Demand for Military and Defense Satellite Communication Solutions.
6. What are the notable trends driving market growth?
Laser Guidance Segment Holds the Highest Share in the Market.
7. Are there any restraints impacting market growth?
Cybersecurity Threats to Satellite Communication; Interference in Transmission of Data.
8. Can you provide examples of recent developments in the market?
In February 2023, the US Navy placed an order worth USD 92 million for weapon assemblies for LAIRCM missile-defense systems with Northrop Grumman Corporation.
9. What pricing options are available for accessing the report?
Pricing options include single-user, multi-user, and enterprise licenses priced at USD 4750, USD 5250, and USD 8750 respectively.
10. Is the market size provided in terms of value or volume?
The market size is provided in terms of value, measured in billion.
11. Are there any specific market keywords associated with the report?
Yes, the market keyword associated with the report is "Naval Smart Weapons Market," which aids in identifying and referencing the specific market segment covered.
12. How do I determine which pricing option suits my needs best?
The pricing options vary based on user requirements and access needs. Individual users may opt for single-user licenses, while businesses requiring broader access may choose multi-user or enterprise licenses for cost-effective access to the report.
13. Are there any additional resources or data provided in the Naval Smart Weapons Market report?
While the report offers comprehensive insights, it's advisable to review the specific contents or supplementary materials provided to ascertain if additional resources or data are available.
14. How can I stay updated on further developments or reports in the Naval Smart Weapons Market?
To stay informed about further developments, trends, and reports in the Naval Smart Weapons Market, consider subscribing to industry newsletters, following relevant companies and organizations, or regularly checking reputable industry news sources and publications.
Methodology
Step 1 - Identification of Relevant Samples Size from Population Database


Step 2 - Approaches for Defining Global Market Size (Value, Volume* & Price*)

Note*: In applicable scenarios
Step 3 - Data Sources
Primary Research
- Web Analytics
- Survey Reports
- Research Institute
- Latest Research Reports
- Opinion Leaders
Secondary Research
- Annual Reports
- White Paper
- Latest Press Release
- Industry Association
- Paid Database
- Investor Presentations

Step 4 - Data Triangulation
Involves using different sources of information in order to increase the validity of a study
These sources are likely to be stakeholders in a program - participants, other researchers, program staff, other community members, and so on.
Then we put all data in single framework & apply various statistical tools to find out the dynamic on the market.
During the analysis stage, feedback from the stakeholder groups would be compared to determine areas of agreement as well as areas of divergence