

Key Insights
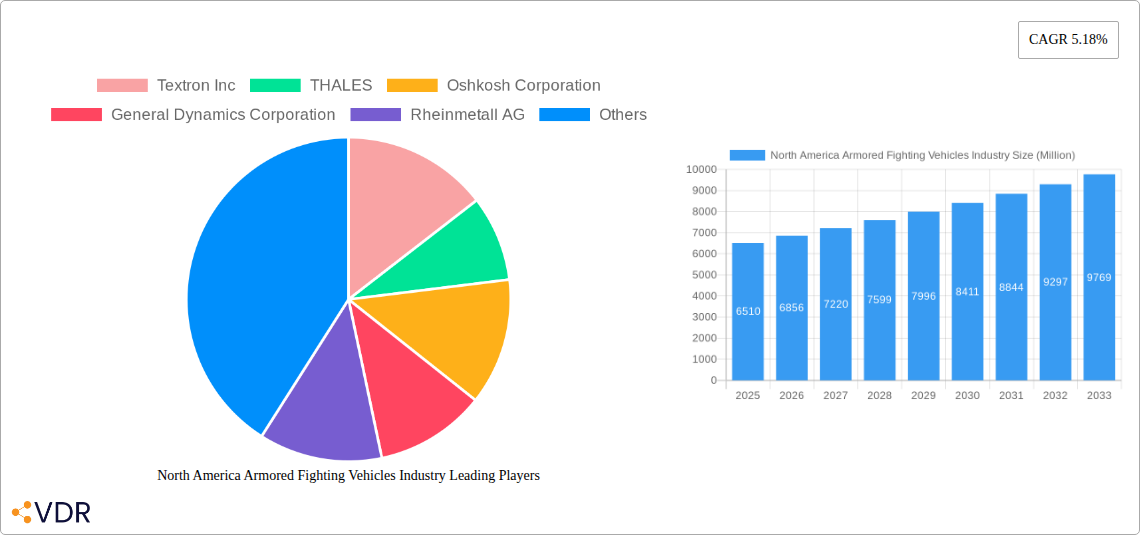
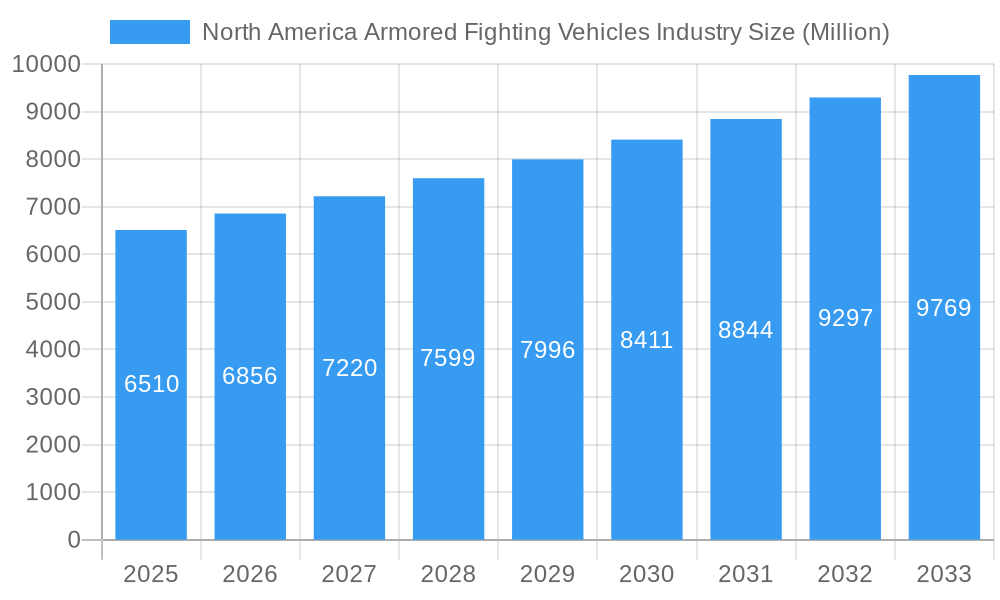
The North American armored fighting vehicles (AFV) market, valued at $6.51 billion in 2025, is projected to experience robust growth, driven by increasing defense budgets, modernization initiatives, and geopolitical instability. The market's Compound Annual Growth Rate (CAGR) of 5.18% from 2025 to 2033 indicates a steady expansion, fueled by the ongoing demand for advanced military equipment and technological upgrades within the region. Key market segments include Armored Personnel Carriers (APCs), Infantry Fighting Vehicles (IFVs), and Main Battle Tanks (MBTs), each contributing significantly to the overall market value. The United States, as the largest military spender in North America, dominates the market, followed by Canada and Mexico. However, increased investments in defense capabilities by Mexico, driven by regional security concerns, are expected to contribute to growth within the region. Leading companies such as Textron, Thales, Oshkosh, General Dynamics, and BAE Systems are actively engaged in developing and supplying cutting-edge AFVs to meet the evolving demands of North American armed forces.
North America Armored Fighting Vehicles Industry Market Size (In Billion)
Technological advancements, particularly in areas such as improved armor protection, enhanced situational awareness systems, and advanced weaponry integration, are pivotal trends shaping the market. The integration of unmanned systems and autonomous technologies into AFVs is gaining traction, promising enhanced battlefield effectiveness and reduced risks to soldiers. However, market growth might face some restraints, including fluctuating defense budgets, competition from international manufacturers, and the high costs associated with research and development of new AFV technologies. Despite these challenges, the overall market outlook for North American armored fighting vehicles remains positive, driven by the enduring need for modernized defense capabilities and proactive strategic investments from various stakeholders. The industry’s focus on enhancing technological capabilities, alongside continuous investments in research and development, suggests a future trajectory of continued market expansion.
North America Armored Fighting Vehicles Industry Company Market Share
This comprehensive report provides an in-depth analysis of the North American armored fighting vehicles (AFV) industry, encompassing market dynamics, growth trends, key players, and future outlook. With a focus on the parent market of defense spending and the child market of land-based military vehicles, this report is essential for industry professionals, investors, and strategic decision-makers. The study period covers 2019-2033, with a base year of 2025 and a forecast period of 2025-2033. Market values are presented in millions of USD.
North America Armored Fighting Vehicles Industry Market Dynamics & Structure
The North American armored fighting vehicles market is characterized by moderate concentration, with a few major players dominating the landscape. Technological innovation, driven by demands for enhanced protection, mobility, and firepower, significantly shapes market dynamics. Stringent regulatory frameworks and export controls influence market access and competition. Substitutes, although limited, include unmanned ground vehicles (UGVs) and other technological advancements in military hardware. End-user demographics are primarily government defense departments, with the US and Canada holding the largest market shares. Mergers and acquisitions (M&A) activity remains relatively frequent, consolidating market power and facilitating technological integration.
- Market Concentration: Highly concentrated, with the top 5 players holding approximately xx% of the market share in 2024.
- Technological Innovation Drivers: Advanced materials, AI-powered systems, improved survivability technologies, and autonomous capabilities.
- Regulatory Frameworks: Stringent export controls and defense procurement regulations influence market dynamics.
- M&A Trends: Consolidation continues through strategic acquisitions of smaller companies by larger players, reaching xx deals in the historical period.
- Innovation Barriers: High R&D costs, lengthy testing and certification processes, and security considerations.
North America Armored Fighting Vehicles Industry Growth Trends & Insights
The North American AFV market experienced steady growth during the historical period (2019-2024), driven by increasing defense budgets and modernization initiatives. The market size reached xx million units in 2024 and is projected to reach xx million units by 2033, exhibiting a CAGR of xx% during the forecast period (2025-2033). Adoption rates vary across vehicle types, with APCs and IFVs witnessing higher demand compared to MBTs. Technological disruptions, particularly in areas such as autonomous systems and improved sensor technologies, are expected to accelerate market growth. Shifting geopolitical dynamics and an emphasis on asymmetric warfare are also contributing to increased procurement.
Dominant Regions, Countries, or Segments in North America Armored Fighting Vehicles Industry
The United States dominates the North American armored fighting vehicles market, accounting for the largest share of both production and consumption. Canada is a significant secondary market, driven by ongoing military modernization programs. Within vehicle types, Armored Personnel Carriers (APCs) hold the largest market segment due to their versatility and adaptability to various operational needs.
- United States: Dominant due to substantial defense spending, a large army, and a robust domestic manufacturing base.
- Canada: Significant market driven by military modernization and border security concerns.
- APC Segment: Largest segment owing to widespread use and relatively lower acquisition cost compared to IFVs and MBTs.
- IFV Segment: Strong growth driven by modernization programs focused on improved infantry mobility and firepower.
- MBT Segment: Market size is smaller than APC and IFV segments, but it is expected to grow in the coming years.
- Other Vehicle Types: This segment includes specialized armored vehicles like reconnaissance vehicles, command vehicles, and engineering vehicles which has relatively smaller market size but is expected to grow due to its important role in the military.
North America Armored Fighting Vehicles Industry Product Landscape
The product landscape is characterized by a wide array of armored fighting vehicles, ranging from lightweight APCs to heavy MBTs. Recent innovations focus on increased protection through advanced armor materials and composite structures, enhanced mobility via improved suspension systems and powertrains, and improved firepower through the integration of advanced weapon systems and precision-guided munitions. Unique selling propositions often include tailored configurations to meet specific operational needs and the integration of advanced technologies such as active protection systems.
Key Drivers, Barriers & Challenges in North America Armored Fighting Vehicles Industry
Key Drivers:
- Increasing defense budgets in the US and Canada.
- Modernization of existing fleets and replacement of outdated equipment.
- Growing demand for enhanced protection and technological upgrades.
- Geopolitical instability and increased regional conflicts.
Key Challenges:
- High manufacturing costs and lengthy production cycles.
- Supply chain disruptions and dependence on global suppliers.
- Stringent regulatory compliance requirements and export controls.
- Intense competition amongst established and emerging players.
Emerging Opportunities in North America Armored Fighting Vehicles Industry
- Development and integration of autonomous systems and AI capabilities.
- Increased demand for specialized armored vehicles such as mine-resistant ambush protected (MRAP) vehicles.
- Opportunities in the export market, particularly in allied nations.
- Growing demand for hybrid and electric-powered armored vehicles, aimed at reducing fuel consumption and emissions.
Growth Accelerators in the North America Armored Fighting Vehicles Industry
Long-term growth is expected to be fueled by continuous technological advancements, strategic partnerships between defense contractors and technology firms, and expansion into new international markets. Increased focus on cybersecurity and integration of advanced communication systems will further drive market growth. Government investments in R&D and modernization initiatives remain critical drivers.
Key Players Shaping the North America Armored Fighting Vehicles Market
Notable Milestones in North America Armored Fighting Vehicles Industry Sector
- November 2022: BAE Systems plc awarded a USD 32 million contract by the US DoD to supply M2A4 and M7A4 Bradley fighting vehicles to the US Army.
- November 2022: The Canadian military contracted General Dynamics Corporation for USD 165 million to acquire 39 additional light-armored vehicles.
In-Depth North America Armored Fighting Vehicles Industry Market Outlook
The North American armored fighting vehicles market is poised for sustained growth over the forecast period, driven by a combination of factors including increased defense spending, technological innovation, and geopolitical uncertainties. Strategic partnerships, focused R&D initiatives, and a shift towards advanced technologies, such as autonomous systems, will play a crucial role in shaping the future market landscape. Opportunities exist for companies that can adapt to evolving operational requirements and provide innovative, cost-effective solutions.
North America Armored Fighting Vehicles Industry Segmentation
-
1. Vehicle Type
- 1.1. Armored Personnel Carrier (APC)
- 1.2. Infantry Fighting Vehicle (IFV)
- 1.3. Main Battle Tank (MBT)
- 1.4. Other Vehicle Types
-
2. Geography
- 2.1. United States
- 2.2. Canada
North America Armored Fighting Vehicles Industry Segmentation By Geography
- 1. United States
- 2. Canada
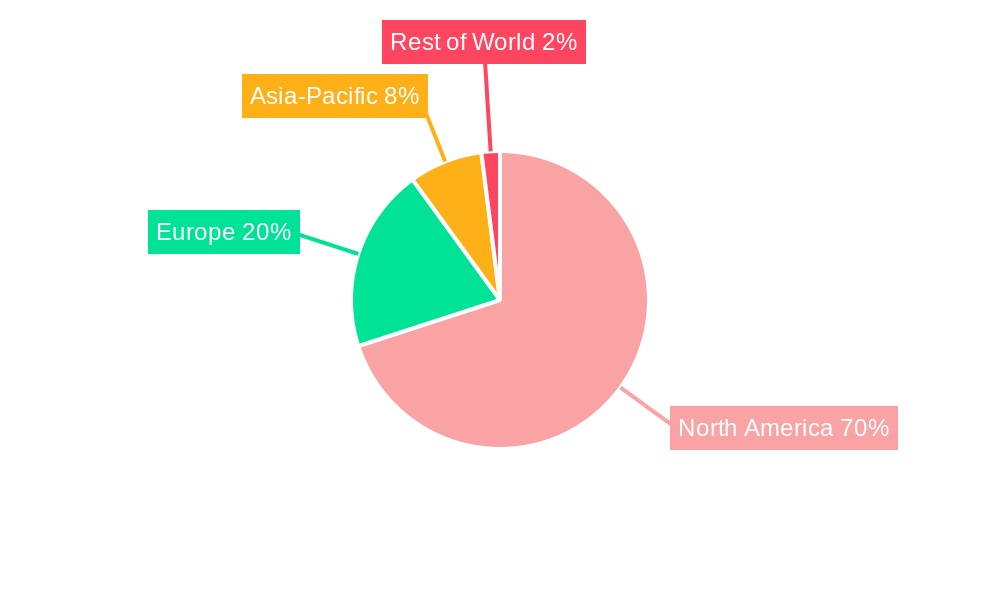
North America Armored Fighting Vehicles Industry Regional Market Share
Geographic Coverage of North America Armored Fighting Vehicles Industry
North America Armored Fighting Vehicles Industry REPORT HIGHLIGHTS
| Aspects | Details |
|---|---|
| Study Period | 2020-2034 |
| Base Year | 2025 |
| Estimated Year | 2026 |
| Forecast Period | 2026-2034 |
| Historical Period | 2020-2025 |
| Growth Rate | CAGR of 5.18% from 2020-2034 |
| Segmentation |
|
Table of Contents
- 1. Introduction
- 1.1. Research Scope
- 1.2. Market Segmentation
- 1.3. Research Objective
- 1.4. Definitions and Assumptions
- 2. Executive Summary
- 2.1. Market Snapshot
- 3. Market Dynamics
- 3.1. Market Drivers
- 3.2. Market Restrains
- 3.3. Market Trends
- 3.4. Market Opportunities
- 4. Market Factor Analysis
- 4.1. Porters Five Forces
- 4.1.1. Bargaining Power of Suppliers
- 4.1.2. Bargaining Power of Buyers
- 4.1.3. Threat of New Entrants
- 4.1.4. Threat of Substitutes
- 4.1.5. Competitive Rivalry
- 4.2. PESTEL analysis
- 4.3. BCG Analysis
- 4.3.1. Stars (High Growth, High Market Share)
- 4.3.2. Cash Cows (Low Growth, High Market Share)
- 4.3.3. Question Mark (High Growth, Low Market Share)
- 4.3.4. Dogs (Low Growth, Low Market Share)
- 4.4. Ansoff Matrix Analysis
- 4.5. Supply Chain Analysis
- 4.6. Regulatory Landscape
- 4.7. Current Market Potential and Opportunity Assessment (TAM–SAM–SOM Framework)
- 4.8. VDR Analyst Note
- 4.1. Porters Five Forces
- 5. Market Analysis, Insights and Forecast 2021-2033
- 5.1. Market Analysis, Insights and Forecast - by Vehicle Type
- 5.1.1. Armored Personnel Carrier (APC)
- 5.1.2. Infantry Fighting Vehicle (IFV)
- 5.1.3. Main Battle Tank (MBT)
- 5.1.4. Other Vehicle Types
- 5.2. Market Analysis, Insights and Forecast - by Geography
- 5.2.1. United States
- 5.2.2. Canada
- 5.3. Market Analysis, Insights and Forecast - by Region
- 5.3.1. United States
- 5.3.2. Canada
- 5.1. Market Analysis, Insights and Forecast - by Vehicle Type
- 6. North America Armored Fighting Vehicles Industry Analysis, Insights and Forecast, 2021-2033
- 6.1. Market Analysis, Insights and Forecast - by Vehicle Type
- 6.1.1. Armored Personnel Carrier (APC)
- 6.1.2. Infantry Fighting Vehicle (IFV)
- 6.1.3. Main Battle Tank (MBT)
- 6.1.4. Other Vehicle Types
- 6.2. Market Analysis, Insights and Forecast - by Geography
- 6.2.1. United States
- 6.2.2. Canada
- 6.1. Market Analysis, Insights and Forecast - by Vehicle Type
- 7. United States North America Armored Fighting Vehicles Industry Analysis, Insights and Forecast, 2021-2033
- 7.1. Market Analysis, Insights and Forecast - by Vehicle Type
- 7.1.1. Armored Personnel Carrier (APC)
- 7.1.2. Infantry Fighting Vehicle (IFV)
- 7.1.3. Main Battle Tank (MBT)
- 7.1.4. Other Vehicle Types
- 7.2. Market Analysis, Insights and Forecast - by Geography
- 7.2.1. United States
- 7.2.2. Canada
- 7.1. Market Analysis, Insights and Forecast - by Vehicle Type
- 8. Canada North America Armored Fighting Vehicles Industry Analysis, Insights and Forecast, 2021-2033
- 8.1. Market Analysis, Insights and Forecast - by Vehicle Type
- 8.1.1. Armored Personnel Carrier (APC)
- 8.1.2. Infantry Fighting Vehicle (IFV)
- 8.1.3. Main Battle Tank (MBT)
- 8.1.4. Other Vehicle Types
- 8.2. Market Analysis, Insights and Forecast - by Geography
- 8.2.1. United States
- 8.2.2. Canada
- 8.1. Market Analysis, Insights and Forecast - by Vehicle Type
- 9. Competitive Analysis
- 9.1. Company Profiles
- 9.1.1 Textron Inc
- 9.1.1.1. Company Overview
- 9.1.1.2. Products
- 9.1.1.3. Company Financials
- 9.1.1.4. SWOT Analysis
- 9.1.2 THALES
- 9.1.2.1. Company Overview
- 9.1.2.2. Products
- 9.1.2.3. Company Financials
- 9.1.2.4. SWOT Analysis
- 9.1.3 Oshkosh Corporation
- 9.1.3.1. Company Overview
- 9.1.3.2. Products
- 9.1.3.3. Company Financials
- 9.1.3.4. SWOT Analysis
- 9.1.4 General Dynamics Corporation
- 9.1.4.1. Company Overview
- 9.1.4.2. Products
- 9.1.4.3. Company Financials
- 9.1.4.4. SWOT Analysis
- 9.1.5 Rheinmetall AG
- 9.1.5.1. Company Overview
- 9.1.5.2. Products
- 9.1.5.3. Company Financials
- 9.1.5.4. SWOT Analysis
- 9.1.6 Elbit Systems Ltd
- 9.1.6.1. Company Overview
- 9.1.6.2. Products
- 9.1.6.3. Company Financials
- 9.1.6.4. SWOT Analysis
- 9.1.7 QinetiQ Group
- 9.1.7.1. Company Overview
- 9.1.7.2. Products
- 9.1.7.3. Company Financials
- 9.1.7.4. SWOT Analysis
- 9.1.8 AM General LLC
- 9.1.8.1. Company Overview
- 9.1.8.2. Products
- 9.1.8.3. Company Financials
- 9.1.8.4. SWOT Analysis
- 9.1.9 Leonardo S p A
- 9.1.9.1. Company Overview
- 9.1.9.2. Products
- 9.1.9.3. Company Financials
- 9.1.9.4. SWOT Analysis
- 9.1.10 BAE Systems plc
- 9.1.10.1. Company Overview
- 9.1.10.2. Products
- 9.1.10.3. Company Financials
- 9.1.10.4. SWOT Analysis
- 9.1.11 HDT Global
- 9.1.11.1. Company Overview
- 9.1.11.2. Products
- 9.1.11.3. Company Financials
- 9.1.11.4. SWOT Analysis
- 9.1.1 Textron Inc
- 9.2. Market Entropy
- 9.2.1 Company's Key Areas Served
- 9.2.2 Recent Developments
- 9.3. Company Market Share Analysis 2025
- 9.3.1 Top 5 Companies Market Share Analysis
- 9.3.2 Top 3 Companies Market Share Analysis
- 9.4. List of Potential Customers
- 10. Research Methodology
List of Figures
- Figure 1: North America Armored Fighting Vehicles Industry Revenue Breakdown (Million, %) by Product 2025 & 2033
- Figure 2: North America Armored Fighting Vehicles Industry Share (%) by Company 2025
List of Tables
- Table 1: North America Armored Fighting Vehicles Industry Revenue Million Forecast, by Vehicle Type 2020 & 2033
- Table 2: North America Armored Fighting Vehicles Industry Revenue Million Forecast, by Geography 2020 & 2033
- Table 3: North America Armored Fighting Vehicles Industry Revenue Million Forecast, by Region 2020 & 2033
- Table 4: North America Armored Fighting Vehicles Industry Revenue Million Forecast, by Vehicle Type 2020 & 2033
- Table 5: North America Armored Fighting Vehicles Industry Revenue Million Forecast, by Geography 2020 & 2033
- Table 6: North America Armored Fighting Vehicles Industry Revenue Million Forecast, by Country 2020 & 2033
- Table 7: North America Armored Fighting Vehicles Industry Revenue Million Forecast, by Vehicle Type 2020 & 2033
- Table 8: North America Armored Fighting Vehicles Industry Revenue Million Forecast, by Geography 2020 & 2033
- Table 9: North America Armored Fighting Vehicles Industry Revenue Million Forecast, by Country 2020 & 2033
Frequently Asked Questions
1. What is the projected Compound Annual Growth Rate (CAGR) of the North America Armored Fighting Vehicles Industry?
The projected CAGR is approximately 5.18%.
2. Which companies are prominent players in the North America Armored Fighting Vehicles Industry?
Key companies in the market include Textron Inc, THALES, Oshkosh Corporation, General Dynamics Corporation, Rheinmetall AG, Elbit Systems Ltd, QinetiQ Group, AM General LLC, Leonardo S p A, BAE Systems plc, HDT Global.
3. What are the main segments of the North America Armored Fighting Vehicles Industry?
The market segments include Vehicle Type, Geography.
4. Can you provide details about the market size?
The market size is estimated to be USD 6.51 Million as of 2022.
5. What are some drivers contributing to market growth?
N/A
6. What are the notable trends driving market growth?
Main Battle Tanks Segment to Dominate the Market.
7. Are there any restraints impacting market growth?
N/A
8. Can you provide examples of recent developments in the market?
November 2022: BAE Systems plc was awarded a contract worth USD 32 million by the US Department of Defense (DoD) to supply M2A4 and M7A4 Bradley fighting vehicles to the US Army. These vehicles are designed to provide mechanized infantry with improved mobility, firepower, and protection. The project is slated to be completed by August 2023.
9. What pricing options are available for accessing the report?
Pricing options include single-user, multi-user, and enterprise licenses priced at USD 4750, USD 5250, and USD 8750 respectively.
10. Is the market size provided in terms of value or volume?
The market size is provided in terms of value, measured in Million.
11. Are there any specific market keywords associated with the report?
Yes, the market keyword associated with the report is "North America Armored Fighting Vehicles Industry," which aids in identifying and referencing the specific market segment covered.
12. How do I determine which pricing option suits my needs best?
The pricing options vary based on user requirements and access needs. Individual users may opt for single-user licenses, while businesses requiring broader access may choose multi-user or enterprise licenses for cost-effective access to the report.
13. Are there any additional resources or data provided in the North America Armored Fighting Vehicles Industry report?
While the report offers comprehensive insights, it's advisable to review the specific contents or supplementary materials provided to ascertain if additional resources or data are available.
14. How can I stay updated on further developments or reports in the North America Armored Fighting Vehicles Industry?
To stay informed about further developments, trends, and reports in the North America Armored Fighting Vehicles Industry, consider subscribing to industry newsletters, following relevant companies and organizations, or regularly checking reputable industry news sources and publications.
Methodology
Step 1 - Identification of Relevant Samples Size from Population Database


Step 2 - Approaches for Defining Global Market Size (Value, Volume* & Price*)

Note*: In applicable scenarios
Step 3 - Data Sources
Primary Research
- Web Analytics
- Survey Reports
- Research Institute
- Latest Research Reports
- Opinion Leaders
Secondary Research
- Annual Reports
- White Paper
- Latest Press Release
- Industry Association
- Paid Database
- Investor Presentations

Step 4 - Data Triangulation
Involves using different sources of information in order to increase the validity of a study
These sources are likely to be stakeholders in a program - participants, other researchers, program staff, other community members, and so on.
Then we put all data in single framework & apply various statistical tools to find out the dynamic on the market.
During the analysis stage, feedback from the stakeholder groups would be compared to determine areas of agreement as well as areas of divergence