

Key Insights
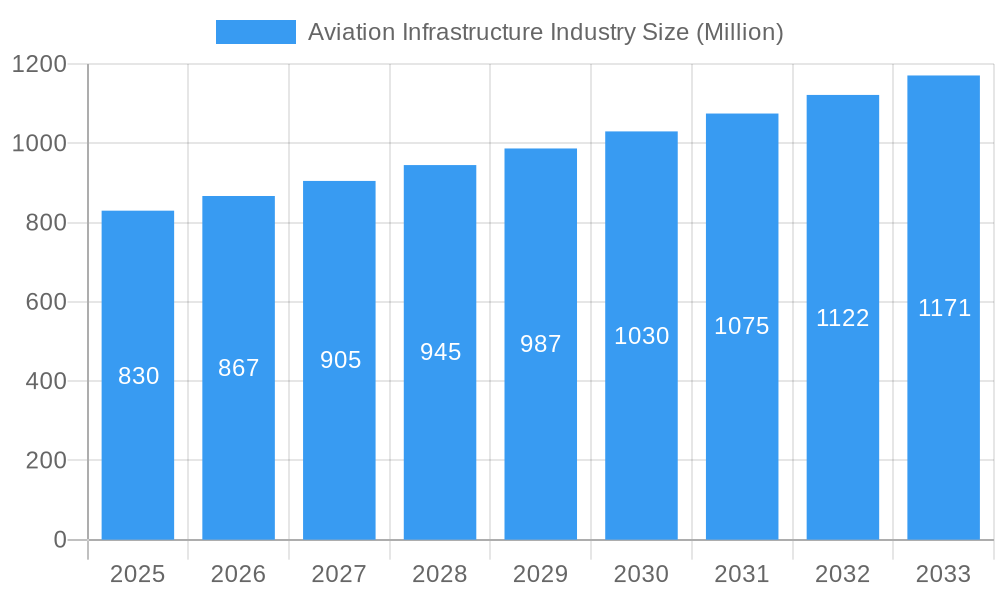
The global aviation infrastructure market, valued at $0.83 billion in 2025, is poised for significant growth, projected to expand at a compound annual growth rate (CAGR) of 4.40% from 2025 to 2033. This expansion is driven by several key factors. Increased air passenger traffic globally necessitates continuous upgrades and expansion of existing airports and the construction of new ones. The rising demand for efficient and technologically advanced airport infrastructure, including smart terminals, advanced air traffic control systems, and improved runway and taxiway technologies, fuels market growth. Furthermore, government initiatives promoting sustainable aviation practices and investments in airport infrastructure modernization across various regions contribute significantly. Growth is particularly noticeable in the Asia-Pacific region, fueled by rapid economic expansion and rising disposable incomes, leading to increased air travel demand. While challenges exist, such as high initial investment costs for infrastructure projects and potential regulatory hurdles, the long-term outlook remains positive, with opportunities for both established and emerging players in the construction and engineering sectors.
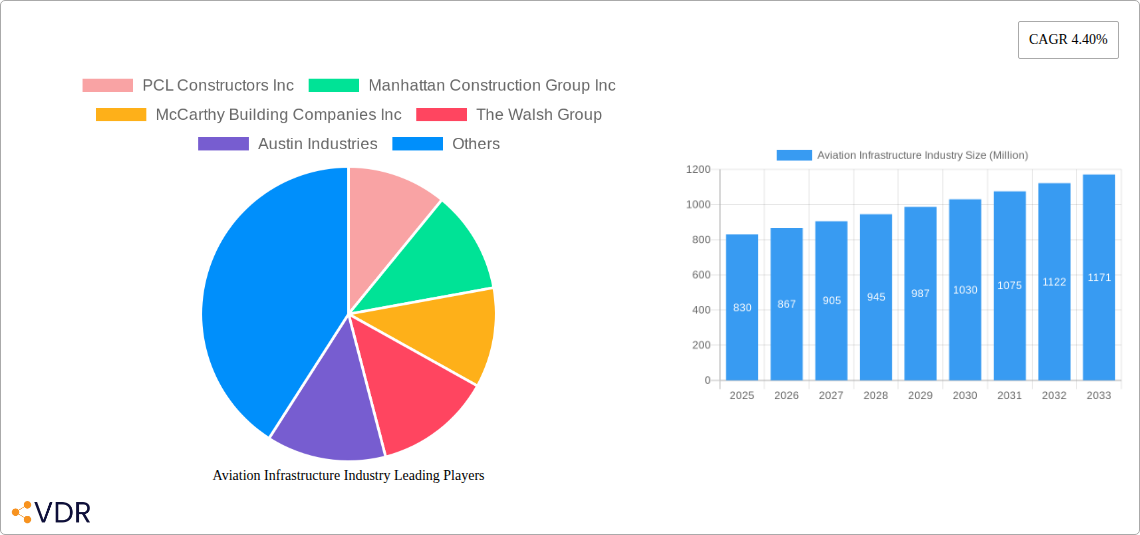
Aviation Infrastructure Industry Market Size (In Million)
The market segmentation reveals a diverse landscape. Commercial airports dominate the airport type segment, reflecting the higher volume of passenger traffic compared to military and general aviation airports. Within infrastructure types, terminal construction projects account for a substantial share, driven by the continuous need for expansion and modernization to accommodate growing passenger numbers and improve passenger experience. The ongoing development of smart airports, integrating advanced technologies like AI and IoT, further stimulates demand for specialized infrastructure and services. Key players, including PCL Constructors Inc, McCarthy Building Companies Inc, and AECOM, among others, are actively competing in this dynamic market, leveraging their expertise in large-scale construction and engineering projects. The North American and European markets currently hold a larger share, but the Asia-Pacific region is projected to experience the fastest growth in the coming years. This makes it a strategically important region for companies seeking expansion and new business opportunities.
Aviation Infrastructure Industry Company Market Share
Aviation Infrastructure Industry Market Report: 2019-2033
This comprehensive report provides a detailed analysis of the Aviation Infrastructure Industry, encompassing market dynamics, growth trends, regional insights, and key player strategies. Covering the period 2019-2033, with a focus on the base year 2025, this report is an invaluable resource for industry professionals, investors, and stakeholders seeking to navigate this dynamic sector. The report segments the market by infrastructure type (Terminal, Control Tower, Taxiway and Runway, Apron, Hangar, Other Infrastructure Types) and airport type (Commercial Airport, Military Airport, General Aviation Airport). The total market size is projected to reach xx Million by 2033.
Aviation Infrastructure Industry Market Dynamics & Structure
The aviation infrastructure market is characterized by moderate concentration, with a few large players dominating specific segments. Technological innovation, primarily driven by automation, improved materials, and sustainable construction techniques, is a key growth driver. Stringent regulatory frameworks concerning safety, environmental impact, and security significantly influence project development and timelines. The industry faces competition from alternative materials and construction methods, while end-user demographics are largely determined by air passenger growth and government investments. Mergers and acquisitions (M&A) activity is relatively frequent, as larger firms seek to expand their market share and geographic reach.
- Market Concentration: Moderately concentrated, with top 5 players holding approximately 40% market share (2025 estimate).
- Technological Innovation: Focus on sustainable materials, automation (e.g., robotic construction), and digital twin technology for improved project management.
- Regulatory Framework: Stringent safety and environmental regulations impacting project costs and timelines.
- M&A Activity: An average of 15-20 significant M&A deals annually in the last 5 years (2019-2024).
- Innovation Barriers: High initial investment costs for new technologies, lack of skilled labor, and bureaucratic approval processes.
Aviation Infrastructure Industry Growth Trends & Insights
The aviation infrastructure market experienced robust growth during the historical period (2019-2024), primarily fueled by increasing air passenger traffic, expansion of existing airports, and the construction of new facilities globally. While the COVID-19 pandemic caused a temporary slowdown, the market is experiencing a strong recovery with a projected Compound Annual Growth Rate (CAGR) of 6% during the forecast period (2025-2033). Technological disruptions, particularly the adoption of Building Information Modeling (BIM) and advanced analytics, are streamlining project execution and improving efficiency. Shifting consumer preferences towards enhanced passenger experience are further driving investments in modern airport infrastructure. Market penetration of sustainable construction practices is steadily increasing, driven by environmental concerns and government incentives.
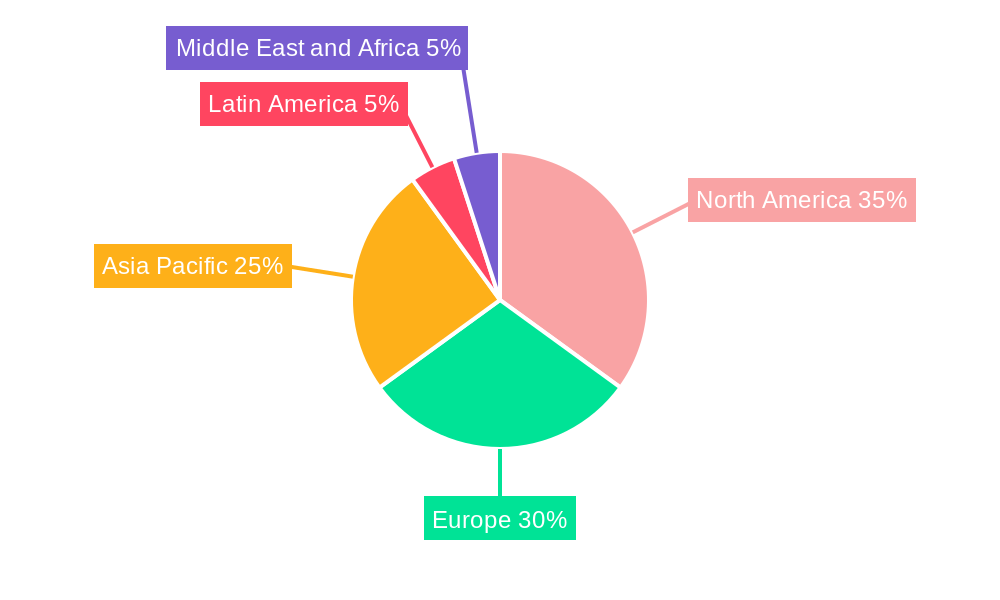
Dominant Regions, Countries, or Segments in Aviation Infrastructure Industry
The Asia-Pacific region dominates the aviation infrastructure market, driven by rapid economic growth, increasing air travel demand, and significant government investments in airport infrastructure development. Within this region, countries like China and India are leading contributors. The Commercial Airport segment holds the largest market share, followed by the Taxiway and Runway segment.
- Key Drivers (Asia-Pacific): High air passenger growth, substantial government spending on infrastructure, and rapid urbanization.
- Dominance Factors: Large-scale airport expansion projects, robust economic growth, and government support for infrastructure development.
- Growth Potential: Significant potential in Southeast Asia and other developing economies within the region.
- Commercial Airport Segment: High demand for enhanced passenger facilities, improved security systems, and efficient baggage handling.
Aviation Infrastructure Industry Product Landscape
The aviation infrastructure market encompasses a wide range of products, including advanced construction materials (high-strength concrete, composite materials), intelligent building systems (smart lighting, automated security), and sophisticated air traffic control technologies. These innovations are aimed at improving operational efficiency, passenger experience, and environmental sustainability. Unique selling propositions center around reduced construction time, enhanced safety features, and improved energy efficiency. Continuous advancements in materials science and information technology are driving ongoing product development.
Key Drivers, Barriers & Challenges in Aviation Infrastructure Industry
Key Drivers: Increasing air passenger traffic, government investments in infrastructure development, and technological advancements in construction and air traffic management. Specific examples include the ongoing expansion of major international airports and the adoption of innovative materials for sustainable construction.
Challenges: Supply chain disruptions causing material shortages and delays (estimated impact: 5-10% project cost increase), stringent regulatory approvals slowing down project commencement (average delay: 6-12 months), and intense competition among contractors resulting in reduced profit margins.
Emerging Opportunities in Aviation Infrastructure Industry
Emerging opportunities lie in the development of smart airports incorporating IoT and AI technologies, the expansion of sustainable and green infrastructure solutions, and the growth of regional airports in underserved areas. Furthermore, the increasing adoption of modular construction methods presents significant potential for reducing project costs and timelines.
Growth Accelerators in the Aviation Infrastructure Industry
Technological breakthroughs in areas such as 3D printing and advanced robotics are poised to revolutionize construction practices, leading to faster project completion and cost savings. Strategic partnerships between public and private entities are crucial for securing funding and streamlining regulatory processes. Expansion into emerging markets and regions with growing air travel demand will further drive long-term growth.
Key Players Shaping the Aviation Infrastructure Industry Market
- PCL Constructors Inc
- Manhattan Construction Group Inc
- McCarthy Building Companies Inc
- The Walsh Group
- Austin Industries
- Hill International Inc
- The Sundt Companies Inc
- Hensel Phelps
- Royal BAM Group NV
- Turner Construction Company
- J E Dunn Construction Company
- Skanska
- BIC Contracting LLC
- TAV Construction
- AECOM
- ALEC Engineering and Contracting
Notable Milestones in Aviation Infrastructure Industry Sector
- 2020, Q4: Introduction of new sustainable building materials by Skanska, leading to reduced carbon footprint in construction projects.
- 2022, Q2: Successful completion of a large-scale airport expansion project in China by PCL Constructors Inc. using advanced robotic technologies.
- 2023, Q1: Merger between two mid-sized construction firms resulting in expanded market share and capabilities.
In-Depth Aviation Infrastructure Industry Market Outlook
The aviation infrastructure market is projected to experience sustained growth over the forecast period, driven by continued investments in airport modernization and expansion, technological innovation, and the emergence of new markets. Strategic partnerships, focusing on sustainability and digitalization, will be key for companies seeking to capitalize on the significant growth potential within this sector. The increasing adoption of innovative construction technologies and advanced air traffic control systems will further enhance operational efficiency and passenger experience, driving future demand.
Aviation Infrastructure Industry Segmentation
-
1. Airport Type
- 1.1. Commercial Airport
- 1.2. Military Airport
- 1.3. General Aviation Airport
-
2. Infrastructure Type
- 2.1. Terminal
- 2.2. Control Tower
- 2.3. Taxiway and Runway
- 2.4. Apron
- 2.5. Hangar
- 2.6. Other Infrastructure Types
Aviation Infrastructure Industry Segmentation By Geography
-
1. North America
- 1.1. United States
- 1.2. Canada
-
2. Europe
- 2.1. United Kingdom
- 2.2. Germany
- 2.3. France
- 2.4. Rest of Europe
-
3. Asia Pacific
- 3.1. China
- 3.2. India
- 3.3. Japan
- 3.4. South Korea
- 3.5. Rest of Asia Pacific
-
4. Latin America
- 4.1. Brazil
- 4.2. Rest of Latin America
-
5. Middle East and Africa
- 5.1. United Arab Emirates
- 5.2. Saudi Arabia
- 5.3. Rest of Middle East and Africa
Aviation Infrastructure Industry Regional Market Share
Geographic Coverage of Aviation Infrastructure Industry
Aviation Infrastructure Industry REPORT HIGHLIGHTS
| Aspects | Details |
|---|---|
| Study Period | 2020-2034 |
| Base Year | 2025 |
| Estimated Year | 2026 |
| Forecast Period | 2026-2034 |
| Historical Period | 2020-2025 |
| Growth Rate | CAGR of 4.40% from 2020-2034 |
| Segmentation |
|
Table of Contents
- 1. Introduction
- 1.1. Research Scope
- 1.2. Market Segmentation
- 1.3. Research Objective
- 1.4. Definitions and Assumptions
- 2. Executive Summary
- 2.1. Market Snapshot
- 3. Market Dynamics
- 3.1. Market Drivers
- 3.2. Market Restrains
- 3.3. Market Trends
- 3.4. Market Opportunities
- 4. Market Factor Analysis
- 4.1. Porters Five Forces
- 4.1.1. Bargaining Power of Suppliers
- 4.1.2. Bargaining Power of Buyers
- 4.1.3. Threat of New Entrants
- 4.1.4. Threat of Substitutes
- 4.1.5. Competitive Rivalry
- 4.2. PESTEL analysis
- 4.3. BCG Analysis
- 4.3.1. Stars (High Growth, High Market Share)
- 4.3.2. Cash Cows (Low Growth, High Market Share)
- 4.3.3. Question Mark (High Growth, Low Market Share)
- 4.3.4. Dogs (Low Growth, Low Market Share)
- 4.4. Ansoff Matrix Analysis
- 4.5. Supply Chain Analysis
- 4.6. Regulatory Landscape
- 4.7. Current Market Potential and Opportunity Assessment (TAM–SAM–SOM Framework)
- 4.8. VDR Analyst Note
- 4.1. Porters Five Forces
- 5. Market Analysis, Insights and Forecast 2021-2033
- 5.1. Market Analysis, Insights and Forecast - by Airport Type
- 5.1.1. Commercial Airport
- 5.1.2. Military Airport
- 5.1.3. General Aviation Airport
- 5.2. Market Analysis, Insights and Forecast - by Infrastructure Type
- 5.2.1. Terminal
- 5.2.2. Control Tower
- 5.2.3. Taxiway and Runway
- 5.2.4. Apron
- 5.2.5. Hangar
- 5.2.6. Other Infrastructure Types
- 5.3. Market Analysis, Insights and Forecast - by Region
- 5.3.1. North America
- 5.3.2. Europe
- 5.3.3. Asia Pacific
- 5.3.4. Latin America
- 5.3.5. Middle East and Africa
- 5.1. Market Analysis, Insights and Forecast - by Airport Type
- 6. Global Aviation Infrastructure Industry Analysis, Insights and Forecast, 2021-2033
- 6.1. Market Analysis, Insights and Forecast - by Airport Type
- 6.1.1. Commercial Airport
- 6.1.2. Military Airport
- 6.1.3. General Aviation Airport
- 6.2. Market Analysis, Insights and Forecast - by Infrastructure Type
- 6.2.1. Terminal
- 6.2.2. Control Tower
- 6.2.3. Taxiway and Runway
- 6.2.4. Apron
- 6.2.5. Hangar
- 6.2.6. Other Infrastructure Types
- 6.1. Market Analysis, Insights and Forecast - by Airport Type
- 7. North America Aviation Infrastructure Industry Analysis, Insights and Forecast, 2021-2033
- 7.1. Market Analysis, Insights and Forecast - by Airport Type
- 7.1.1. Commercial Airport
- 7.1.2. Military Airport
- 7.1.3. General Aviation Airport
- 7.2. Market Analysis, Insights and Forecast - by Infrastructure Type
- 7.2.1. Terminal
- 7.2.2. Control Tower
- 7.2.3. Taxiway and Runway
- 7.2.4. Apron
- 7.2.5. Hangar
- 7.2.6. Other Infrastructure Types
- 7.1. Market Analysis, Insights and Forecast - by Airport Type
- 8. Europe Aviation Infrastructure Industry Analysis, Insights and Forecast, 2021-2033
- 8.1. Market Analysis, Insights and Forecast - by Airport Type
- 8.1.1. Commercial Airport
- 8.1.2. Military Airport
- 8.1.3. General Aviation Airport
- 8.2. Market Analysis, Insights and Forecast - by Infrastructure Type
- 8.2.1. Terminal
- 8.2.2. Control Tower
- 8.2.3. Taxiway and Runway
- 8.2.4. Apron
- 8.2.5. Hangar
- 8.2.6. Other Infrastructure Types
- 8.1. Market Analysis, Insights and Forecast - by Airport Type
- 9. Asia Pacific Aviation Infrastructure Industry Analysis, Insights and Forecast, 2021-2033
- 9.1. Market Analysis, Insights and Forecast - by Airport Type
- 9.1.1. Commercial Airport
- 9.1.2. Military Airport
- 9.1.3. General Aviation Airport
- 9.2. Market Analysis, Insights and Forecast - by Infrastructure Type
- 9.2.1. Terminal
- 9.2.2. Control Tower
- 9.2.3. Taxiway and Runway
- 9.2.4. Apron
- 9.2.5. Hangar
- 9.2.6. Other Infrastructure Types
- 9.1. Market Analysis, Insights and Forecast - by Airport Type
- 10. Latin America Aviation Infrastructure Industry Analysis, Insights and Forecast, 2021-2033
- 10.1. Market Analysis, Insights and Forecast - by Airport Type
- 10.1.1. Commercial Airport
- 10.1.2. Military Airport
- 10.1.3. General Aviation Airport
- 10.2. Market Analysis, Insights and Forecast - by Infrastructure Type
- 10.2.1. Terminal
- 10.2.2. Control Tower
- 10.2.3. Taxiway and Runway
- 10.2.4. Apron
- 10.2.5. Hangar
- 10.2.6. Other Infrastructure Types
- 10.1. Market Analysis, Insights and Forecast - by Airport Type
- 11. Middle East and Africa Aviation Infrastructure Industry Analysis, Insights and Forecast, 2021-2033
- 11.1. Market Analysis, Insights and Forecast - by Airport Type
- 11.1.1. Commercial Airport
- 11.1.2. Military Airport
- 11.1.3. General Aviation Airport
- 11.2. Market Analysis, Insights and Forecast - by Infrastructure Type
- 11.2.1. Terminal
- 11.2.2. Control Tower
- 11.2.3. Taxiway and Runway
- 11.2.4. Apron
- 11.2.5. Hangar
- 11.2.6. Other Infrastructure Types
- 11.1. Market Analysis, Insights and Forecast - by Airport Type
- 12. Competitive Analysis
- 12.1. Company Profiles
- 12.1.1 PCL Constructors Inc
- 12.1.1.1. Company Overview
- 12.1.1.2. Products
- 12.1.1.3. Company Financials
- 12.1.1.4. SWOT Analysis
- 12.1.2 Manhattan Construction Group Inc
- 12.1.2.1. Company Overview
- 12.1.2.2. Products
- 12.1.2.3. Company Financials
- 12.1.2.4. SWOT Analysis
- 12.1.3 McCarthy Building Companies Inc
- 12.1.3.1. Company Overview
- 12.1.3.2. Products
- 12.1.3.3. Company Financials
- 12.1.3.4. SWOT Analysis
- 12.1.4 The Walsh Group
- 12.1.4.1. Company Overview
- 12.1.4.2. Products
- 12.1.4.3. Company Financials
- 12.1.4.4. SWOT Analysis
- 12.1.5 Austin Industries
- 12.1.5.1. Company Overview
- 12.1.5.2. Products
- 12.1.5.3. Company Financials
- 12.1.5.4. SWOT Analysis
- 12.1.6 Hill International Inc
- 12.1.6.1. Company Overview
- 12.1.6.2. Products
- 12.1.6.3. Company Financials
- 12.1.6.4. SWOT Analysis
- 12.1.7 The Sundt Companies Inc
- 12.1.7.1. Company Overview
- 12.1.7.2. Products
- 12.1.7.3. Company Financials
- 12.1.7.4. SWOT Analysis
- 12.1.8 Hensel Phelps
- 12.1.8.1. Company Overview
- 12.1.8.2. Products
- 12.1.8.3. Company Financials
- 12.1.8.4. SWOT Analysis
- 12.1.9 Royal BAM Group NV
- 12.1.9.1. Company Overview
- 12.1.9.2. Products
- 12.1.9.3. Company Financials
- 12.1.9.4. SWOT Analysis
- 12.1.10 Turner Construction Company
- 12.1.10.1. Company Overview
- 12.1.10.2. Products
- 12.1.10.3. Company Financials
- 12.1.10.4. SWOT Analysis
- 12.1.11 J E Dunn Construction Company
- 12.1.11.1. Company Overview
- 12.1.11.2. Products
- 12.1.11.3. Company Financials
- 12.1.11.4. SWOT Analysis
- 12.1.12 Skanska
- 12.1.12.1. Company Overview
- 12.1.12.2. Products
- 12.1.12.3. Company Financials
- 12.1.12.4. SWOT Analysis
- 12.1.13 BIC Contracting LLC
- 12.1.13.1. Company Overview
- 12.1.13.2. Products
- 12.1.13.3. Company Financials
- 12.1.13.4. SWOT Analysis
- 12.1.14 TAV Construction
- 12.1.14.1. Company Overview
- 12.1.14.2. Products
- 12.1.14.3. Company Financials
- 12.1.14.4. SWOT Analysis
- 12.1.15 AECOM
- 12.1.15.1. Company Overview
- 12.1.15.2. Products
- 12.1.15.3. Company Financials
- 12.1.15.4. SWOT Analysis
- 12.1.16 ALEC Engineering and Contracting
- 12.1.16.1. Company Overview
- 12.1.16.2. Products
- 12.1.16.3. Company Financials
- 12.1.16.4. SWOT Analysis
- 12.1.1 PCL Constructors Inc
- 12.2. Market Entropy
- 12.2.1 Company's Key Areas Served
- 12.2.2 Recent Developments
- 12.3. Company Market Share Analysis 2025
- 12.3.1 Top 5 Companies Market Share Analysis
- 12.3.2 Top 3 Companies Market Share Analysis
- 12.4. List of Potential Customers
- 13. Research Methodology
List of Figures
- Figure 1: Global Aviation Infrastructure Industry Revenue Breakdown (Million, %) by Region 2025 & 2033
- Figure 2: North America Aviation Infrastructure Industry Revenue (Million), by Airport Type 2025 & 2033
- Figure 3: North America Aviation Infrastructure Industry Revenue Share (%), by Airport Type 2025 & 2033
- Figure 4: North America Aviation Infrastructure Industry Revenue (Million), by Infrastructure Type 2025 & 2033
- Figure 5: North America Aviation Infrastructure Industry Revenue Share (%), by Infrastructure Type 2025 & 2033
- Figure 6: North America Aviation Infrastructure Industry Revenue (Million), by Country 2025 & 2033
- Figure 7: North America Aviation Infrastructure Industry Revenue Share (%), by Country 2025 & 2033
- Figure 8: Europe Aviation Infrastructure Industry Revenue (Million), by Airport Type 2025 & 2033
- Figure 9: Europe Aviation Infrastructure Industry Revenue Share (%), by Airport Type 2025 & 2033
- Figure 10: Europe Aviation Infrastructure Industry Revenue (Million), by Infrastructure Type 2025 & 2033
- Figure 11: Europe Aviation Infrastructure Industry Revenue Share (%), by Infrastructure Type 2025 & 2033
- Figure 12: Europe Aviation Infrastructure Industry Revenue (Million), by Country 2025 & 2033
- Figure 13: Europe Aviation Infrastructure Industry Revenue Share (%), by Country 2025 & 2033
- Figure 14: Asia Pacific Aviation Infrastructure Industry Revenue (Million), by Airport Type 2025 & 2033
- Figure 15: Asia Pacific Aviation Infrastructure Industry Revenue Share (%), by Airport Type 2025 & 2033
- Figure 16: Asia Pacific Aviation Infrastructure Industry Revenue (Million), by Infrastructure Type 2025 & 2033
- Figure 17: Asia Pacific Aviation Infrastructure Industry Revenue Share (%), by Infrastructure Type 2025 & 2033
- Figure 18: Asia Pacific Aviation Infrastructure Industry Revenue (Million), by Country 2025 & 2033
- Figure 19: Asia Pacific Aviation Infrastructure Industry Revenue Share (%), by Country 2025 & 2033
- Figure 20: Latin America Aviation Infrastructure Industry Revenue (Million), by Airport Type 2025 & 2033
- Figure 21: Latin America Aviation Infrastructure Industry Revenue Share (%), by Airport Type 2025 & 2033
- Figure 22: Latin America Aviation Infrastructure Industry Revenue (Million), by Infrastructure Type 2025 & 2033
- Figure 23: Latin America Aviation Infrastructure Industry Revenue Share (%), by Infrastructure Type 2025 & 2033
- Figure 24: Latin America Aviation Infrastructure Industry Revenue (Million), by Country 2025 & 2033
- Figure 25: Latin America Aviation Infrastructure Industry Revenue Share (%), by Country 2025 & 2033
- Figure 26: Middle East and Africa Aviation Infrastructure Industry Revenue (Million), by Airport Type 2025 & 2033
- Figure 27: Middle East and Africa Aviation Infrastructure Industry Revenue Share (%), by Airport Type 2025 & 2033
- Figure 28: Middle East and Africa Aviation Infrastructure Industry Revenue (Million), by Infrastructure Type 2025 & 2033
- Figure 29: Middle East and Africa Aviation Infrastructure Industry Revenue Share (%), by Infrastructure Type 2025 & 2033
- Figure 30: Middle East and Africa Aviation Infrastructure Industry Revenue (Million), by Country 2025 & 2033
- Figure 31: Middle East and Africa Aviation Infrastructure Industry Revenue Share (%), by Country 2025 & 2033
List of Tables
- Table 1: Global Aviation Infrastructure Industry Revenue Million Forecast, by Airport Type 2020 & 2033
- Table 2: Global Aviation Infrastructure Industry Revenue Million Forecast, by Infrastructure Type 2020 & 2033
- Table 3: Global Aviation Infrastructure Industry Revenue Million Forecast, by Region 2020 & 2033
- Table 4: Global Aviation Infrastructure Industry Revenue Million Forecast, by Airport Type 2020 & 2033
- Table 5: Global Aviation Infrastructure Industry Revenue Million Forecast, by Infrastructure Type 2020 & 2033
- Table 6: Global Aviation Infrastructure Industry Revenue Million Forecast, by Country 2020 & 2033
- Table 7: United States Aviation Infrastructure Industry Revenue (Million) Forecast, by Application 2020 & 2033
- Table 8: Canada Aviation Infrastructure Industry Revenue (Million) Forecast, by Application 2020 & 2033
- Table 9: Global Aviation Infrastructure Industry Revenue Million Forecast, by Airport Type 2020 & 2033
- Table 10: Global Aviation Infrastructure Industry Revenue Million Forecast, by Infrastructure Type 2020 & 2033
- Table 11: Global Aviation Infrastructure Industry Revenue Million Forecast, by Country 2020 & 2033
- Table 12: United Kingdom Aviation Infrastructure Industry Revenue (Million) Forecast, by Application 2020 & 2033
- Table 13: Germany Aviation Infrastructure Industry Revenue (Million) Forecast, by Application 2020 & 2033
- Table 14: France Aviation Infrastructure Industry Revenue (Million) Forecast, by Application 2020 & 2033
- Table 15: Rest of Europe Aviation Infrastructure Industry Revenue (Million) Forecast, by Application 2020 & 2033
- Table 16: Global Aviation Infrastructure Industry Revenue Million Forecast, by Airport Type 2020 & 2033
- Table 17: Global Aviation Infrastructure Industry Revenue Million Forecast, by Infrastructure Type 2020 & 2033
- Table 18: Global Aviation Infrastructure Industry Revenue Million Forecast, by Country 2020 & 2033
- Table 19: China Aviation Infrastructure Industry Revenue (Million) Forecast, by Application 2020 & 2033
- Table 20: India Aviation Infrastructure Industry Revenue (Million) Forecast, by Application 2020 & 2033
- Table 21: Japan Aviation Infrastructure Industry Revenue (Million) Forecast, by Application 2020 & 2033
- Table 22: South Korea Aviation Infrastructure Industry Revenue (Million) Forecast, by Application 2020 & 2033
- Table 23: Rest of Asia Pacific Aviation Infrastructure Industry Revenue (Million) Forecast, by Application 2020 & 2033
- Table 24: Global Aviation Infrastructure Industry Revenue Million Forecast, by Airport Type 2020 & 2033
- Table 25: Global Aviation Infrastructure Industry Revenue Million Forecast, by Infrastructure Type 2020 & 2033
- Table 26: Global Aviation Infrastructure Industry Revenue Million Forecast, by Country 2020 & 2033
- Table 27: Brazil Aviation Infrastructure Industry Revenue (Million) Forecast, by Application 2020 & 2033
- Table 28: Rest of Latin America Aviation Infrastructure Industry Revenue (Million) Forecast, by Application 2020 & 2033
- Table 29: Global Aviation Infrastructure Industry Revenue Million Forecast, by Airport Type 2020 & 2033
- Table 30: Global Aviation Infrastructure Industry Revenue Million Forecast, by Infrastructure Type 2020 & 2033
- Table 31: Global Aviation Infrastructure Industry Revenue Million Forecast, by Country 2020 & 2033
- Table 32: United Arab Emirates Aviation Infrastructure Industry Revenue (Million) Forecast, by Application 2020 & 2033
- Table 33: Saudi Arabia Aviation Infrastructure Industry Revenue (Million) Forecast, by Application 2020 & 2033
- Table 34: Rest of Middle East and Africa Aviation Infrastructure Industry Revenue (Million) Forecast, by Application 2020 & 2033
Frequently Asked Questions
1. What is the projected Compound Annual Growth Rate (CAGR) of the Aviation Infrastructure Industry?
The projected CAGR is approximately 4.40%.
2. Which companies are prominent players in the Aviation Infrastructure Industry?
Key companies in the market include PCL Constructors Inc, Manhattan Construction Group Inc, McCarthy Building Companies Inc, The Walsh Group, Austin Industries, Hill International Inc, The Sundt Companies Inc, Hensel Phelps, Royal BAM Group NV, Turner Construction Company, J E Dunn Construction Company, Skanska, BIC Contracting LLC, TAV Construction, AECOM, ALEC Engineering and Contracting.
3. What are the main segments of the Aviation Infrastructure Industry?
The market segments include Airport Type, Infrastructure Type.
4. Can you provide details about the market size?
The market size is estimated to be USD 0.83 Million as of 2022.
5. What are some drivers contributing to market growth?
N/A
6. What are the notable trends driving market growth?
Terminal Segment Will Showcase Remarkable Growth During the Forecast Period.
7. Are there any restraints impacting market growth?
N/A
8. Can you provide examples of recent developments in the market?
N/A
9. What pricing options are available for accessing the report?
Pricing options include single-user, multi-user, and enterprise licenses priced at USD 4750, USD 5250, and USD 8750 respectively.
10. Is the market size provided in terms of value or volume?
The market size is provided in terms of value, measured in Million.
11. Are there any specific market keywords associated with the report?
Yes, the market keyword associated with the report is "Aviation Infrastructure Industry," which aids in identifying and referencing the specific market segment covered.
12. How do I determine which pricing option suits my needs best?
The pricing options vary based on user requirements and access needs. Individual users may opt for single-user licenses, while businesses requiring broader access may choose multi-user or enterprise licenses for cost-effective access to the report.
13. Are there any additional resources or data provided in the Aviation Infrastructure Industry report?
While the report offers comprehensive insights, it's advisable to review the specific contents or supplementary materials provided to ascertain if additional resources or data are available.
14. How can I stay updated on further developments or reports in the Aviation Infrastructure Industry?
To stay informed about further developments, trends, and reports in the Aviation Infrastructure Industry, consider subscribing to industry newsletters, following relevant companies and organizations, or regularly checking reputable industry news sources and publications.
Methodology
Step 1 - Identification of Relevant Samples Size from Population Database


Step 2 - Approaches for Defining Global Market Size (Value, Volume* & Price*)

Note*: In applicable scenarios
Step 3 - Data Sources
Primary Research
- Web Analytics
- Survey Reports
- Research Institute
- Latest Research Reports
- Opinion Leaders
Secondary Research
- Annual Reports
- White Paper
- Latest Press Release
- Industry Association
- Paid Database
- Investor Presentations

Step 4 - Data Triangulation
Involves using different sources of information in order to increase the validity of a study
These sources are likely to be stakeholders in a program - participants, other researchers, program staff, other community members, and so on.
Then we put all data in single framework & apply various statistical tools to find out the dynamic on the market.
During the analysis stage, feedback from the stakeholder groups would be compared to determine areas of agreement as well as areas of divergence