

Key Insights
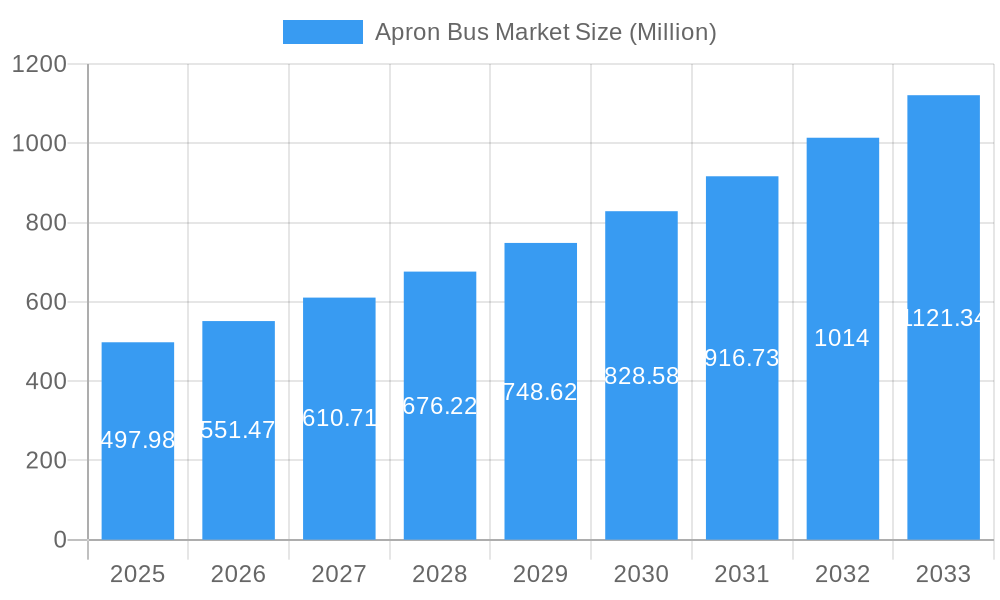
The global apron bus market, valued at $497.98 million in 2025, is projected to experience robust growth, driven by increasing air passenger traffic and a rising demand for efficient ground transportation at airports worldwide. The market's Compound Annual Growth Rate (CAGR) of 10.77% from 2019 to 2024 indicates a significant upward trajectory, expected to continue throughout the forecast period (2025-2033). Key drivers include the growing preference for electric and hybrid apron buses due to environmental concerns and stringent emission regulations. Technological advancements, such as improved battery technology and autonomous driving capabilities, further fuel market expansion. While initial investment costs for electric models might present a restraint, the long-term operational cost savings and environmental benefits are increasingly outweighing this factor. The market is segmented by fuel type, primarily encompassing electric and diesel buses. Leading players like Proterra, Ashok Leyland, and BYD are strategically investing in research and development, focusing on innovative designs and advanced technologies to meet the evolving needs of the airport industry. Regional analysis shows significant market potential across North America, Europe, and Asia-Pacific, driven by expanding airport infrastructure and increasing passenger volumes in these regions. The market's future growth is strongly correlated with the global aviation industry's performance and continued investment in airport modernization.
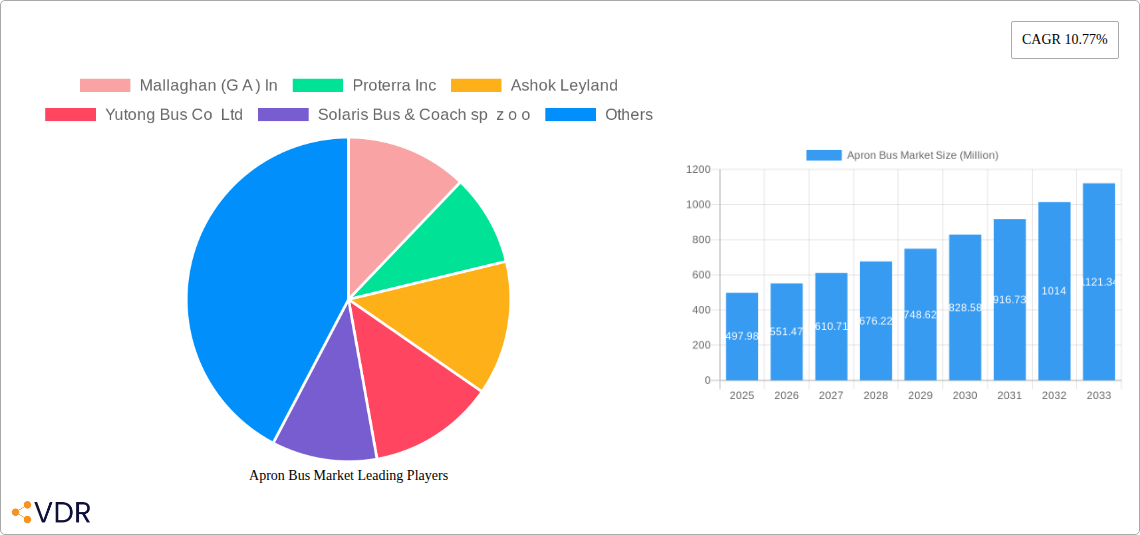
Apron Bus Market Market Size (In Million)
The segmental analysis reveals a growing preference for electric apron buses, driven by sustainability initiatives and governmental regulations promoting cleaner transportation solutions. This shift towards electric vehicles is expected to significantly impact the market landscape in the coming years. The competitive landscape is characterized by both established players and emerging companies vying for market share. Strategic partnerships, mergers, and acquisitions are likely to shape the industry's dynamics in the coming years. Geographic expansion into developing economies with rapidly growing aviation sectors presents lucrative opportunities for market participants. Continuous innovation in terms of bus design, passenger comfort, and operational efficiency will remain crucial for success in this dynamic and expanding market. Understanding the interplay of technological advancements, environmental regulations, and the overall growth of the aviation sector is critical for predicting and capitalizing on future opportunities in the apron bus market.
Apron Bus Market Company Market Share
Apron Bus Market: A Comprehensive Report (2019-2033)
This comprehensive report provides an in-depth analysis of the Apron Bus Market, encompassing market dynamics, growth trends, regional dominance, product landscape, key players, and future outlook. The report covers the period 2019-2033, with a base year of 2025 and a forecast period of 2025-2033. The parent market is the Airport Ground Support Equipment (GSE) market, while the child market is specifically Apron Buses. The total market size is estimated to be xx Million units in 2025.
Apron Bus Market Market Dynamics & Structure
The Apron Bus Market is characterized by moderate concentration, with several key players vying for market share. Technological innovation, particularly in electric and hybrid propulsion systems, is a significant driver. Stringent emission regulations globally are also shaping the market, favoring the adoption of greener solutions. Competitive substitutes include smaller shuttle buses and vans; however, the specialized needs of airport operations provide a niche for larger-capacity apron buses. End-user demographics consist primarily of airports of varying sizes, airlines, and ground handling companies. M&A activity has been relatively limited in recent years but is expected to increase as larger companies consolidate market share.
- Market Concentration: Moderately concentrated, with top 5 players holding approximately xx% market share in 2025.
- Technological Innovation: Focus on electric, hybrid-electric, and fuel-efficient diesel engines.
- Regulatory Framework: Stricter emission standards globally driving adoption of electric and alternative fuel vehicles.
- Competitive Substitutes: Smaller shuttle buses and vans, but limited capacity presents a barrier to substitution for larger airports.
- End-User Demographics: Primarily large and medium-sized airports, airlines, and ground handling services.
- M&A Trends: Limited historically but predicted to increase with consolidation of the market during the forecast period with xx number of deals estimated by 2033.
Apron Bus Market Growth Trends & Insights
The Apron Bus market is experiencing significant growth driven by increasing passenger traffic at airports globally and growing awareness of environmental concerns in the aviation industry. Adoption rates of electric apron buses are rapidly increasing, driven by governmental incentives, decreasing battery costs and increasing range capabilities. The market is witnessing technological disruptions in the form of autonomous driving technology and advanced passenger comfort features. Shifting consumer preferences toward sustainable and eco-friendly transportation solutions are further contributing to market growth. The CAGR during the forecast period is projected to be xx%, while market penetration of electric apron buses is expected to reach xx% by 2033.
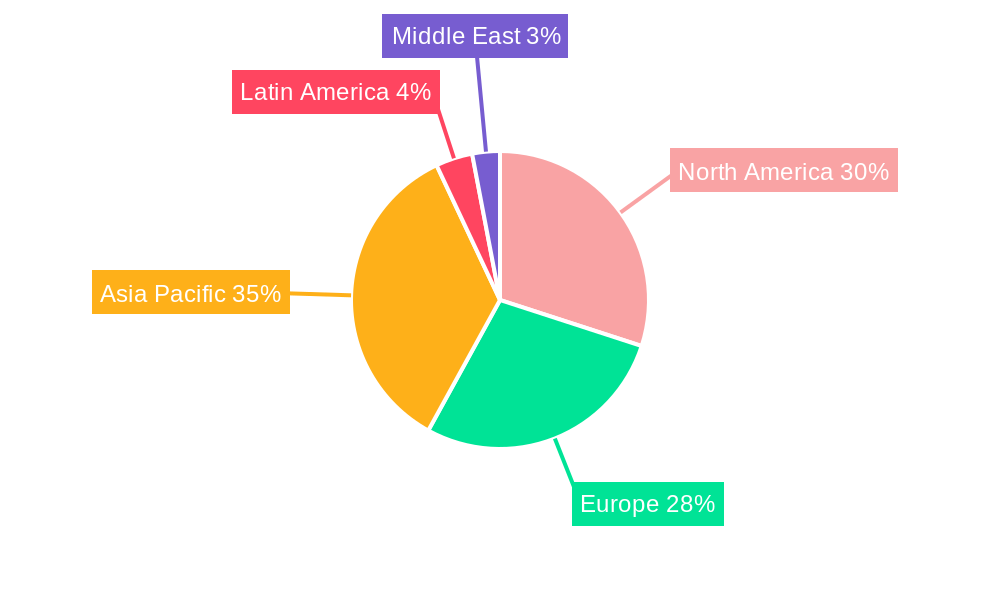
Dominant Regions, Countries, or Segments in Apron Bus Market
North America and Europe are currently the dominant regions in the Apron Bus market, driven by strong regulatory pressures, well-established airport infrastructure, and high adoption rates of electric buses. Within these regions, countries like the US, Germany, and the UK hold significant market share. The Electric segment is the fastest-growing type of Apron Bus, driven by environmental regulations and advancements in battery technology.
- Key Drivers (North America & Europe):
- Stringent emission regulations and incentives for electric vehicles.
- Well-developed airport infrastructure.
- High awareness of environmental sustainability.
- Government funding for green initiatives
- Dominance Factors:
- High airport density and passenger volume.
- Early adoption of electric vehicle technologies.
- Strong regulatory support for sustainable transportation.
Apron Bus Market Product Landscape
Apron buses are evolving beyond basic transportation to include features like advanced safety systems, enhanced passenger comfort (e.g., climate control, accessibility features), and improved fuel efficiency/reduced emissions. Electric apron buses are gaining traction due to their environmental benefits and potential for cost savings in the long run. Unique selling propositions include increased passenger capacity, improved maneuverability on airport aprons, and advanced safety features to minimize accidents and optimize operational efficiency.
Key Drivers, Barriers & Challenges in Apron Bus Market
Key Drivers: Growing air passenger traffic, stringent emission norms pushing for electric alternatives, advancements in battery technology enhancing range and performance, and government incentives for sustainable transportation.
Challenges: High initial investment costs for electric buses, limited charging infrastructure at some airports, and potential range anxiety concerns related to fully electric models. Supply chain disruptions can also impact production and delivery times, significantly impacting the market.
Emerging Opportunities in Apron Bus Market
Emerging opportunities lie in expanding into developing economies with growing air travel demand, developing autonomous driving capabilities for increased efficiency and safety, and exploring alternative fuel sources beyond electricity, such as hydrogen fuel cells. Furthermore, the integration of advanced passenger information systems and improved connectivity within the buses presents a significant opportunity for enhancing the passenger experience.
Growth Accelerators in the Apron Bus Market Industry
Technological advancements in battery technology, leading to increased range and reduced charging times, are accelerating market growth. Strategic partnerships between bus manufacturers, charging infrastructure providers, and airport operators are streamlining adoption. Expansion into emerging markets with growing air travel and government support for sustainable transportation initiatives will further fuel market growth.
Key Players Shaping the Apron Bus Market Market
Notable Milestones in Apron Bus Market Sector
- July 2023: Busnex launched the 'DinoBus', a fully electric airport apron bus with a range of up to 150 km and capacity for 120 passengers. This launch highlights the industry shift toward decarbonization.
- August 2023: LSP Plus Corporation secured a five-year contract for parking and shuttle operations at Eppley Airport (OMA), signifying increased demand for efficient ground transportation solutions.
In-Depth Apron Bus Market Market Outlook
The Apron Bus market is poised for sustained growth driven by the continued expansion of air travel, increasing environmental regulations, and ongoing technological advancements. Strategic partnerships and the development of innovative solutions, such as autonomous driving and alternative fuel options, will unlock new market opportunities. The market presents significant potential for companies that can adapt to changing technological landscapes and meet the evolving needs of airport operators and passengers.
Apron Bus Market Segmentation
- 1. Production Analysis
- 2. Consumption Analysis
- 3. Import Market Analysis (Value & Volume)
- 4. Export Market Analysis (Value & Volume)
- 5. Price Trend Analysis
Apron Bus Market Segmentation By Geography
-
1. North America
- 1.1. United States
- 1.2. Canada
- 1.3. Mexico
-
2. South America
- 2.1. Brazil
- 2.2. Argentina
- 2.3. Rest of South America
-
3. Europe
- 3.1. United Kingdom
- 3.2. Germany
- 3.3. France
- 3.4. Italy
- 3.5. Spain
- 3.6. Russia
- 3.7. Benelux
- 3.8. Nordics
- 3.9. Rest of Europe
-
4. Middle East & Africa
- 4.1. Turkey
- 4.2. Israel
- 4.3. GCC
- 4.4. North Africa
- 4.5. South Africa
- 4.6. Rest of Middle East & Africa
-
5. Asia Pacific
- 5.1. China
- 5.2. India
- 5.3. Japan
- 5.4. South Korea
- 5.5. ASEAN
- 5.6. Oceania
- 5.7. Rest of Asia Pacific
Apron Bus Market Regional Market Share
Geographic Coverage of Apron Bus Market
Apron Bus Market REPORT HIGHLIGHTS
| Aspects | Details |
|---|---|
| Study Period | 2020-2034 |
| Base Year | 2025 |
| Estimated Year | 2026 |
| Forecast Period | 2026-2034 |
| Historical Period | 2020-2025 |
| Growth Rate | CAGR of 10.77% from 2020-2034 |
| Segmentation |
|
Table of Contents
- 1. Introduction
- 1.1. Research Scope
- 1.2. Market Segmentation
- 1.3. Research Objective
- 1.4. Definitions and Assumptions
- 2. Executive Summary
- 2.1. Market Snapshot
- 3. Market Dynamics
- 3.1. Market Drivers
- 3.2. Market Restrains
- 3.3. Market Trends
- 3.4. Market Opportunities
- 4. Market Factor Analysis
- 4.1. Porters Five Forces
- 4.1.1. Bargaining Power of Suppliers
- 4.1.2. Bargaining Power of Buyers
- 4.1.3. Threat of New Entrants
- 4.1.4. Threat of Substitutes
- 4.1.5. Competitive Rivalry
- 4.2. PESTEL analysis
- 4.3. BCG Analysis
- 4.3.1. Stars (High Growth, High Market Share)
- 4.3.2. Cash Cows (Low Growth, High Market Share)
- 4.3.3. Question Mark (High Growth, Low Market Share)
- 4.3.4. Dogs (Low Growth, Low Market Share)
- 4.4. Ansoff Matrix Analysis
- 4.5. Supply Chain Analysis
- 4.6. Regulatory Landscape
- 4.7. Current Market Potential and Opportunity Assessment (TAM–SAM–SOM Framework)
- 4.8. VDR Analyst Note
- 4.1. Porters Five Forces
- 5. Market Analysis, Insights and Forecast 2021-2033
- 5.1. Market Analysis, Insights and Forecast - by Production Analysis
- 5.2. Market Analysis, Insights and Forecast - by Consumption Analysis
- 5.3. Market Analysis, Insights and Forecast - by Import Market Analysis (Value & Volume)
- 5.4. Market Analysis, Insights and Forecast - by Export Market Analysis (Value & Volume)
- 5.5. Market Analysis, Insights and Forecast - by Price Trend Analysis
- 5.6. Market Analysis, Insights and Forecast - by Region
- 5.6.1. North America
- 5.6.2. South America
- 5.6.3. Europe
- 5.6.4. Middle East & Africa
- 5.6.5. Asia Pacific
- 6. Global Apron Bus Market Analysis, Insights and Forecast, 2021-2033
- 6.1. Market Analysis, Insights and Forecast - by Production Analysis
- 6.2. Market Analysis, Insights and Forecast - by Consumption Analysis
- 6.3. Market Analysis, Insights and Forecast - by Import Market Analysis (Value & Volume)
- 6.4. Market Analysis, Insights and Forecast - by Export Market Analysis (Value & Volume)
- 6.5. Market Analysis, Insights and Forecast - by Price Trend Analysis
- 7. North America Apron Bus Market Analysis, Insights and Forecast, 2021-2033
- 7.1. Market Analysis, Insights and Forecast - by Production Analysis
- 7.2. Market Analysis, Insights and Forecast - by Consumption Analysis
- 7.3. Market Analysis, Insights and Forecast - by Import Market Analysis (Value & Volume)
- 7.4. Market Analysis, Insights and Forecast - by Export Market Analysis (Value & Volume)
- 7.5. Market Analysis, Insights and Forecast - by Price Trend Analysis
- 8. South America Apron Bus Market Analysis, Insights and Forecast, 2021-2033
- 8.1. Market Analysis, Insights and Forecast - by Production Analysis
- 8.2. Market Analysis, Insights and Forecast - by Consumption Analysis
- 8.3. Market Analysis, Insights and Forecast - by Import Market Analysis (Value & Volume)
- 8.4. Market Analysis, Insights and Forecast - by Export Market Analysis (Value & Volume)
- 8.5. Market Analysis, Insights and Forecast - by Price Trend Analysis
- 9. Europe Apron Bus Market Analysis, Insights and Forecast, 2021-2033
- 9.1. Market Analysis, Insights and Forecast - by Production Analysis
- 9.2. Market Analysis, Insights and Forecast - by Consumption Analysis
- 9.3. Market Analysis, Insights and Forecast - by Import Market Analysis (Value & Volume)
- 9.4. Market Analysis, Insights and Forecast - by Export Market Analysis (Value & Volume)
- 9.5. Market Analysis, Insights and Forecast - by Price Trend Analysis
- 10. Middle East & Africa Apron Bus Market Analysis, Insights and Forecast, 2021-2033
- 10.1. Market Analysis, Insights and Forecast - by Production Analysis
- 10.2. Market Analysis, Insights and Forecast - by Consumption Analysis
- 10.3. Market Analysis, Insights and Forecast - by Import Market Analysis (Value & Volume)
- 10.4. Market Analysis, Insights and Forecast - by Export Market Analysis (Value & Volume)
- 10.5. Market Analysis, Insights and Forecast - by Price Trend Analysis
- 11. Asia Pacific Apron Bus Market Analysis, Insights and Forecast, 2021-2033
- 11.1. Market Analysis, Insights and Forecast - by Production Analysis
- 11.2. Market Analysis, Insights and Forecast - by Consumption Analysis
- 11.3. Market Analysis, Insights and Forecast - by Import Market Analysis (Value & Volume)
- 11.4. Market Analysis, Insights and Forecast - by Export Market Analysis (Value & Volume)
- 11.5. Market Analysis, Insights and Forecast - by Price Trend Analysis
- 12. Competitive Analysis
- 12.1. Company Profiles
- 12.1.1 Mallaghan (G A ) In
- 12.1.1.1. Company Overview
- 12.1.1.2. Products
- 12.1.1.3. Company Financials
- 12.1.1.4. SWOT Analysis
- 12.1.2 Proterra Inc
- 12.1.2.1. Company Overview
- 12.1.2.2. Products
- 12.1.2.3. Company Financials
- 12.1.2.4. SWOT Analysis
- 12.1.3 Ashok Leyland
- 12.1.3.1. Company Overview
- 12.1.3.2. Products
- 12.1.3.3. Company Financials
- 12.1.3.4. SWOT Analysis
- 12.1.4 Yutong Bus Co Ltd
- 12.1.4.1. Company Overview
- 12.1.4.2. Products
- 12.1.4.3. Company Financials
- 12.1.4.4. SWOT Analysis
- 12.1.5 Solaris Bus & Coach sp z o o
- 12.1.5.1. Company Overview
- 12.1.5.2. Products
- 12.1.5.3. Company Financials
- 12.1.5.4. SWOT Analysis
- 12.1.6 Xiamen King Long International Trading Co Ltd
- 12.1.6.1. Company Overview
- 12.1.6.2. Products
- 12.1.6.3. Company Financials
- 12.1.6.4. SWOT Analysis
- 12.1.7 TAM - EUROPE
- 12.1.7.1. Company Overview
- 12.1.7.2. Products
- 12.1.7.3. Company Financials
- 12.1.7.4. SWOT Analysis
- 12.1.8 AB Volvo (Volvo Group)
- 12.1.8.1. Company Overview
- 12.1.8.2. Products
- 12.1.8.3. Company Financials
- 12.1.8.4. SWOT Analysis
- 12.1.9 COBUS Industries GmbH
- 12.1.9.1. Company Overview
- 12.1.9.2. Products
- 12.1.9.3. Company Financials
- 12.1.9.4. SWOT Analysis
- 12.1.10 BYD Company Ltd
- 12.1.10.1. Company Overview
- 12.1.10.2. Products
- 12.1.10.3. Company Financials
- 12.1.10.4. SWOT Analysis
- 12.1.11 Xinfa Airport Equipment Ltd
- 12.1.11.1. Company Overview
- 12.1.11.2. Products
- 12.1.11.3. Company Financials
- 12.1.11.4. SWOT Analysis
- 12.1.1 Mallaghan (G A ) In
- 12.2. Market Entropy
- 12.2.1 Company's Key Areas Served
- 12.2.2 Recent Developments
- 12.3. Company Market Share Analysis 2025
- 12.3.1 Top 5 Companies Market Share Analysis
- 12.3.2 Top 3 Companies Market Share Analysis
- 12.4. List of Potential Customers
- 13. Research Methodology
List of Figures
- Figure 1: Global Apron Bus Market Revenue Breakdown (million, %) by Region 2025 & 2033
- Figure 2: North America Apron Bus Market Revenue (million), by Production Analysis 2025 & 2033
- Figure 3: North America Apron Bus Market Revenue Share (%), by Production Analysis 2025 & 2033
- Figure 4: North America Apron Bus Market Revenue (million), by Consumption Analysis 2025 & 2033
- Figure 5: North America Apron Bus Market Revenue Share (%), by Consumption Analysis 2025 & 2033
- Figure 6: North America Apron Bus Market Revenue (million), by Import Market Analysis (Value & Volume) 2025 & 2033
- Figure 7: North America Apron Bus Market Revenue Share (%), by Import Market Analysis (Value & Volume) 2025 & 2033
- Figure 8: North America Apron Bus Market Revenue (million), by Export Market Analysis (Value & Volume) 2025 & 2033
- Figure 9: North America Apron Bus Market Revenue Share (%), by Export Market Analysis (Value & Volume) 2025 & 2033
- Figure 10: North America Apron Bus Market Revenue (million), by Price Trend Analysis 2025 & 2033
- Figure 11: North America Apron Bus Market Revenue Share (%), by Price Trend Analysis 2025 & 2033
- Figure 12: North America Apron Bus Market Revenue (million), by Country 2025 & 2033
- Figure 13: North America Apron Bus Market Revenue Share (%), by Country 2025 & 2033
- Figure 14: South America Apron Bus Market Revenue (million), by Production Analysis 2025 & 2033
- Figure 15: South America Apron Bus Market Revenue Share (%), by Production Analysis 2025 & 2033
- Figure 16: South America Apron Bus Market Revenue (million), by Consumption Analysis 2025 & 2033
- Figure 17: South America Apron Bus Market Revenue Share (%), by Consumption Analysis 2025 & 2033
- Figure 18: South America Apron Bus Market Revenue (million), by Import Market Analysis (Value & Volume) 2025 & 2033
- Figure 19: South America Apron Bus Market Revenue Share (%), by Import Market Analysis (Value & Volume) 2025 & 2033
- Figure 20: South America Apron Bus Market Revenue (million), by Export Market Analysis (Value & Volume) 2025 & 2033
- Figure 21: South America Apron Bus Market Revenue Share (%), by Export Market Analysis (Value & Volume) 2025 & 2033
- Figure 22: South America Apron Bus Market Revenue (million), by Price Trend Analysis 2025 & 2033
- Figure 23: South America Apron Bus Market Revenue Share (%), by Price Trend Analysis 2025 & 2033
- Figure 24: South America Apron Bus Market Revenue (million), by Country 2025 & 2033
- Figure 25: South America Apron Bus Market Revenue Share (%), by Country 2025 & 2033
- Figure 26: Europe Apron Bus Market Revenue (million), by Production Analysis 2025 & 2033
- Figure 27: Europe Apron Bus Market Revenue Share (%), by Production Analysis 2025 & 2033
- Figure 28: Europe Apron Bus Market Revenue (million), by Consumption Analysis 2025 & 2033
- Figure 29: Europe Apron Bus Market Revenue Share (%), by Consumption Analysis 2025 & 2033
- Figure 30: Europe Apron Bus Market Revenue (million), by Import Market Analysis (Value & Volume) 2025 & 2033
- Figure 31: Europe Apron Bus Market Revenue Share (%), by Import Market Analysis (Value & Volume) 2025 & 2033
- Figure 32: Europe Apron Bus Market Revenue (million), by Export Market Analysis (Value & Volume) 2025 & 2033
- Figure 33: Europe Apron Bus Market Revenue Share (%), by Export Market Analysis (Value & Volume) 2025 & 2033
- Figure 34: Europe Apron Bus Market Revenue (million), by Price Trend Analysis 2025 & 2033
- Figure 35: Europe Apron Bus Market Revenue Share (%), by Price Trend Analysis 2025 & 2033
- Figure 36: Europe Apron Bus Market Revenue (million), by Country 2025 & 2033
- Figure 37: Europe Apron Bus Market Revenue Share (%), by Country 2025 & 2033
- Figure 38: Middle East & Africa Apron Bus Market Revenue (million), by Production Analysis 2025 & 2033
- Figure 39: Middle East & Africa Apron Bus Market Revenue Share (%), by Production Analysis 2025 & 2033
- Figure 40: Middle East & Africa Apron Bus Market Revenue (million), by Consumption Analysis 2025 & 2033
- Figure 41: Middle East & Africa Apron Bus Market Revenue Share (%), by Consumption Analysis 2025 & 2033
- Figure 42: Middle East & Africa Apron Bus Market Revenue (million), by Import Market Analysis (Value & Volume) 2025 & 2033
- Figure 43: Middle East & Africa Apron Bus Market Revenue Share (%), by Import Market Analysis (Value & Volume) 2025 & 2033
- Figure 44: Middle East & Africa Apron Bus Market Revenue (million), by Export Market Analysis (Value & Volume) 2025 & 2033
- Figure 45: Middle East & Africa Apron Bus Market Revenue Share (%), by Export Market Analysis (Value & Volume) 2025 & 2033
- Figure 46: Middle East & Africa Apron Bus Market Revenue (million), by Price Trend Analysis 2025 & 2033
- Figure 47: Middle East & Africa Apron Bus Market Revenue Share (%), by Price Trend Analysis 2025 & 2033
- Figure 48: Middle East & Africa Apron Bus Market Revenue (million), by Country 2025 & 2033
- Figure 49: Middle East & Africa Apron Bus Market Revenue Share (%), by Country 2025 & 2033
- Figure 50: Asia Pacific Apron Bus Market Revenue (million), by Production Analysis 2025 & 2033
- Figure 51: Asia Pacific Apron Bus Market Revenue Share (%), by Production Analysis 2025 & 2033
- Figure 52: Asia Pacific Apron Bus Market Revenue (million), by Consumption Analysis 2025 & 2033
- Figure 53: Asia Pacific Apron Bus Market Revenue Share (%), by Consumption Analysis 2025 & 2033
- Figure 54: Asia Pacific Apron Bus Market Revenue (million), by Import Market Analysis (Value & Volume) 2025 & 2033
- Figure 55: Asia Pacific Apron Bus Market Revenue Share (%), by Import Market Analysis (Value & Volume) 2025 & 2033
- Figure 56: Asia Pacific Apron Bus Market Revenue (million), by Export Market Analysis (Value & Volume) 2025 & 2033
- Figure 57: Asia Pacific Apron Bus Market Revenue Share (%), by Export Market Analysis (Value & Volume) 2025 & 2033
- Figure 58: Asia Pacific Apron Bus Market Revenue (million), by Price Trend Analysis 2025 & 2033
- Figure 59: Asia Pacific Apron Bus Market Revenue Share (%), by Price Trend Analysis 2025 & 2033
- Figure 60: Asia Pacific Apron Bus Market Revenue (million), by Country 2025 & 2033
- Figure 61: Asia Pacific Apron Bus Market Revenue Share (%), by Country 2025 & 2033
List of Tables
- Table 1: Global Apron Bus Market Revenue million Forecast, by Production Analysis 2020 & 2033
- Table 2: Global Apron Bus Market Revenue million Forecast, by Consumption Analysis 2020 & 2033
- Table 3: Global Apron Bus Market Revenue million Forecast, by Import Market Analysis (Value & Volume) 2020 & 2033
- Table 4: Global Apron Bus Market Revenue million Forecast, by Export Market Analysis (Value & Volume) 2020 & 2033
- Table 5: Global Apron Bus Market Revenue million Forecast, by Price Trend Analysis 2020 & 2033
- Table 6: Global Apron Bus Market Revenue million Forecast, by Region 2020 & 2033
- Table 7: Global Apron Bus Market Revenue million Forecast, by Production Analysis 2020 & 2033
- Table 8: Global Apron Bus Market Revenue million Forecast, by Consumption Analysis 2020 & 2033
- Table 9: Global Apron Bus Market Revenue million Forecast, by Import Market Analysis (Value & Volume) 2020 & 2033
- Table 10: Global Apron Bus Market Revenue million Forecast, by Export Market Analysis (Value & Volume) 2020 & 2033
- Table 11: Global Apron Bus Market Revenue million Forecast, by Price Trend Analysis 2020 & 2033
- Table 12: Global Apron Bus Market Revenue million Forecast, by Country 2020 & 2033
- Table 13: United States Apron Bus Market Revenue (million) Forecast, by Application 2020 & 2033
- Table 14: Canada Apron Bus Market Revenue (million) Forecast, by Application 2020 & 2033
- Table 15: Mexico Apron Bus Market Revenue (million) Forecast, by Application 2020 & 2033
- Table 16: Global Apron Bus Market Revenue million Forecast, by Production Analysis 2020 & 2033
- Table 17: Global Apron Bus Market Revenue million Forecast, by Consumption Analysis 2020 & 2033
- Table 18: Global Apron Bus Market Revenue million Forecast, by Import Market Analysis (Value & Volume) 2020 & 2033
- Table 19: Global Apron Bus Market Revenue million Forecast, by Export Market Analysis (Value & Volume) 2020 & 2033
- Table 20: Global Apron Bus Market Revenue million Forecast, by Price Trend Analysis 2020 & 2033
- Table 21: Global Apron Bus Market Revenue million Forecast, by Country 2020 & 2033
- Table 22: Brazil Apron Bus Market Revenue (million) Forecast, by Application 2020 & 2033
- Table 23: Argentina Apron Bus Market Revenue (million) Forecast, by Application 2020 & 2033
- Table 24: Rest of South America Apron Bus Market Revenue (million) Forecast, by Application 2020 & 2033
- Table 25: Global Apron Bus Market Revenue million Forecast, by Production Analysis 2020 & 2033
- Table 26: Global Apron Bus Market Revenue million Forecast, by Consumption Analysis 2020 & 2033
- Table 27: Global Apron Bus Market Revenue million Forecast, by Import Market Analysis (Value & Volume) 2020 & 2033
- Table 28: Global Apron Bus Market Revenue million Forecast, by Export Market Analysis (Value & Volume) 2020 & 2033
- Table 29: Global Apron Bus Market Revenue million Forecast, by Price Trend Analysis 2020 & 2033
- Table 30: Global Apron Bus Market Revenue million Forecast, by Country 2020 & 2033
- Table 31: United Kingdom Apron Bus Market Revenue (million) Forecast, by Application 2020 & 2033
- Table 32: Germany Apron Bus Market Revenue (million) Forecast, by Application 2020 & 2033
- Table 33: France Apron Bus Market Revenue (million) Forecast, by Application 2020 & 2033
- Table 34: Italy Apron Bus Market Revenue (million) Forecast, by Application 2020 & 2033
- Table 35: Spain Apron Bus Market Revenue (million) Forecast, by Application 2020 & 2033
- Table 36: Russia Apron Bus Market Revenue (million) Forecast, by Application 2020 & 2033
- Table 37: Benelux Apron Bus Market Revenue (million) Forecast, by Application 2020 & 2033
- Table 38: Nordics Apron Bus Market Revenue (million) Forecast, by Application 2020 & 2033
- Table 39: Rest of Europe Apron Bus Market Revenue (million) Forecast, by Application 2020 & 2033
- Table 40: Global Apron Bus Market Revenue million Forecast, by Production Analysis 2020 & 2033
- Table 41: Global Apron Bus Market Revenue million Forecast, by Consumption Analysis 2020 & 2033
- Table 42: Global Apron Bus Market Revenue million Forecast, by Import Market Analysis (Value & Volume) 2020 & 2033
- Table 43: Global Apron Bus Market Revenue million Forecast, by Export Market Analysis (Value & Volume) 2020 & 2033
- Table 44: Global Apron Bus Market Revenue million Forecast, by Price Trend Analysis 2020 & 2033
- Table 45: Global Apron Bus Market Revenue million Forecast, by Country 2020 & 2033
- Table 46: Turkey Apron Bus Market Revenue (million) Forecast, by Application 2020 & 2033
- Table 47: Israel Apron Bus Market Revenue (million) Forecast, by Application 2020 & 2033
- Table 48: GCC Apron Bus Market Revenue (million) Forecast, by Application 2020 & 2033
- Table 49: North Africa Apron Bus Market Revenue (million) Forecast, by Application 2020 & 2033
- Table 50: South Africa Apron Bus Market Revenue (million) Forecast, by Application 2020 & 2033
- Table 51: Rest of Middle East & Africa Apron Bus Market Revenue (million) Forecast, by Application 2020 & 2033
- Table 52: Global Apron Bus Market Revenue million Forecast, by Production Analysis 2020 & 2033
- Table 53: Global Apron Bus Market Revenue million Forecast, by Consumption Analysis 2020 & 2033
- Table 54: Global Apron Bus Market Revenue million Forecast, by Import Market Analysis (Value & Volume) 2020 & 2033
- Table 55: Global Apron Bus Market Revenue million Forecast, by Export Market Analysis (Value & Volume) 2020 & 2033
- Table 56: Global Apron Bus Market Revenue million Forecast, by Price Trend Analysis 2020 & 2033
- Table 57: Global Apron Bus Market Revenue million Forecast, by Country 2020 & 2033
- Table 58: China Apron Bus Market Revenue (million) Forecast, by Application 2020 & 2033
- Table 59: India Apron Bus Market Revenue (million) Forecast, by Application 2020 & 2033
- Table 60: Japan Apron Bus Market Revenue (million) Forecast, by Application 2020 & 2033
- Table 61: South Korea Apron Bus Market Revenue (million) Forecast, by Application 2020 & 2033
- Table 62: ASEAN Apron Bus Market Revenue (million) Forecast, by Application 2020 & 2033
- Table 63: Oceania Apron Bus Market Revenue (million) Forecast, by Application 2020 & 2033
- Table 64: Rest of Asia Pacific Apron Bus Market Revenue (million) Forecast, by Application 2020 & 2033
Frequently Asked Questions
1. What is the projected Compound Annual Growth Rate (CAGR) of the Apron Bus Market?
The projected CAGR is approximately 10.77%.
2. Which companies are prominent players in the Apron Bus Market?
Key companies in the market include Mallaghan (G A ) In, Proterra Inc, Ashok Leyland, Yutong Bus Co Ltd, Solaris Bus & Coach sp z o o, Xiamen King Long International Trading Co Ltd, TAM - EUROPE, AB Volvo (Volvo Group), COBUS Industries GmbH, BYD Company Ltd, Xinfa Airport Equipment Ltd.
3. What are the main segments of the Apron Bus Market?
The market segments include Production Analysis, Consumption Analysis, Import Market Analysis (Value & Volume), Export Market Analysis (Value & Volume), Price Trend Analysis.
4. Can you provide details about the market size?
The market size is estimated to be USD 551.61 million as of 2022.
5. What are some drivers contributing to market growth?
Increase in Internet of Things (IoT) and Autonomous Systems; Rise in Demand for Military and Defense Satellite Communication Solutions.
6. What are the notable trends driving market growth?
Electric Segment is Expected to Show Significant Growth During the Forecast Period.
7. Are there any restraints impacting market growth?
Cybersecurity Threats to Satellite Communication; Interference in Transmission of Data.
8. Can you provide examples of recent developments in the market?
August 2023: LSP Plus Corporation Announced a Five-Year Parking and Shuttle Operations Contract for the management of all public and employee parking facilities and public and employee shuttle service at Eppley Airport (OMA), US.
9. What pricing options are available for accessing the report?
Pricing options include single-user, multi-user, and enterprise licenses priced at USD 4750, USD 5250, and USD 8750 respectively.
10. Is the market size provided in terms of value or volume?
The market size is provided in terms of value, measured in million.
11. Are there any specific market keywords associated with the report?
Yes, the market keyword associated with the report is "Apron Bus Market," which aids in identifying and referencing the specific market segment covered.
12. How do I determine which pricing option suits my needs best?
The pricing options vary based on user requirements and access needs. Individual users may opt for single-user licenses, while businesses requiring broader access may choose multi-user or enterprise licenses for cost-effective access to the report.
13. Are there any additional resources or data provided in the Apron Bus Market report?
While the report offers comprehensive insights, it's advisable to review the specific contents or supplementary materials provided to ascertain if additional resources or data are available.
14. How can I stay updated on further developments or reports in the Apron Bus Market?
To stay informed about further developments, trends, and reports in the Apron Bus Market, consider subscribing to industry newsletters, following relevant companies and organizations, or regularly checking reputable industry news sources and publications.
Methodology
Step 1 - Identification of Relevant Samples Size from Population Database


Step 2 - Approaches for Defining Global Market Size (Value, Volume* & Price*)

Note*: In applicable scenarios
Step 3 - Data Sources
Primary Research
- Web Analytics
- Survey Reports
- Research Institute
- Latest Research Reports
- Opinion Leaders
Secondary Research
- Annual Reports
- White Paper
- Latest Press Release
- Industry Association
- Paid Database
- Investor Presentations

Step 4 - Data Triangulation
Involves using different sources of information in order to increase the validity of a study
These sources are likely to be stakeholders in a program - participants, other researchers, program staff, other community members, and so on.
Then we put all data in single framework & apply various statistical tools to find out the dynamic on the market.
During the analysis stage, feedback from the stakeholder groups would be compared to determine areas of agreement as well as areas of divergence