

Key Insights
The global satellite bus market is experiencing robust growth, driven by increasing demand for satellite-based communication, navigation, and earth observation services. A compound annual growth rate (CAGR) of 6.87% from 2019 to 2033 indicates a significant expansion, projected to reach a substantial market value. Several factors contribute to this growth, including advancements in miniaturization and cost reduction of satellite components, leading to a proliferation of smaller, more affordable satellites. The rise of the NewSpace industry, with its focus on innovative technologies and business models, is further fueling market expansion. The increasing adoption of satellite-based internet services (e.g., LEO constellations) is a key driver, along with the growing need for reliable communication infrastructure in remote areas and developing nations. Furthermore, government investments in national security and defense applications are significantly impacting market growth. Segmentation reveals a strong demand across various application areas, with communication and earth observation holding considerable market share. Similarly, the market is diverse in terms of satellite mass, with segments like 10-100kg and 100-500kg showing high growth potential driven by the increasing popularity of CubeSats and small satellites. GEO, LEO, and MEO orbit classes all play important roles, catering to distinct application needs. Major players such as NEC, Honeywell, Lockheed Martin, Airbus, and others are actively shaping market dynamics through innovation and competitive strategies.
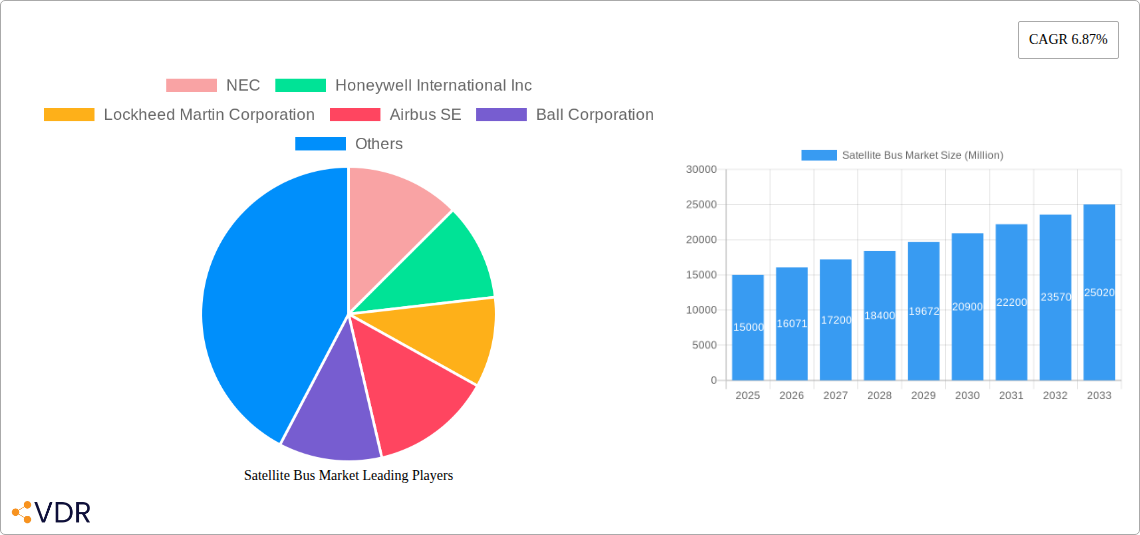
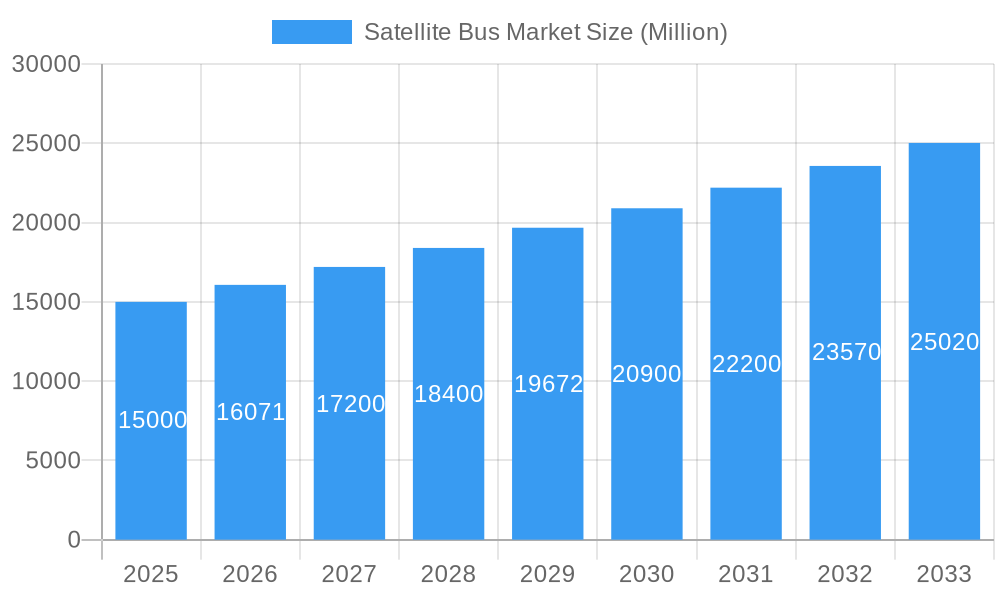
Satellite Bus Market Market Size (In Billion)
The market's future growth trajectory will be influenced by technological advancements like improved propulsion systems, AI-driven satellite operations, and the development of more resilient and sustainable space infrastructure. However, regulatory hurdles, launch costs, and the complexities of space operations pose challenges to market expansion. Despite these restraints, the long-term outlook for the satellite bus market remains positive, with continued growth expected across various segments and geographical regions. The commercial sector is anticipated to remain the dominant end-user segment, driven by the increasing demand for commercial satellite services. Continued innovation and collaboration between government agencies and private companies will be critical to unlocking the full potential of the satellite bus market.
Satellite Bus Market Company Market Share
This comprehensive report provides an in-depth analysis of the global Satellite Bus Market, encompassing market dynamics, growth trends, regional dominance, product landscape, key challenges, emerging opportunities, and prominent players. The report covers the historical period (2019-2024), base year (2025), and forecast period (2025-2033), offering valuable insights for industry professionals, investors, and stakeholders. The total market size in 2025 is estimated at xx Million units.
Satellite Bus Market Dynamics & Structure
The Satellite Bus market, a critical sub-segment of the larger Spacecraft and Satellite industry, is characterized by moderate concentration, with key players holding significant market share. Technological innovation, particularly in miniaturization, propulsion systems, and improved communication capabilities, is a primary growth driver. Stringent regulatory frameworks governing satellite launches and operations influence market dynamics, alongside the emergence of competitive product substitutes. The end-user landscape is diverse, encompassing commercial, military & government, and other sectors. M&A activity within the satellite industry has been steadily increasing, with an estimated xx deals in 2024, consolidating market power and driving innovation.
- Market Concentration: Moderately concentrated, with top 5 players holding approximately xx% market share in 2024.
- Technological Innovation: Miniaturization, advanced propulsion, and improved communication systems are key drivers.
- Regulatory Frameworks: Stringent regulations on launches and operations impact market access and growth.
- Competitive Substitutes: Emerging technologies and alternative approaches pose a moderate competitive threat.
- M&A Activity: An estimated xx M&A deals in 2024, contributing to market consolidation.
- End-User Demographics: Commercial sector dominates, followed by military & government and other applications.
Satellite Bus Market Growth Trends & Insights
The Satellite Bus market is experiencing robust growth, driven by increasing demand for satellite-based services across various sectors. The market size is projected to reach xx Million units by 2033, exhibiting a CAGR of xx% during the forecast period (2025-2033). This growth is fueled by technological advancements, declining launch costs, and the expanding adoption of smaller, more cost-effective satellite buses. The shift towards constellations of small satellites is also significantly influencing market dynamics. Consumer behavior shifts towards greater reliance on satellite-based communication and data services are further bolstering growth. The increasing adoption of LEO satellites is also a significant factor in this growth, with an expected xx% market share by 2033.
Dominant Regions, Countries, or Segments in Satellite Bus Market
North America currently dominates the Satellite Bus market, driven by strong government support, substantial investments in space exploration and defense programs, and a highly developed commercial space industry. However, the Asia-Pacific region is projected to witness the fastest growth rate during the forecast period, fueled by increasing government investment in satellite technology and expanding telecommunication infrastructure. Within application segments, communication satellites hold the largest market share, while the LEO orbit class demonstrates the highest growth potential.
- Leading Region: North America (xx% market share in 2024)
- Fastest-Growing Region: Asia-Pacific (projected CAGR of xx% during 2025-2033)
- Largest Application Segment: Communication (xx% market share in 2024)
- Highest Growth Potential Orbit Class: LEO (projected CAGR of xx% during 2025-2033)
- Key Growth Drivers: Government initiatives, technological advancements, increasing demand for satellite data.
Satellite Bus Market Product Landscape
The Satellite Bus market features a diverse range of products catering to varied mission requirements and orbital characteristics. Innovations focus on miniaturization, increased payload capacity, improved power efficiency, and enhanced communication capabilities. Many offerings now incorporate advanced features such as onboard processing, autonomous navigation, and flexible modular designs. Key selling propositions include cost-effectiveness, adaptability, and reduced launch mass.
Key Drivers, Barriers & Challenges in Satellite Bus Market
Key Drivers:
- Technological advancements: miniaturization, improved propulsion, and advanced communication systems.
- Government initiatives and funding: increased investment in space exploration and national security.
- Expanding demand for satellite-based services: across communication, Earth observation, and navigation.
Key Challenges & Restraints:
- High initial investment costs: limiting entry for smaller players.
- Stringent regulatory approvals: extending timelines and increasing complexity.
- Supply chain disruptions: impacting production and delivery schedules (estimated xx% impact in 2024).
Emerging Opportunities in Satellite Bus Market
- Growth of the NewSpace industry: fostering innovation and creating new market opportunities.
- Expansion of satellite constellations: increasing demand for smaller, more cost-effective buses.
- Advancements in AI and machine learning: enabling autonomous operations and enhanced data analysis.
- Development of novel applications: across various sectors, including IoT, environmental monitoring, and precision agriculture.
Growth Accelerators in the Satellite Bus Market Industry
Strategic partnerships between satellite manufacturers, launch providers, and end-users are accelerating market growth. Technological breakthroughs in areas such as propulsion and power systems are also contributing to improved satellite performance and reduced costs. Furthermore, the expansion of global telecommunications infrastructure and the growing demand for satellite-based data services are further stimulating market growth.
Key Players Shaping the Satellite Bus Market Market
Notable Milestones in Satellite Bus Market Sector
- October 2020: NanoAvionics expands UK operations, boosting AIT capabilities and R&D.
- August 2020: Sierra Nevada Corporation introduces SN-200M and SN-1000 satellite platforms.
- July 2020: SNC awarded contract by DIU for repurposing Shooting Star transport vehicle.
In-Depth Satellite Bus Market Market Outlook
The Satellite Bus market is poised for significant growth, driven by continued technological advancements, expanding applications, and increasing demand for satellite-based services. Strategic partnerships, innovative business models, and a focus on cost-effectiveness will be crucial for success. The market's future growth potential is substantial, presenting attractive opportunities for both established players and new entrants. The market is expected to see a significant increase in demand for smallsat buses in the coming years, particularly within the LEO and MEO orbital classes.
Satellite Bus Market Segmentation
-
1. Application
- 1.1. Communication
- 1.2. Earth Observation
- 1.3. Navigation
- 1.4. Space Observation
- 1.5. Others
-
2. Satellite Mass
- 2.1. 10-100kg
- 2.2. 100-500kg
- 2.3. 500-1000kg
- 2.4. Below 10 Kg
- 2.5. above 1000kg
-
3. Orbit Class
- 3.1. GEO
- 3.2. LEO
- 3.3. MEO
-
4. End User
- 4.1. Commercial
- 4.2. Military & Government
- 4.3. Other
Satellite Bus Market Segmentation By Geography
-
1. North America
- 1.1. United States
- 1.2. Canada
- 1.3. Mexico
-
2. South America
- 2.1. Brazil
- 2.2. Argentina
- 2.3. Rest of South America
-
3. Europe
- 3.1. United Kingdom
- 3.2. Germany
- 3.3. France
- 3.4. Italy
- 3.5. Spain
- 3.6. Russia
- 3.7. Benelux
- 3.8. Nordics
- 3.9. Rest of Europe
-
4. Middle East & Africa
- 4.1. Turkey
- 4.2. Israel
- 4.3. GCC
- 4.4. North Africa
- 4.5. South Africa
- 4.6. Rest of Middle East & Africa
-
5. Asia Pacific
- 5.1. China
- 5.2. India
- 5.3. Japan
- 5.4. South Korea
- 5.5. ASEAN
- 5.6. Oceania
- 5.7. Rest of Asia Pacific
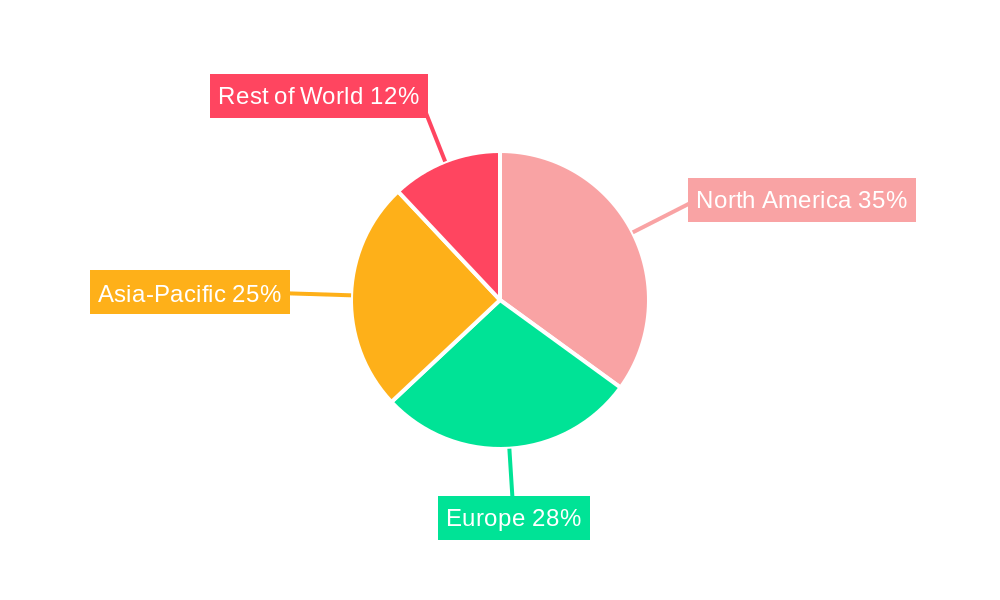
Satellite Bus Market Regional Market Share
Geographic Coverage of Satellite Bus Market
Satellite Bus Market REPORT HIGHLIGHTS
| Aspects | Details |
|---|---|
| Study Period | 2020-2034 |
| Base Year | 2025 |
| Estimated Year | 2026 |
| Forecast Period | 2026-2034 |
| Historical Period | 2020-2025 |
| Growth Rate | CAGR of 8.25% from 2020-2034 |
| Segmentation |
|
Table of Contents
- 1. Introduction
- 1.1. Research Scope
- 1.2. Market Segmentation
- 1.3. Research Objective
- 1.4. Definitions and Assumptions
- 2. Executive Summary
- 2.1. Market Snapshot
- 3. Market Dynamics
- 3.1. Market Drivers
- 3.2. Market Restrains
- 3.3. Market Trends
- 3.4. Market Opportunities
- 4. Market Factor Analysis
- 4.1. Porters Five Forces
- 4.1.1. Bargaining Power of Suppliers
- 4.1.2. Bargaining Power of Buyers
- 4.1.3. Threat of New Entrants
- 4.1.4. Threat of Substitutes
- 4.1.5. Competitive Rivalry
- 4.2. PESTEL analysis
- 4.3. BCG Analysis
- 4.3.1. Stars (High Growth, High Market Share)
- 4.3.2. Cash Cows (Low Growth, High Market Share)
- 4.3.3. Question Mark (High Growth, Low Market Share)
- 4.3.4. Dogs (Low Growth, Low Market Share)
- 4.4. Ansoff Matrix Analysis
- 4.5. Supply Chain Analysis
- 4.6. Regulatory Landscape
- 4.7. Current Market Potential and Opportunity Assessment (TAM–SAM–SOM Framework)
- 4.8. VDR Analyst Note
- 4.1. Porters Five Forces
- 5. Market Analysis, Insights and Forecast 2021-2033
- 5.1. Market Analysis, Insights and Forecast - by Application
- 5.1.1. Communication
- 5.1.2. Earth Observation
- 5.1.3. Navigation
- 5.1.4. Space Observation
- 5.1.5. Others
- 5.2. Market Analysis, Insights and Forecast - by Satellite Mass
- 5.2.1. 10-100kg
- 5.2.2. 100-500kg
- 5.2.3. 500-1000kg
- 5.2.4. Below 10 Kg
- 5.2.5. above 1000kg
- 5.3. Market Analysis, Insights and Forecast - by Orbit Class
- 5.3.1. GEO
- 5.3.2. LEO
- 5.3.3. MEO
- 5.4. Market Analysis, Insights and Forecast - by End User
- 5.4.1. Commercial
- 5.4.2. Military & Government
- 5.4.3. Other
- 5.5. Market Analysis, Insights and Forecast - by Region
- 5.5.1. North America
- 5.5.2. South America
- 5.5.3. Europe
- 5.5.4. Middle East & Africa
- 5.5.5. Asia Pacific
- 5.1. Market Analysis, Insights and Forecast - by Application
- 6. Global Satellite Bus Market Analysis, Insights and Forecast, 2021-2033
- 6.1. Market Analysis, Insights and Forecast - by Application
- 6.1.1. Communication
- 6.1.2. Earth Observation
- 6.1.3. Navigation
- 6.1.4. Space Observation
- 6.1.5. Others
- 6.2. Market Analysis, Insights and Forecast - by Satellite Mass
- 6.2.1. 10-100kg
- 6.2.2. 100-500kg
- 6.2.3. 500-1000kg
- 6.2.4. Below 10 Kg
- 6.2.5. above 1000kg
- 6.3. Market Analysis, Insights and Forecast - by Orbit Class
- 6.3.1. GEO
- 6.3.2. LEO
- 6.3.3. MEO
- 6.4. Market Analysis, Insights and Forecast - by End User
- 6.4.1. Commercial
- 6.4.2. Military & Government
- 6.4.3. Other
- 6.1. Market Analysis, Insights and Forecast - by Application
- 7. North America Satellite Bus Market Analysis, Insights and Forecast, 2021-2033
- 7.1. Market Analysis, Insights and Forecast - by Application
- 7.1.1. Communication
- 7.1.2. Earth Observation
- 7.1.3. Navigation
- 7.1.4. Space Observation
- 7.1.5. Others
- 7.2. Market Analysis, Insights and Forecast - by Satellite Mass
- 7.2.1. 10-100kg
- 7.2.2. 100-500kg
- 7.2.3. 500-1000kg
- 7.2.4. Below 10 Kg
- 7.2.5. above 1000kg
- 7.3. Market Analysis, Insights and Forecast - by Orbit Class
- 7.3.1. GEO
- 7.3.2. LEO
- 7.3.3. MEO
- 7.4. Market Analysis, Insights and Forecast - by End User
- 7.4.1. Commercial
- 7.4.2. Military & Government
- 7.4.3. Other
- 7.1. Market Analysis, Insights and Forecast - by Application
- 8. South America Satellite Bus Market Analysis, Insights and Forecast, 2021-2033
- 8.1. Market Analysis, Insights and Forecast - by Application
- 8.1.1. Communication
- 8.1.2. Earth Observation
- 8.1.3. Navigation
- 8.1.4. Space Observation
- 8.1.5. Others
- 8.2. Market Analysis, Insights and Forecast - by Satellite Mass
- 8.2.1. 10-100kg
- 8.2.2. 100-500kg
- 8.2.3. 500-1000kg
- 8.2.4. Below 10 Kg
- 8.2.5. above 1000kg
- 8.3. Market Analysis, Insights and Forecast - by Orbit Class
- 8.3.1. GEO
- 8.3.2. LEO
- 8.3.3. MEO
- 8.4. Market Analysis, Insights and Forecast - by End User
- 8.4.1. Commercial
- 8.4.2. Military & Government
- 8.4.3. Other
- 8.1. Market Analysis, Insights and Forecast - by Application
- 9. Europe Satellite Bus Market Analysis, Insights and Forecast, 2021-2033
- 9.1. Market Analysis, Insights and Forecast - by Application
- 9.1.1. Communication
- 9.1.2. Earth Observation
- 9.1.3. Navigation
- 9.1.4. Space Observation
- 9.1.5. Others
- 9.2. Market Analysis, Insights and Forecast - by Satellite Mass
- 9.2.1. 10-100kg
- 9.2.2. 100-500kg
- 9.2.3. 500-1000kg
- 9.2.4. Below 10 Kg
- 9.2.5. above 1000kg
- 9.3. Market Analysis, Insights and Forecast - by Orbit Class
- 9.3.1. GEO
- 9.3.2. LEO
- 9.3.3. MEO
- 9.4. Market Analysis, Insights and Forecast - by End User
- 9.4.1. Commercial
- 9.4.2. Military & Government
- 9.4.3. Other
- 9.1. Market Analysis, Insights and Forecast - by Application
- 10. Middle East & Africa Satellite Bus Market Analysis, Insights and Forecast, 2021-2033
- 10.1. Market Analysis, Insights and Forecast - by Application
- 10.1.1. Communication
- 10.1.2. Earth Observation
- 10.1.3. Navigation
- 10.1.4. Space Observation
- 10.1.5. Others
- 10.2. Market Analysis, Insights and Forecast - by Satellite Mass
- 10.2.1. 10-100kg
- 10.2.2. 100-500kg
- 10.2.3. 500-1000kg
- 10.2.4. Below 10 Kg
- 10.2.5. above 1000kg
- 10.3. Market Analysis, Insights and Forecast - by Orbit Class
- 10.3.1. GEO
- 10.3.2. LEO
- 10.3.3. MEO
- 10.4. Market Analysis, Insights and Forecast - by End User
- 10.4.1. Commercial
- 10.4.2. Military & Government
- 10.4.3. Other
- 10.1. Market Analysis, Insights and Forecast - by Application
- 11. Asia Pacific Satellite Bus Market Analysis, Insights and Forecast, 2021-2033
- 11.1. Market Analysis, Insights and Forecast - by Application
- 11.1.1. Communication
- 11.1.2. Earth Observation
- 11.1.3. Navigation
- 11.1.4. Space Observation
- 11.1.5. Others
- 11.2. Market Analysis, Insights and Forecast - by Satellite Mass
- 11.2.1. 10-100kg
- 11.2.2. 100-500kg
- 11.2.3. 500-1000kg
- 11.2.4. Below 10 Kg
- 11.2.5. above 1000kg
- 11.3. Market Analysis, Insights and Forecast - by Orbit Class
- 11.3.1. GEO
- 11.3.2. LEO
- 11.3.3. MEO
- 11.4. Market Analysis, Insights and Forecast - by End User
- 11.4.1. Commercial
- 11.4.2. Military & Government
- 11.4.3. Other
- 11.1. Market Analysis, Insights and Forecast - by Application
- 12. Competitive Analysis
- 12.1. Company Profiles
- 12.1.1 NEC
- 12.1.1.1. Company Overview
- 12.1.1.2. Products
- 12.1.1.3. Company Financials
- 12.1.1.4. SWOT Analysis
- 12.1.2 Honeywell International Inc
- 12.1.2.1. Company Overview
- 12.1.2.2. Products
- 12.1.2.3. Company Financials
- 12.1.2.4. SWOT Analysis
- 12.1.3 Lockheed Martin Corporation
- 12.1.3.1. Company Overview
- 12.1.3.2. Products
- 12.1.3.3. Company Financials
- 12.1.3.4. SWOT Analysis
- 12.1.4 Airbus SE
- 12.1.4.1. Company Overview
- 12.1.4.2. Products
- 12.1.4.3. Company Financials
- 12.1.4.4. SWOT Analysis
- 12.1.5 Ball Corporation
- 12.1.5.1. Company Overview
- 12.1.5.2. Products
- 12.1.5.3. Company Financials
- 12.1.5.4. SWOT Analysis
- 12.1.6 Sierra Nevada Corporation
- 12.1.6.1. Company Overview
- 12.1.6.2. Products
- 12.1.6.3. Company Financials
- 12.1.6.4. SWOT Analysis
- 12.1.7 Nano Avionics
- 12.1.7.1. Company Overview
- 12.1.7.2. Products
- 12.1.7.3. Company Financials
- 12.1.7.4. SWOT Analysis
- 12.1.8 OHB SE
- 12.1.8.1. Company Overview
- 12.1.8.2. Products
- 12.1.8.3. Company Financials
- 12.1.8.4. SWOT Analysis
- 12.1.9 Thale
- 12.1.9.1. Company Overview
- 12.1.9.2. Products
- 12.1.9.3. Company Financials
- 12.1.9.4. SWOT Analysis
- 12.1.10 Northrop Grumman Corporation
- 12.1.10.1. Company Overview
- 12.1.10.2. Products
- 12.1.10.3. Company Financials
- 12.1.10.4. SWOT Analysis
- 12.1.1 NEC
- 12.2. Market Entropy
- 12.2.1 Company's Key Areas Served
- 12.2.2 Recent Developments
- 12.3. Company Market Share Analysis 2025
- 12.3.1 Top 5 Companies Market Share Analysis
- 12.3.2 Top 3 Companies Market Share Analysis
- 12.4. List of Potential Customers
- 13. Research Methodology
List of Figures
- Figure 1: Global Satellite Bus Market Revenue Breakdown (billion, %) by Region 2025 & 2033
- Figure 2: North America Satellite Bus Market Revenue (billion), by Application 2025 & 2033
- Figure 3: North America Satellite Bus Market Revenue Share (%), by Application 2025 & 2033
- Figure 4: North America Satellite Bus Market Revenue (billion), by Satellite Mass 2025 & 2033
- Figure 5: North America Satellite Bus Market Revenue Share (%), by Satellite Mass 2025 & 2033
- Figure 6: North America Satellite Bus Market Revenue (billion), by Orbit Class 2025 & 2033
- Figure 7: North America Satellite Bus Market Revenue Share (%), by Orbit Class 2025 & 2033
- Figure 8: North America Satellite Bus Market Revenue (billion), by End User 2025 & 2033
- Figure 9: North America Satellite Bus Market Revenue Share (%), by End User 2025 & 2033
- Figure 10: North America Satellite Bus Market Revenue (billion), by Country 2025 & 2033
- Figure 11: North America Satellite Bus Market Revenue Share (%), by Country 2025 & 2033
- Figure 12: South America Satellite Bus Market Revenue (billion), by Application 2025 & 2033
- Figure 13: South America Satellite Bus Market Revenue Share (%), by Application 2025 & 2033
- Figure 14: South America Satellite Bus Market Revenue (billion), by Satellite Mass 2025 & 2033
- Figure 15: South America Satellite Bus Market Revenue Share (%), by Satellite Mass 2025 & 2033
- Figure 16: South America Satellite Bus Market Revenue (billion), by Orbit Class 2025 & 2033
- Figure 17: South America Satellite Bus Market Revenue Share (%), by Orbit Class 2025 & 2033
- Figure 18: South America Satellite Bus Market Revenue (billion), by End User 2025 & 2033
- Figure 19: South America Satellite Bus Market Revenue Share (%), by End User 2025 & 2033
- Figure 20: South America Satellite Bus Market Revenue (billion), by Country 2025 & 2033
- Figure 21: South America Satellite Bus Market Revenue Share (%), by Country 2025 & 2033
- Figure 22: Europe Satellite Bus Market Revenue (billion), by Application 2025 & 2033
- Figure 23: Europe Satellite Bus Market Revenue Share (%), by Application 2025 & 2033
- Figure 24: Europe Satellite Bus Market Revenue (billion), by Satellite Mass 2025 & 2033
- Figure 25: Europe Satellite Bus Market Revenue Share (%), by Satellite Mass 2025 & 2033
- Figure 26: Europe Satellite Bus Market Revenue (billion), by Orbit Class 2025 & 2033
- Figure 27: Europe Satellite Bus Market Revenue Share (%), by Orbit Class 2025 & 2033
- Figure 28: Europe Satellite Bus Market Revenue (billion), by End User 2025 & 2033
- Figure 29: Europe Satellite Bus Market Revenue Share (%), by End User 2025 & 2033
- Figure 30: Europe Satellite Bus Market Revenue (billion), by Country 2025 & 2033
- Figure 31: Europe Satellite Bus Market Revenue Share (%), by Country 2025 & 2033
- Figure 32: Middle East & Africa Satellite Bus Market Revenue (billion), by Application 2025 & 2033
- Figure 33: Middle East & Africa Satellite Bus Market Revenue Share (%), by Application 2025 & 2033
- Figure 34: Middle East & Africa Satellite Bus Market Revenue (billion), by Satellite Mass 2025 & 2033
- Figure 35: Middle East & Africa Satellite Bus Market Revenue Share (%), by Satellite Mass 2025 & 2033
- Figure 36: Middle East & Africa Satellite Bus Market Revenue (billion), by Orbit Class 2025 & 2033
- Figure 37: Middle East & Africa Satellite Bus Market Revenue Share (%), by Orbit Class 2025 & 2033
- Figure 38: Middle East & Africa Satellite Bus Market Revenue (billion), by End User 2025 & 2033
- Figure 39: Middle East & Africa Satellite Bus Market Revenue Share (%), by End User 2025 & 2033
- Figure 40: Middle East & Africa Satellite Bus Market Revenue (billion), by Country 2025 & 2033
- Figure 41: Middle East & Africa Satellite Bus Market Revenue Share (%), by Country 2025 & 2033
- Figure 42: Asia Pacific Satellite Bus Market Revenue (billion), by Application 2025 & 2033
- Figure 43: Asia Pacific Satellite Bus Market Revenue Share (%), by Application 2025 & 2033
- Figure 44: Asia Pacific Satellite Bus Market Revenue (billion), by Satellite Mass 2025 & 2033
- Figure 45: Asia Pacific Satellite Bus Market Revenue Share (%), by Satellite Mass 2025 & 2033
- Figure 46: Asia Pacific Satellite Bus Market Revenue (billion), by Orbit Class 2025 & 2033
- Figure 47: Asia Pacific Satellite Bus Market Revenue Share (%), by Orbit Class 2025 & 2033
- Figure 48: Asia Pacific Satellite Bus Market Revenue (billion), by End User 2025 & 2033
- Figure 49: Asia Pacific Satellite Bus Market Revenue Share (%), by End User 2025 & 2033
- Figure 50: Asia Pacific Satellite Bus Market Revenue (billion), by Country 2025 & 2033
- Figure 51: Asia Pacific Satellite Bus Market Revenue Share (%), by Country 2025 & 2033
List of Tables
- Table 1: Global Satellite Bus Market Revenue billion Forecast, by Application 2020 & 2033
- Table 2: Global Satellite Bus Market Revenue billion Forecast, by Satellite Mass 2020 & 2033
- Table 3: Global Satellite Bus Market Revenue billion Forecast, by Orbit Class 2020 & 2033
- Table 4: Global Satellite Bus Market Revenue billion Forecast, by End User 2020 & 2033
- Table 5: Global Satellite Bus Market Revenue billion Forecast, by Region 2020 & 2033
- Table 6: Global Satellite Bus Market Revenue billion Forecast, by Application 2020 & 2033
- Table 7: Global Satellite Bus Market Revenue billion Forecast, by Satellite Mass 2020 & 2033
- Table 8: Global Satellite Bus Market Revenue billion Forecast, by Orbit Class 2020 & 2033
- Table 9: Global Satellite Bus Market Revenue billion Forecast, by End User 2020 & 2033
- Table 10: Global Satellite Bus Market Revenue billion Forecast, by Country 2020 & 2033
- Table 11: United States Satellite Bus Market Revenue (billion) Forecast, by Application 2020 & 2033
- Table 12: Canada Satellite Bus Market Revenue (billion) Forecast, by Application 2020 & 2033
- Table 13: Mexico Satellite Bus Market Revenue (billion) Forecast, by Application 2020 & 2033
- Table 14: Global Satellite Bus Market Revenue billion Forecast, by Application 2020 & 2033
- Table 15: Global Satellite Bus Market Revenue billion Forecast, by Satellite Mass 2020 & 2033
- Table 16: Global Satellite Bus Market Revenue billion Forecast, by Orbit Class 2020 & 2033
- Table 17: Global Satellite Bus Market Revenue billion Forecast, by End User 2020 & 2033
- Table 18: Global Satellite Bus Market Revenue billion Forecast, by Country 2020 & 2033
- Table 19: Brazil Satellite Bus Market Revenue (billion) Forecast, by Application 2020 & 2033
- Table 20: Argentina Satellite Bus Market Revenue (billion) Forecast, by Application 2020 & 2033
- Table 21: Rest of South America Satellite Bus Market Revenue (billion) Forecast, by Application 2020 & 2033
- Table 22: Global Satellite Bus Market Revenue billion Forecast, by Application 2020 & 2033
- Table 23: Global Satellite Bus Market Revenue billion Forecast, by Satellite Mass 2020 & 2033
- Table 24: Global Satellite Bus Market Revenue billion Forecast, by Orbit Class 2020 & 2033
- Table 25: Global Satellite Bus Market Revenue billion Forecast, by End User 2020 & 2033
- Table 26: Global Satellite Bus Market Revenue billion Forecast, by Country 2020 & 2033
- Table 27: United Kingdom Satellite Bus Market Revenue (billion) Forecast, by Application 2020 & 2033
- Table 28: Germany Satellite Bus Market Revenue (billion) Forecast, by Application 2020 & 2033
- Table 29: France Satellite Bus Market Revenue (billion) Forecast, by Application 2020 & 2033
- Table 30: Italy Satellite Bus Market Revenue (billion) Forecast, by Application 2020 & 2033
- Table 31: Spain Satellite Bus Market Revenue (billion) Forecast, by Application 2020 & 2033
- Table 32: Russia Satellite Bus Market Revenue (billion) Forecast, by Application 2020 & 2033
- Table 33: Benelux Satellite Bus Market Revenue (billion) Forecast, by Application 2020 & 2033
- Table 34: Nordics Satellite Bus Market Revenue (billion) Forecast, by Application 2020 & 2033
- Table 35: Rest of Europe Satellite Bus Market Revenue (billion) Forecast, by Application 2020 & 2033
- Table 36: Global Satellite Bus Market Revenue billion Forecast, by Application 2020 & 2033
- Table 37: Global Satellite Bus Market Revenue billion Forecast, by Satellite Mass 2020 & 2033
- Table 38: Global Satellite Bus Market Revenue billion Forecast, by Orbit Class 2020 & 2033
- Table 39: Global Satellite Bus Market Revenue billion Forecast, by End User 2020 & 2033
- Table 40: Global Satellite Bus Market Revenue billion Forecast, by Country 2020 & 2033
- Table 41: Turkey Satellite Bus Market Revenue (billion) Forecast, by Application 2020 & 2033
- Table 42: Israel Satellite Bus Market Revenue (billion) Forecast, by Application 2020 & 2033
- Table 43: GCC Satellite Bus Market Revenue (billion) Forecast, by Application 2020 & 2033
- Table 44: North Africa Satellite Bus Market Revenue (billion) Forecast, by Application 2020 & 2033
- Table 45: South Africa Satellite Bus Market Revenue (billion) Forecast, by Application 2020 & 2033
- Table 46: Rest of Middle East & Africa Satellite Bus Market Revenue (billion) Forecast, by Application 2020 & 2033
- Table 47: Global Satellite Bus Market Revenue billion Forecast, by Application 2020 & 2033
- Table 48: Global Satellite Bus Market Revenue billion Forecast, by Satellite Mass 2020 & 2033
- Table 49: Global Satellite Bus Market Revenue billion Forecast, by Orbit Class 2020 & 2033
- Table 50: Global Satellite Bus Market Revenue billion Forecast, by End User 2020 & 2033
- Table 51: Global Satellite Bus Market Revenue billion Forecast, by Country 2020 & 2033
- Table 52: China Satellite Bus Market Revenue (billion) Forecast, by Application 2020 & 2033
- Table 53: India Satellite Bus Market Revenue (billion) Forecast, by Application 2020 & 2033
- Table 54: Japan Satellite Bus Market Revenue (billion) Forecast, by Application 2020 & 2033
- Table 55: South Korea Satellite Bus Market Revenue (billion) Forecast, by Application 2020 & 2033
- Table 56: ASEAN Satellite Bus Market Revenue (billion) Forecast, by Application 2020 & 2033
- Table 57: Oceania Satellite Bus Market Revenue (billion) Forecast, by Application 2020 & 2033
- Table 58: Rest of Asia Pacific Satellite Bus Market Revenue (billion) Forecast, by Application 2020 & 2033
Frequently Asked Questions
1. What is the projected Compound Annual Growth Rate (CAGR) of the Satellite Bus Market?
The projected CAGR is approximately 8.25%.
2. Which companies are prominent players in the Satellite Bus Market?
Key companies in the market include NEC, Honeywell International Inc, Lockheed Martin Corporation, Airbus SE, Ball Corporation, Sierra Nevada Corporation, Nano Avionics, OHB SE, Thale, Northrop Grumman Corporation.
3. What are the main segments of the Satellite Bus Market?
The market segments include Application, Satellite Mass, Orbit Class, End User.
4. Can you provide details about the market size?
The market size is estimated to be USD 13 billion as of 2022.
5. What are some drivers contributing to market growth?
N/A
6. What are the notable trends driving market growth?
OTHER KEY INDUSTRY TRENDS COVERED IN THE REPORT.
7. Are there any restraints impacting market growth?
N/A
8. Can you provide examples of recent developments in the market?
October 2020: NanoAvionics expanded its presence in the United Kingdom by beginning operations at its new facility in Basingstoke for satellite assembly, integration, and testing (AIT), as well as sales, technical support, and R&D activities.August 2020: SNC introduced two new satellite platforms to its spacecraft offerings, the SN-200M satellite bus, designed for medium Earth orbit (MEO), and SN-1000.July 2020: SNC was awarded a contract by the Defense Innovation Unit (DIU) for repurposing its Shooting Star transport vehicle to an Unmanned Orbital Outpost, a scalable and autonomous space.
9. What pricing options are available for accessing the report?
Pricing options include single-user, multi-user, and enterprise licenses priced at USD 3800, USD 4500, and USD 5800 respectively.
10. Is the market size provided in terms of value or volume?
The market size is provided in terms of value, measured in billion.
11. Are there any specific market keywords associated with the report?
Yes, the market keyword associated with the report is "Satellite Bus Market," which aids in identifying and referencing the specific market segment covered.
12. How do I determine which pricing option suits my needs best?
The pricing options vary based on user requirements and access needs. Individual users may opt for single-user licenses, while businesses requiring broader access may choose multi-user or enterprise licenses for cost-effective access to the report.
13. Are there any additional resources or data provided in the Satellite Bus Market report?
While the report offers comprehensive insights, it's advisable to review the specific contents or supplementary materials provided to ascertain if additional resources or data are available.
14. How can I stay updated on further developments or reports in the Satellite Bus Market?
To stay informed about further developments, trends, and reports in the Satellite Bus Market, consider subscribing to industry newsletters, following relevant companies and organizations, or regularly checking reputable industry news sources and publications.
Methodology
Step 1 - Identification of Relevant Samples Size from Population Database


Step 2 - Approaches for Defining Global Market Size (Value, Volume* & Price*)

Note*: In applicable scenarios
Step 3 - Data Sources
Primary Research
- Web Analytics
- Survey Reports
- Research Institute
- Latest Research Reports
- Opinion Leaders
Secondary Research
- Annual Reports
- White Paper
- Latest Press Release
- Industry Association
- Paid Database
- Investor Presentations

Step 4 - Data Triangulation
Involves using different sources of information in order to increase the validity of a study
These sources are likely to be stakeholders in a program - participants, other researchers, program staff, other community members, and so on.
Then we put all data in single framework & apply various statistical tools to find out the dynamic on the market.
During the analysis stage, feedback from the stakeholder groups would be compared to determine areas of agreement as well as areas of divergence