
Key Insights
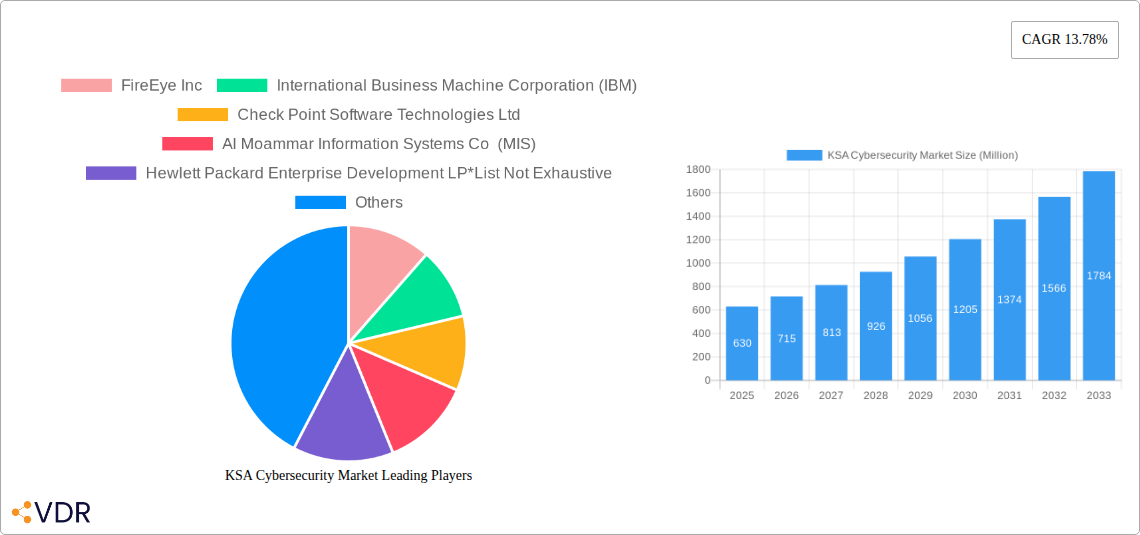
The Kingdom of Saudi Arabia (KSA) cybersecurity market, valued at $0.63 billion in 2025, is projected to experience robust growth, exhibiting a Compound Annual Growth Rate (CAGR) of 13.78% from 2025 to 2033. This expansion is fueled by several key drivers. The rapid digital transformation underway in KSA, driven by Vision 2030, necessitates enhanced cybersecurity infrastructure to protect critical national assets and burgeoning digital services. Increased government investment in cybersecurity initiatives, coupled with rising awareness among businesses about potential cyber threats and the associated financial and reputational risks, are further accelerating market growth. The increasing adoption of cloud computing and the expanding Internet of Things (IoT) ecosystem also contribute significantly to the market's upward trajectory. However, the market faces certain restraints, including a shortage of skilled cybersecurity professionals and the complexities associated with implementing robust cybersecurity solutions across diverse sectors. Despite these challenges, the long-term outlook remains positive, particularly given the government's commitment to bolstering national cybersecurity capabilities.
Segmentation analysis reveals a dynamic market landscape. The "By Offering" segment is dominated by security services, reflecting the growing demand for managed security services and incident response capabilities. Cloud-based deployments are gaining traction over on-premise solutions due to scalability and cost-effectiveness advantages. Across end-users, the BFSI (Banking, Financial Services, and Insurance) sector represents a significant market share, followed by the government and defense sectors, reflecting their critical reliance on secure systems. Healthcare and other industries are also contributing to market expansion, driven by the increasing digitization of their operations and the consequent rise in cyber threats. The competitive landscape includes both established global players and regional cybersecurity firms, indicating a diverse and competitive market dynamic within KSA. The presence of both international and local companies ensures a balanced mix of expertise and localized understanding of the market's specific needs.
KSA Cybersecurity Market: A Comprehensive Report (2019-2033)
This in-depth report provides a comprehensive analysis of the Kingdom of Saudi Arabia (KSA) cybersecurity market, encompassing market dynamics, growth trends, dominant segments, key players, and future outlook. With a study period spanning 2019-2033, a base year of 2025, and a forecast period of 2025-2033, this report offers invaluable insights for industry professionals, investors, and stakeholders seeking to navigate this rapidly evolving landscape. The report analyzes the parent market of IT security and the child market of cybersecurity in KSA, providing granular data and detailed analysis. Expected market value in 2025 is xx Million.
KSA Cybersecurity Market Dynamics & Structure
The KSA cybersecurity market is characterized by moderate concentration, with several global and regional players competing for market share. Technological innovation, driven by increasing sophistication of cyber threats and government initiatives promoting digital transformation, is a key driver. Stringent regulatory frameworks are shaping market practices, encouraging investment in robust security solutions. The market is witnessing significant M&A activity, as larger players consolidate their position and smaller companies seek strategic partnerships.
- Market Concentration: Moderately concentrated, with top 5 players holding approximately xx% market share in 2024.
- Technological Innovation: Focus on AI, machine learning, and cloud-based security solutions.
- Regulatory Framework: Increasingly stringent data protection and cybersecurity regulations.
- Competitive Substitutes: Limited direct substitutes, but alternative security approaches influence market dynamics.
- End-User Demographics: BFSI, Government & Defense, and IT & Telecommunication sectors are major consumers.
- M&A Trends: xx M&A deals recorded in the last 5 years, indicating a consolidation trend. This includes both domestic and international acquisitions.
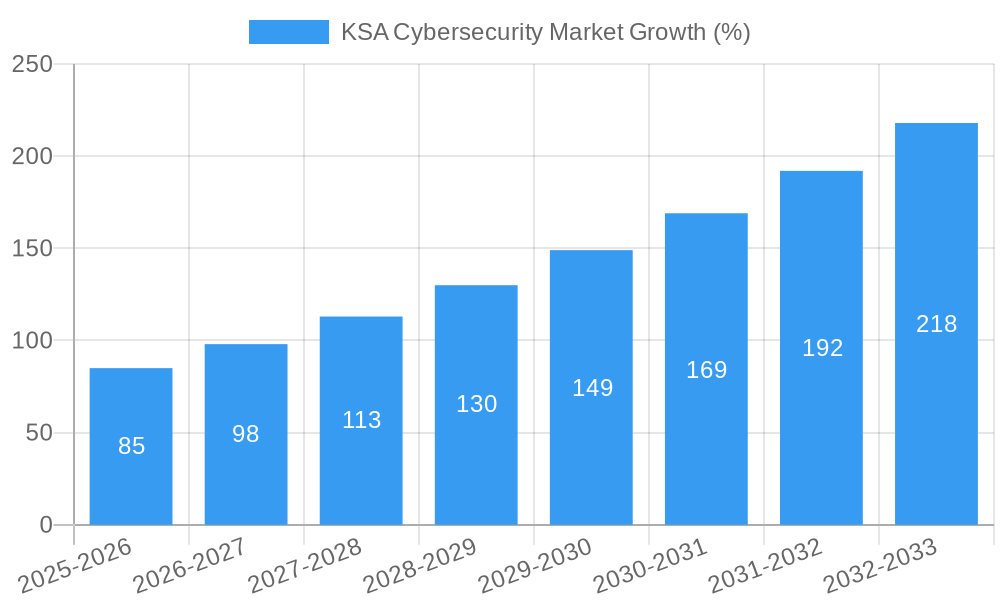
KSA Cybersecurity Market Growth Trends & Insights
The KSA cybersecurity market is experiencing robust growth, driven by rising digital adoption across various sectors, increasing cyber threats, and government investments in national cybersecurity infrastructure. The market is witnessing a significant shift towards cloud-based security solutions and an increasing adoption of advanced threat detection and response technologies. Consumer behavior is shifting towards proactive security measures, including managed security services and enhanced security awareness training.
- Market Size Evolution: The market size grew from xx Million in 2019 to xx Million in 2024, demonstrating a CAGR of xx%. Projected to reach xx Million by 2033.
- Adoption Rates: High adoption rates for basic security solutions, with increasing adoption of advanced security solutions. The penetration rate of advanced security solutions is expected to increase from xx% in 2024 to xx% by 2033.
- Technological Disruptions: AI, ML, and automation are disrupting traditional security approaches.
- Consumer Behavior Shifts: Proactive security measures, including managed services and security awareness training, are gaining prominence.
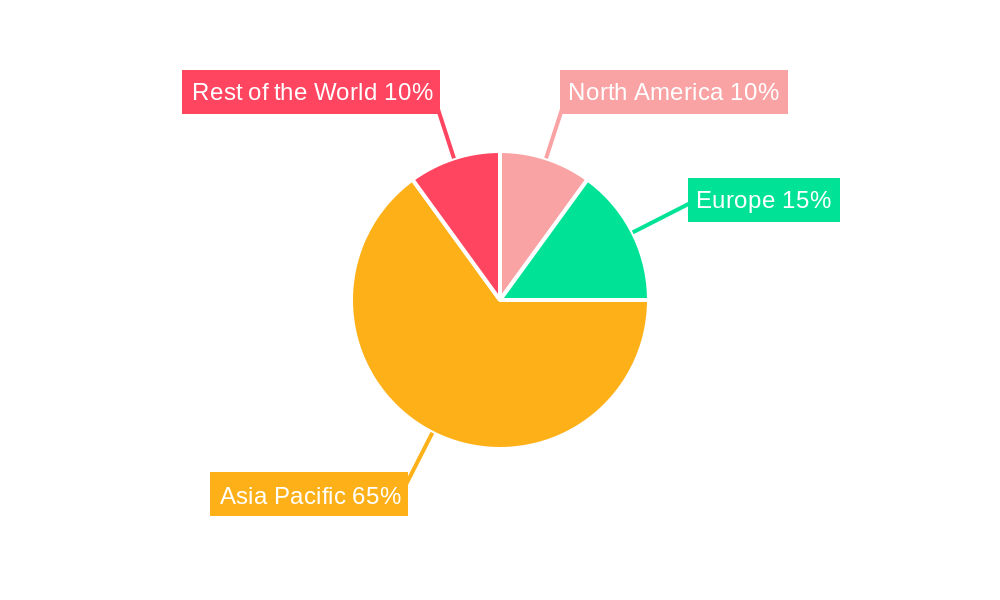
Dominant Regions, Countries, or Segments in KSA Cybersecurity Market
The KSA cybersecurity market is predominantly driven by urban centers like Riyadh and Jeddah, where major businesses and government entities are concentrated. Within segments, the Government & Defense sector exhibits the highest growth rate, followed by the BFSI sector. Cloud-based deployments are witnessing rapid adoption, while the security services segment is experiencing steady growth.
- By Offering: Security services are experiencing strong growth due to the increasing demand for managed security services.
- By Deployment: Cloud-based deployments are gaining traction due to their scalability and flexibility.
- By End-User: The Government & Defense sector is driving market growth due to increased investments in national cybersecurity infrastructure. The BFSI sector follows closely due to increasing regulatory requirements and the sensitivity of financial data.
The strong government push for digital transformation and the burgeoning private sector are key regional drivers for market dominance.
KSA Cybersecurity Market Product Landscape
The KSA cybersecurity market exhibits a diverse product landscape, encompassing a wide range of solutions, including network security, endpoint security, cloud security, data security, and security services. Products are increasingly incorporating AI, machine learning, and automation capabilities to enhance threat detection and response capabilities. Unique selling propositions focus on ease of use, integration capabilities, and robust threat intelligence.
Key Drivers, Barriers & Challenges in KSA Cybersecurity Market
Key Drivers:
- Increasing government initiatives for digital transformation.
- Rising cyber threats and data breaches.
- Growing adoption of cloud computing and IoT devices.
- Stringent data privacy regulations.
Challenges:
- Skill shortage in cybersecurity professionals.
- High initial investment costs for security solutions.
- Limited awareness of cybersecurity threats among businesses.
- Dependence on foreign vendors for advanced security solutions.
Emerging Opportunities in KSA Cybersecurity Market
- Growing demand for managed security services (MSS).
- Increasing adoption of cloud security solutions.
- Expansion of cybersecurity awareness training programs.
- Development of specialized security solutions for specific industries (e.g., healthcare, energy).
Growth Accelerators in the KSA Cybersecurity Market Industry
The KSA cybersecurity market is poised for sustained growth due to ongoing digital transformation initiatives, increased government funding for cybersecurity, and a growing awareness of cyber threats. Strategic partnerships between technology providers and local businesses, coupled with the development of indigenous cybersecurity talent, will further propel market expansion.
Key Players Shaping the KSA Cybersecurity Market Market
- FireEye Inc
- International Business Machine Corporation (IBM)
- Check Point Software Technologies Ltd
- Al Moammar Information Systems Co (MIS)
- Hewlett Packard Enterprise Development LP
- Tenable Inc
- Cisco Systems Inc
- Salesforce com Inc
- FORTINET INC
- NortonLifeLock Inc
- Dell Technologies Inc
- McAfee Corporation
- Palo Alto Networks Inc
Notable Milestones in KSA Cybersecurity Market Sector
- July 2022: Cisco launched a secure cloud with an open shared signals and events framework and Talos Intel On-Demand, enhancing threat detection.
- August 2022: Palo Alto Networks introduced Unit 42 MDR, offering continuous threat detection and response.
In-Depth KSA Cybersecurity Market Market Outlook
The KSA cybersecurity market holds immense potential for growth, driven by sustained digital transformation, increased investment in security infrastructure, and rising cybersecurity awareness. Strategic collaborations between international and local players, along with the development of specialized security solutions catering to the unique needs of various sectors, will shape the future of this dynamic market. The market is expected to continue its strong growth trajectory in the coming years, offering significant opportunities for both established and emerging players.
KSA Cybersecurity Market Segmentation
-
1. Offering
-
1.1. Solutions
- 1.1.1. Application Security
- 1.1.2. Cloud Security
- 1.1.3. Data Security
- 1.1.4. Identity and Access Management
- 1.1.5. Infrastructure Protection
- 1.1.6. Integrated Risk Management
- 1.1.7. Network Security Equipment
- 1.1.8. Consumer Security
- 1.1.9. Other Solutions
-
1.2. Services
- 1.2.1. Professional Services
- 1.2.2. Managed Services
-
1.1. Solutions
-
2. Deployment
- 2.1. Cloud
- 2.2. On-premise
-
3. Organization Size
- 3.1. SMEs
- 3.2. Large Enterprises
-
4. End User
- 4.1. BFSI
- 4.2. Healthcare
- 4.3. Construction
- 4.4. Government & Defense
- 4.5. IT and Telecommunication
- 4.6. Retail
- 4.7. Energy and Utilities
- 4.8. Manufacturing
- 4.9. Other End Users
KSA Cybersecurity Market Segmentation By Geography
-
1. North America
- 1.1. United States
- 1.2. Canada
- 1.3. Mexico
-
2. South America
- 2.1. Brazil
- 2.2. Argentina
- 2.3. Rest of South America
-
3. Europe
- 3.1. United Kingdom
- 3.2. Germany
- 3.3. France
- 3.4. Italy
- 3.5. Spain
- 3.6. Russia
- 3.7. Benelux
- 3.8. Nordics
- 3.9. Rest of Europe
-
4. Middle East & Africa
- 4.1. Turkey
- 4.2. Israel
- 4.3. GCC
- 4.4. North Africa
- 4.5. South Africa
- 4.6. Rest of Middle East & Africa
-
5. Asia Pacific
- 5.1. China
- 5.2. India
- 5.3. Japan
- 5.4. South Korea
- 5.5. ASEAN
- 5.6. Oceania
- 5.7. Rest of Asia Pacific
KSA Cybersecurity Market REPORT HIGHLIGHTS
| Aspects | Details |
|---|---|
| Study Period | 2019-2033 |
| Base Year | 2024 |
| Estimated Year | 2025 |
| Forecast Period | 2025-2033 |
| Historical Period | 2019-2024 |
| Growth Rate | CAGR of 13.78% from 2019-2033 |
| Segmentation |
|
Table of Contents
- 1. Introduction
- 1.1. Research Scope
- 1.2. Market Segmentation
- 1.3. Research Methodology
- 1.4. Definitions and Assumptions
- 2. Executive Summary
- 2.1. Introduction
- 3. Market Dynamics
- 3.1. Introduction
- 3.2. Market Drivers
- 3.2.1 Increasing Demand for Digitalization and Scalable IT Infrastructure; Need to tackle risks from various trends such as third-party vendor risks
- 3.2.2 the evolution of MSSPs
- 3.2.3 and adoption of cloud-first strategy
- 3.3. Market Restrains
- 3.3.1. Lack of Cybersecurity Professionals; High Reliance on Traditional Authentication Methods and Low Preparedness
- 3.4. Market Trends
- 3.4.1. Growing usage of the Cloud Services across the region
- 4. Market Factor Analysis
- 4.1. Porters Five Forces
- 4.2. Supply/Value Chain
- 4.3. PESTEL analysis
- 4.4. Market Entropy
- 4.5. Patent/Trademark Analysis
- 5. Global KSA Cybersecurity Market Analysis, Insights and Forecast, 2019-2031
- 5.1. Market Analysis, Insights and Forecast - by Offering
- 5.1.1. Solutions
- 5.1.1.1. Application Security
- 5.1.1.2. Cloud Security
- 5.1.1.3. Data Security
- 5.1.1.4. Identity and Access Management
- 5.1.1.5. Infrastructure Protection
- 5.1.1.6. Integrated Risk Management
- 5.1.1.7. Network Security Equipment
- 5.1.1.8. Consumer Security
- 5.1.1.9. Other Solutions
- 5.1.2. Services
- 5.1.2.1. Professional Services
- 5.1.2.2. Managed Services
- 5.1.1. Solutions
- 5.2. Market Analysis, Insights and Forecast - by Deployment
- 5.2.1. Cloud
- 5.2.2. On-premise
- 5.3. Market Analysis, Insights and Forecast - by Organization Size
- 5.3.1. SMEs
- 5.3.2. Large Enterprises
- 5.4. Market Analysis, Insights and Forecast - by End User
- 5.4.1. BFSI
- 5.4.2. Healthcare
- 5.4.3. Construction
- 5.4.4. Government & Defense
- 5.4.5. IT and Telecommunication
- 5.4.6. Retail
- 5.4.7. Energy and Utilities
- 5.4.8. Manufacturing
- 5.4.9. Other End Users
- 5.5. Market Analysis, Insights and Forecast - by Region
- 5.5.1. North America
- 5.5.2. South America
- 5.5.3. Europe
- 5.5.4. Middle East & Africa
- 5.5.5. Asia Pacific
- 5.1. Market Analysis, Insights and Forecast - by Offering
- 6. North America KSA Cybersecurity Market Analysis, Insights and Forecast, 2019-2031
- 6.1. Market Analysis, Insights and Forecast - by Offering
- 6.1.1. Solutions
- 6.1.1.1. Application Security
- 6.1.1.2. Cloud Security
- 6.1.1.3. Data Security
- 6.1.1.4. Identity and Access Management
- 6.1.1.5. Infrastructure Protection
- 6.1.1.6. Integrated Risk Management
- 6.1.1.7. Network Security Equipment
- 6.1.1.8. Consumer Security
- 6.1.1.9. Other Solutions
- 6.1.2. Services
- 6.1.2.1. Professional Services
- 6.1.2.2. Managed Services
- 6.1.1. Solutions
- 6.2. Market Analysis, Insights and Forecast - by Deployment
- 6.2.1. Cloud
- 6.2.2. On-premise
- 6.3. Market Analysis, Insights and Forecast - by Organization Size
- 6.3.1. SMEs
- 6.3.2. Large Enterprises
- 6.4. Market Analysis, Insights and Forecast - by End User
- 6.4.1. BFSI
- 6.4.2. Healthcare
- 6.4.3. Construction
- 6.4.4. Government & Defense
- 6.4.5. IT and Telecommunication
- 6.4.6. Retail
- 6.4.7. Energy and Utilities
- 6.4.8. Manufacturing
- 6.4.9. Other End Users
- 6.1. Market Analysis, Insights and Forecast - by Offering
- 7. South America KSA Cybersecurity Market Analysis, Insights and Forecast, 2019-2031
- 7.1. Market Analysis, Insights and Forecast - by Offering
- 7.1.1. Solutions
- 7.1.1.1. Application Security
- 7.1.1.2. Cloud Security
- 7.1.1.3. Data Security
- 7.1.1.4. Identity and Access Management
- 7.1.1.5. Infrastructure Protection
- 7.1.1.6. Integrated Risk Management
- 7.1.1.7. Network Security Equipment
- 7.1.1.8. Consumer Security
- 7.1.1.9. Other Solutions
- 7.1.2. Services
- 7.1.2.1. Professional Services
- 7.1.2.2. Managed Services
- 7.1.1. Solutions
- 7.2. Market Analysis, Insights and Forecast - by Deployment
- 7.2.1. Cloud
- 7.2.2. On-premise
- 7.3. Market Analysis, Insights and Forecast - by Organization Size
- 7.3.1. SMEs
- 7.3.2. Large Enterprises
- 7.4. Market Analysis, Insights and Forecast - by End User
- 7.4.1. BFSI
- 7.4.2. Healthcare
- 7.4.3. Construction
- 7.4.4. Government & Defense
- 7.4.5. IT and Telecommunication
- 7.4.6. Retail
- 7.4.7. Energy and Utilities
- 7.4.8. Manufacturing
- 7.4.9. Other End Users
- 7.1. Market Analysis, Insights and Forecast - by Offering
- 8. Europe KSA Cybersecurity Market Analysis, Insights and Forecast, 2019-2031
- 8.1. Market Analysis, Insights and Forecast - by Offering
- 8.1.1. Solutions
- 8.1.1.1. Application Security
- 8.1.1.2. Cloud Security
- 8.1.1.3. Data Security
- 8.1.1.4. Identity and Access Management
- 8.1.1.5. Infrastructure Protection
- 8.1.1.6. Integrated Risk Management
- 8.1.1.7. Network Security Equipment
- 8.1.1.8. Consumer Security
- 8.1.1.9. Other Solutions
- 8.1.2. Services
- 8.1.2.1. Professional Services
- 8.1.2.2. Managed Services
- 8.1.1. Solutions
- 8.2. Market Analysis, Insights and Forecast - by Deployment
- 8.2.1. Cloud
- 8.2.2. On-premise
- 8.3. Market Analysis, Insights and Forecast - by Organization Size
- 8.3.1. SMEs
- 8.3.2. Large Enterprises
- 8.4. Market Analysis, Insights and Forecast - by End User
- 8.4.1. BFSI
- 8.4.2. Healthcare
- 8.4.3. Construction
- 8.4.4. Government & Defense
- 8.4.5. IT and Telecommunication
- 8.4.6. Retail
- 8.4.7. Energy and Utilities
- 8.4.8. Manufacturing
- 8.4.9. Other End Users
- 8.1. Market Analysis, Insights and Forecast - by Offering
- 9. Middle East & Africa KSA Cybersecurity Market Analysis, Insights and Forecast, 2019-2031
- 9.1. Market Analysis, Insights and Forecast - by Offering
- 9.1.1. Solutions
- 9.1.1.1. Application Security
- 9.1.1.2. Cloud Security
- 9.1.1.3. Data Security
- 9.1.1.4. Identity and Access Management
- 9.1.1.5. Infrastructure Protection
- 9.1.1.6. Integrated Risk Management
- 9.1.1.7. Network Security Equipment
- 9.1.1.8. Consumer Security
- 9.1.1.9. Other Solutions
- 9.1.2. Services
- 9.1.2.1. Professional Services
- 9.1.2.2. Managed Services
- 9.1.1. Solutions
- 9.2. Market Analysis, Insights and Forecast - by Deployment
- 9.2.1. Cloud
- 9.2.2. On-premise
- 9.3. Market Analysis, Insights and Forecast - by Organization Size
- 9.3.1. SMEs
- 9.3.2. Large Enterprises
- 9.4. Market Analysis, Insights and Forecast - by End User
- 9.4.1. BFSI
- 9.4.2. Healthcare
- 9.4.3. Construction
- 9.4.4. Government & Defense
- 9.4.5. IT and Telecommunication
- 9.4.6. Retail
- 9.4.7. Energy and Utilities
- 9.4.8. Manufacturing
- 9.4.9. Other End Users
- 9.1. Market Analysis, Insights and Forecast - by Offering
- 10. Asia Pacific KSA Cybersecurity Market Analysis, Insights and Forecast, 2019-2031
- 10.1. Market Analysis, Insights and Forecast - by Offering
- 10.1.1. Solutions
- 10.1.1.1. Application Security
- 10.1.1.2. Cloud Security
- 10.1.1.3. Data Security
- 10.1.1.4. Identity and Access Management
- 10.1.1.5. Infrastructure Protection
- 10.1.1.6. Integrated Risk Management
- 10.1.1.7. Network Security Equipment
- 10.1.1.8. Consumer Security
- 10.1.1.9. Other Solutions
- 10.1.2. Services
- 10.1.2.1. Professional Services
- 10.1.2.2. Managed Services
- 10.1.1. Solutions
- 10.2. Market Analysis, Insights and Forecast - by Deployment
- 10.2.1. Cloud
- 10.2.2. On-premise
- 10.3. Market Analysis, Insights and Forecast - by Organization Size
- 10.3.1. SMEs
- 10.3.2. Large Enterprises
- 10.4. Market Analysis, Insights and Forecast - by End User
- 10.4.1. BFSI
- 10.4.2. Healthcare
- 10.4.3. Construction
- 10.4.4. Government & Defense
- 10.4.5. IT and Telecommunication
- 10.4.6. Retail
- 10.4.7. Energy and Utilities
- 10.4.8. Manufacturing
- 10.4.9. Other End Users
- 10.1. Market Analysis, Insights and Forecast - by Offering
- 11. North America KSA Cybersecurity Market Analysis, Insights and Forecast, 2019-2031
- 11.1. Market Analysis, Insights and Forecast - By Country/Sub-region
- 11.1.1.
- 12. Europe KSA Cybersecurity Market Analysis, Insights and Forecast, 2019-2031
- 12.1. Market Analysis, Insights and Forecast - By Country/Sub-region
- 12.1.1.
- 13. Asia Pacific KSA Cybersecurity Market Analysis, Insights and Forecast, 2019-2031
- 13.1. Market Analysis, Insights and Forecast - By Country/Sub-region
- 13.1.1.
- 14. Rest of the World KSA Cybersecurity Market Analysis, Insights and Forecast, 2019-2031
- 14.1. Market Analysis, Insights and Forecast - By Country/Sub-region
- 14.1.1.
- 15. Competitive Analysis
- 15.1. Global Market Share Analysis 2024
- 15.2. Company Profiles
- 15.2.1 FireEye Inc
- 15.2.1.1. Overview
- 15.2.1.2. Products
- 15.2.1.3. SWOT Analysis
- 15.2.1.4. Recent Developments
- 15.2.1.5. Financials (Based on Availability)
- 15.2.2 International Business Machine Corporation (IBM)
- 15.2.2.1. Overview
- 15.2.2.2. Products
- 15.2.2.3. SWOT Analysis
- 15.2.2.4. Recent Developments
- 15.2.2.5. Financials (Based on Availability)
- 15.2.3 Check Point Software Technologies Ltd
- 15.2.3.1. Overview
- 15.2.3.2. Products
- 15.2.3.3. SWOT Analysis
- 15.2.3.4. Recent Developments
- 15.2.3.5. Financials (Based on Availability)
- 15.2.4 Al Moammar Information Systems Co (MIS)
- 15.2.4.1. Overview
- 15.2.4.2. Products
- 15.2.4.3. SWOT Analysis
- 15.2.4.4. Recent Developments
- 15.2.4.5. Financials (Based on Availability)
- 15.2.5 Hewlett Packard Enterprise Development LP*List Not Exhaustive
- 15.2.5.1. Overview
- 15.2.5.2. Products
- 15.2.5.3. SWOT Analysis
- 15.2.5.4. Recent Developments
- 15.2.5.5. Financials (Based on Availability)
- 15.2.6 Tenable Inc
- 15.2.6.1. Overview
- 15.2.6.2. Products
- 15.2.6.3. SWOT Analysis
- 15.2.6.4. Recent Developments
- 15.2.6.5. Financials (Based on Availability)
- 15.2.7 Cisco Systems Inc
- 15.2.7.1. Overview
- 15.2.7.2. Products
- 15.2.7.3. SWOT Analysis
- 15.2.7.4. Recent Developments
- 15.2.7.5. Financials (Based on Availability)
- 15.2.8 Salesforce com Inc
- 15.2.8.1. Overview
- 15.2.8.2. Products
- 15.2.8.3. SWOT Analysis
- 15.2.8.4. Recent Developments
- 15.2.8.5. Financials (Based on Availability)
- 15.2.9 FORTINET INC
- 15.2.9.1. Overview
- 15.2.9.2. Products
- 15.2.9.3. SWOT Analysis
- 15.2.9.4. Recent Developments
- 15.2.9.5. Financials (Based on Availability)
- 15.2.10 NortonLifeLock Inc
- 15.2.10.1. Overview
- 15.2.10.2. Products
- 15.2.10.3. SWOT Analysis
- 15.2.10.4. Recent Developments
- 15.2.10.5. Financials (Based on Availability)
- 15.2.11 Dell Technologies Inc
- 15.2.11.1. Overview
- 15.2.11.2. Products
- 15.2.11.3. SWOT Analysis
- 15.2.11.4. Recent Developments
- 15.2.11.5. Financials (Based on Availability)
- 15.2.12 McAfee Corporation
- 15.2.12.1. Overview
- 15.2.12.2. Products
- 15.2.12.3. SWOT Analysis
- 15.2.12.4. Recent Developments
- 15.2.12.5. Financials (Based on Availability)
- 15.2.13 Palo Alto Networks Inc
- 15.2.13.1. Overview
- 15.2.13.2. Products
- 15.2.13.3. SWOT Analysis
- 15.2.13.4. Recent Developments
- 15.2.13.5. Financials (Based on Availability)
- 15.2.1 FireEye Inc
List of Figures
- Figure 1: Global KSA Cybersecurity Market Revenue Breakdown (Million, %) by Region 2024 & 2032
- Figure 2: North America KSA Cybersecurity Market Revenue (Million), by Country 2024 & 2032
- Figure 3: North America KSA Cybersecurity Market Revenue Share (%), by Country 2024 & 2032
- Figure 4: Europe KSA Cybersecurity Market Revenue (Million), by Country 2024 & 2032
- Figure 5: Europe KSA Cybersecurity Market Revenue Share (%), by Country 2024 & 2032
- Figure 6: Asia Pacific KSA Cybersecurity Market Revenue (Million), by Country 2024 & 2032
- Figure 7: Asia Pacific KSA Cybersecurity Market Revenue Share (%), by Country 2024 & 2032
- Figure 8: Rest of the World KSA Cybersecurity Market Revenue (Million), by Country 2024 & 2032
- Figure 9: Rest of the World KSA Cybersecurity Market Revenue Share (%), by Country 2024 & 2032
- Figure 10: North America KSA Cybersecurity Market Revenue (Million), by Offering 2024 & 2032
- Figure 11: North America KSA Cybersecurity Market Revenue Share (%), by Offering 2024 & 2032
- Figure 12: North America KSA Cybersecurity Market Revenue (Million), by Deployment 2024 & 2032
- Figure 13: North America KSA Cybersecurity Market Revenue Share (%), by Deployment 2024 & 2032
- Figure 14: North America KSA Cybersecurity Market Revenue (Million), by Organization Size 2024 & 2032
- Figure 15: North America KSA Cybersecurity Market Revenue Share (%), by Organization Size 2024 & 2032
- Figure 16: North America KSA Cybersecurity Market Revenue (Million), by End User 2024 & 2032
- Figure 17: North America KSA Cybersecurity Market Revenue Share (%), by End User 2024 & 2032
- Figure 18: North America KSA Cybersecurity Market Revenue (Million), by Country 2024 & 2032
- Figure 19: North America KSA Cybersecurity Market Revenue Share (%), by Country 2024 & 2032
- Figure 20: South America KSA Cybersecurity Market Revenue (Million), by Offering 2024 & 2032
- Figure 21: South America KSA Cybersecurity Market Revenue Share (%), by Offering 2024 & 2032
- Figure 22: South America KSA Cybersecurity Market Revenue (Million), by Deployment 2024 & 2032
- Figure 23: South America KSA Cybersecurity Market Revenue Share (%), by Deployment 2024 & 2032
- Figure 24: South America KSA Cybersecurity Market Revenue (Million), by Organization Size 2024 & 2032
- Figure 25: South America KSA Cybersecurity Market Revenue Share (%), by Organization Size 2024 & 2032
- Figure 26: South America KSA Cybersecurity Market Revenue (Million), by End User 2024 & 2032
- Figure 27: South America KSA Cybersecurity Market Revenue Share (%), by End User 2024 & 2032
- Figure 28: South America KSA Cybersecurity Market Revenue (Million), by Country 2024 & 2032
- Figure 29: South America KSA Cybersecurity Market Revenue Share (%), by Country 2024 & 2032
- Figure 30: Europe KSA Cybersecurity Market Revenue (Million), by Offering 2024 & 2032
- Figure 31: Europe KSA Cybersecurity Market Revenue Share (%), by Offering 2024 & 2032
- Figure 32: Europe KSA Cybersecurity Market Revenue (Million), by Deployment 2024 & 2032
- Figure 33: Europe KSA Cybersecurity Market Revenue Share (%), by Deployment 2024 & 2032
- Figure 34: Europe KSA Cybersecurity Market Revenue (Million), by Organization Size 2024 & 2032
- Figure 35: Europe KSA Cybersecurity Market Revenue Share (%), by Organization Size 2024 & 2032
- Figure 36: Europe KSA Cybersecurity Market Revenue (Million), by End User 2024 & 2032
- Figure 37: Europe KSA Cybersecurity Market Revenue Share (%), by End User 2024 & 2032
- Figure 38: Europe KSA Cybersecurity Market Revenue (Million), by Country 2024 & 2032
- Figure 39: Europe KSA Cybersecurity Market Revenue Share (%), by Country 2024 & 2032
- Figure 40: Middle East & Africa KSA Cybersecurity Market Revenue (Million), by Offering 2024 & 2032
- Figure 41: Middle East & Africa KSA Cybersecurity Market Revenue Share (%), by Offering 2024 & 2032
- Figure 42: Middle East & Africa KSA Cybersecurity Market Revenue (Million), by Deployment 2024 & 2032
- Figure 43: Middle East & Africa KSA Cybersecurity Market Revenue Share (%), by Deployment 2024 & 2032
- Figure 44: Middle East & Africa KSA Cybersecurity Market Revenue (Million), by Organization Size 2024 & 2032
- Figure 45: Middle East & Africa KSA Cybersecurity Market Revenue Share (%), by Organization Size 2024 & 2032
- Figure 46: Middle East & Africa KSA Cybersecurity Market Revenue (Million), by End User 2024 & 2032
- Figure 47: Middle East & Africa KSA Cybersecurity Market Revenue Share (%), by End User 2024 & 2032
- Figure 48: Middle East & Africa KSA Cybersecurity Market Revenue (Million), by Country 2024 & 2032
- Figure 49: Middle East & Africa KSA Cybersecurity Market Revenue Share (%), by Country 2024 & 2032
- Figure 50: Asia Pacific KSA Cybersecurity Market Revenue (Million), by Offering 2024 & 2032
- Figure 51: Asia Pacific KSA Cybersecurity Market Revenue Share (%), by Offering 2024 & 2032
- Figure 52: Asia Pacific KSA Cybersecurity Market Revenue (Million), by Deployment 2024 & 2032
- Figure 53: Asia Pacific KSA Cybersecurity Market Revenue Share (%), by Deployment 2024 & 2032
- Figure 54: Asia Pacific KSA Cybersecurity Market Revenue (Million), by Organization Size 2024 & 2032
- Figure 55: Asia Pacific KSA Cybersecurity Market Revenue Share (%), by Organization Size 2024 & 2032
- Figure 56: Asia Pacific KSA Cybersecurity Market Revenue (Million), by End User 2024 & 2032
- Figure 57: Asia Pacific KSA Cybersecurity Market Revenue Share (%), by End User 2024 & 2032
- Figure 58: Asia Pacific KSA Cybersecurity Market Revenue (Million), by Country 2024 & 2032
- Figure 59: Asia Pacific KSA Cybersecurity Market Revenue Share (%), by Country 2024 & 2032
List of Tables
- Table 1: Global KSA Cybersecurity Market Revenue Million Forecast, by Region 2019 & 2032
- Table 2: Global KSA Cybersecurity Market Revenue Million Forecast, by Offering 2019 & 2032
- Table 3: Global KSA Cybersecurity Market Revenue Million Forecast, by Deployment 2019 & 2032
- Table 4: Global KSA Cybersecurity Market Revenue Million Forecast, by Organization Size 2019 & 2032
- Table 5: Global KSA Cybersecurity Market Revenue Million Forecast, by End User 2019 & 2032
- Table 6: Global KSA Cybersecurity Market Revenue Million Forecast, by Region 2019 & 2032
- Table 7: Global KSA Cybersecurity Market Revenue Million Forecast, by Country 2019 & 2032
- Table 8: KSA Cybersecurity Market Revenue (Million) Forecast, by Application 2019 & 2032
- Table 9: Global KSA Cybersecurity Market Revenue Million Forecast, by Country 2019 & 2032
- Table 10: KSA Cybersecurity Market Revenue (Million) Forecast, by Application 2019 & 2032
- Table 11: Global KSA Cybersecurity Market Revenue Million Forecast, by Country 2019 & 2032
- Table 12: KSA Cybersecurity Market Revenue (Million) Forecast, by Application 2019 & 2032
- Table 13: Global KSA Cybersecurity Market Revenue Million Forecast, by Country 2019 & 2032
- Table 14: KSA Cybersecurity Market Revenue (Million) Forecast, by Application 2019 & 2032
- Table 15: Global KSA Cybersecurity Market Revenue Million Forecast, by Offering 2019 & 2032
- Table 16: Global KSA Cybersecurity Market Revenue Million Forecast, by Deployment 2019 & 2032
- Table 17: Global KSA Cybersecurity Market Revenue Million Forecast, by Organization Size 2019 & 2032
- Table 18: Global KSA Cybersecurity Market Revenue Million Forecast, by End User 2019 & 2032
- Table 19: Global KSA Cybersecurity Market Revenue Million Forecast, by Country 2019 & 2032
- Table 20: United States KSA Cybersecurity Market Revenue (Million) Forecast, by Application 2019 & 2032
- Table 21: Canada KSA Cybersecurity Market Revenue (Million) Forecast, by Application 2019 & 2032
- Table 22: Mexico KSA Cybersecurity Market Revenue (Million) Forecast, by Application 2019 & 2032
- Table 23: Global KSA Cybersecurity Market Revenue Million Forecast, by Offering 2019 & 2032
- Table 24: Global KSA Cybersecurity Market Revenue Million Forecast, by Deployment 2019 & 2032
- Table 25: Global KSA Cybersecurity Market Revenue Million Forecast, by Organization Size 2019 & 2032
- Table 26: Global KSA Cybersecurity Market Revenue Million Forecast, by End User 2019 & 2032
- Table 27: Global KSA Cybersecurity Market Revenue Million Forecast, by Country 2019 & 2032
- Table 28: Brazil KSA Cybersecurity Market Revenue (Million) Forecast, by Application 2019 & 2032
- Table 29: Argentina KSA Cybersecurity Market Revenue (Million) Forecast, by Application 2019 & 2032
- Table 30: Rest of South America KSA Cybersecurity Market Revenue (Million) Forecast, by Application 2019 & 2032
- Table 31: Global KSA Cybersecurity Market Revenue Million Forecast, by Offering 2019 & 2032
- Table 32: Global KSA Cybersecurity Market Revenue Million Forecast, by Deployment 2019 & 2032
- Table 33: Global KSA Cybersecurity Market Revenue Million Forecast, by Organization Size 2019 & 2032
- Table 34: Global KSA Cybersecurity Market Revenue Million Forecast, by End User 2019 & 2032
- Table 35: Global KSA Cybersecurity Market Revenue Million Forecast, by Country 2019 & 2032
- Table 36: United Kingdom KSA Cybersecurity Market Revenue (Million) Forecast, by Application 2019 & 2032
- Table 37: Germany KSA Cybersecurity Market Revenue (Million) Forecast, by Application 2019 & 2032
- Table 38: France KSA Cybersecurity Market Revenue (Million) Forecast, by Application 2019 & 2032
- Table 39: Italy KSA Cybersecurity Market Revenue (Million) Forecast, by Application 2019 & 2032
- Table 40: Spain KSA Cybersecurity Market Revenue (Million) Forecast, by Application 2019 & 2032
- Table 41: Russia KSA Cybersecurity Market Revenue (Million) Forecast, by Application 2019 & 2032
- Table 42: Benelux KSA Cybersecurity Market Revenue (Million) Forecast, by Application 2019 & 2032
- Table 43: Nordics KSA Cybersecurity Market Revenue (Million) Forecast, by Application 2019 & 2032
- Table 44: Rest of Europe KSA Cybersecurity Market Revenue (Million) Forecast, by Application 2019 & 2032
- Table 45: Global KSA Cybersecurity Market Revenue Million Forecast, by Offering 2019 & 2032
- Table 46: Global KSA Cybersecurity Market Revenue Million Forecast, by Deployment 2019 & 2032
- Table 47: Global KSA Cybersecurity Market Revenue Million Forecast, by Organization Size 2019 & 2032
- Table 48: Global KSA Cybersecurity Market Revenue Million Forecast, by End User 2019 & 2032
- Table 49: Global KSA Cybersecurity Market Revenue Million Forecast, by Country 2019 & 2032
- Table 50: Turkey KSA Cybersecurity Market Revenue (Million) Forecast, by Application 2019 & 2032
- Table 51: Israel KSA Cybersecurity Market Revenue (Million) Forecast, by Application 2019 & 2032
- Table 52: GCC KSA Cybersecurity Market Revenue (Million) Forecast, by Application 2019 & 2032
- Table 53: North Africa KSA Cybersecurity Market Revenue (Million) Forecast, by Application 2019 & 2032
- Table 54: South Africa KSA Cybersecurity Market Revenue (Million) Forecast, by Application 2019 & 2032
- Table 55: Rest of Middle East & Africa KSA Cybersecurity Market Revenue (Million) Forecast, by Application 2019 & 2032
- Table 56: Global KSA Cybersecurity Market Revenue Million Forecast, by Offering 2019 & 2032
- Table 57: Global KSA Cybersecurity Market Revenue Million Forecast, by Deployment 2019 & 2032
- Table 58: Global KSA Cybersecurity Market Revenue Million Forecast, by Organization Size 2019 & 2032
- Table 59: Global KSA Cybersecurity Market Revenue Million Forecast, by End User 2019 & 2032
- Table 60: Global KSA Cybersecurity Market Revenue Million Forecast, by Country 2019 & 2032
- Table 61: China KSA Cybersecurity Market Revenue (Million) Forecast, by Application 2019 & 2032
- Table 62: India KSA Cybersecurity Market Revenue (Million) Forecast, by Application 2019 & 2032
- Table 63: Japan KSA Cybersecurity Market Revenue (Million) Forecast, by Application 2019 & 2032
- Table 64: South Korea KSA Cybersecurity Market Revenue (Million) Forecast, by Application 2019 & 2032
- Table 65: ASEAN KSA Cybersecurity Market Revenue (Million) Forecast, by Application 2019 & 2032
- Table 66: Oceania KSA Cybersecurity Market Revenue (Million) Forecast, by Application 2019 & 2032
- Table 67: Rest of Asia Pacific KSA Cybersecurity Market Revenue (Million) Forecast, by Application 2019 & 2032
Frequently Asked Questions
1. What is the projected Compound Annual Growth Rate (CAGR) of the KSA Cybersecurity Market?
The projected CAGR is approximately 13.78%.
2. Which companies are prominent players in the KSA Cybersecurity Market?
Key companies in the market include FireEye Inc, International Business Machine Corporation (IBM), Check Point Software Technologies Ltd, Al Moammar Information Systems Co (MIS), Hewlett Packard Enterprise Development LP*List Not Exhaustive, Tenable Inc, Cisco Systems Inc, Salesforce com Inc, FORTINET INC, NortonLifeLock Inc, Dell Technologies Inc, McAfee Corporation, Palo Alto Networks Inc.
3. What are the main segments of the KSA Cybersecurity Market?
The market segments include Offering, Deployment, Organization Size, End User.
4. Can you provide details about the market size?
The market size is estimated to be USD 0.63 Million as of 2022.
5. What are some drivers contributing to market growth?
Increasing Demand for Digitalization and Scalable IT Infrastructure; Need to tackle risks from various trends such as third-party vendor risks. the evolution of MSSPs. and adoption of cloud-first strategy.
6. What are the notable trends driving market growth?
Growing usage of the Cloud Services across the region.
7. Are there any restraints impacting market growth?
Lack of Cybersecurity Professionals; High Reliance on Traditional Authentication Methods and Low Preparedness.
8. Can you provide examples of recent developments in the market?
July 2022 - Cisco has launched a secure cloud that uses an open shared signals and events framework for swift sharing of data between vendors, making the work of security analysts simpler, along with Talos Intel On-Demand, which customizes research according to every organization's unique threat landscape. Its Secure Firewall 3100 series introduces AI and machine learning to the mix for detecting threats.
9. What pricing options are available for accessing the report?
Pricing options include single-user, multi-user, and enterprise licenses priced at USD 3800, USD 4500, and USD 5800 respectively.
10. Is the market size provided in terms of value or volume?
The market size is provided in terms of value, measured in Million.
11. Are there any specific market keywords associated with the report?
Yes, the market keyword associated with the report is "KSA Cybersecurity Market," which aids in identifying and referencing the specific market segment covered.
12. How do I determine which pricing option suits my needs best?
The pricing options vary based on user requirements and access needs. Individual users may opt for single-user licenses, while businesses requiring broader access may choose multi-user or enterprise licenses for cost-effective access to the report.
13. Are there any additional resources or data provided in the KSA Cybersecurity Market report?
While the report offers comprehensive insights, it's advisable to review the specific contents or supplementary materials provided to ascertain if additional resources or data are available.
14. How can I stay updated on further developments or reports in the KSA Cybersecurity Market?
To stay informed about further developments, trends, and reports in the KSA Cybersecurity Market, consider subscribing to industry newsletters, following relevant companies and organizations, or regularly checking reputable industry news sources and publications.
Methodology
Step 1 - Identification of Relevant Samples Size from Population Database


Step 2 - Approaches for Defining Global Market Size (Value, Volume* & Price*)

Note*: In applicable scenarios
Step 3 - Data Sources
Primary Research
- Web Analytics
- Survey Reports
- Research Institute
- Latest Research Reports
- Opinion Leaders
Secondary Research
- Annual Reports
- White Paper
- Latest Press Release
- Industry Association
- Paid Database
- Investor Presentations

Step 4 - Data Triangulation
Involves using different sources of information in order to increase the validity of a study
These sources are likely to be stakeholders in a program - participants, other researchers, program staff, other community members, and so on.
Then we put all data in single framework & apply various statistical tools to find out the dynamic on the market.
During the analysis stage, feedback from the stakeholder groups would be compared to determine areas of agreement as well as areas of divergence


