
Key Insights
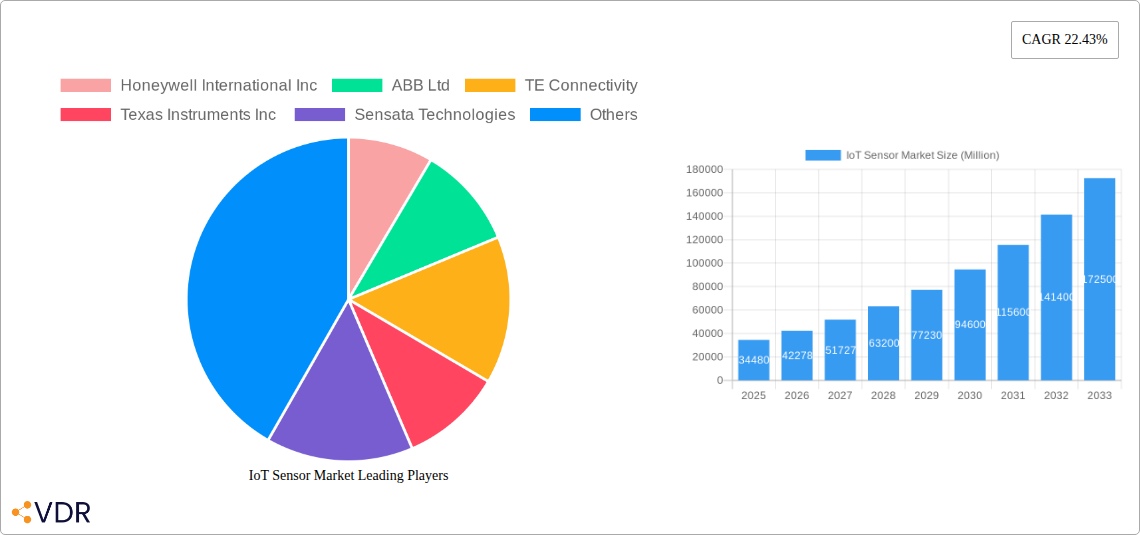
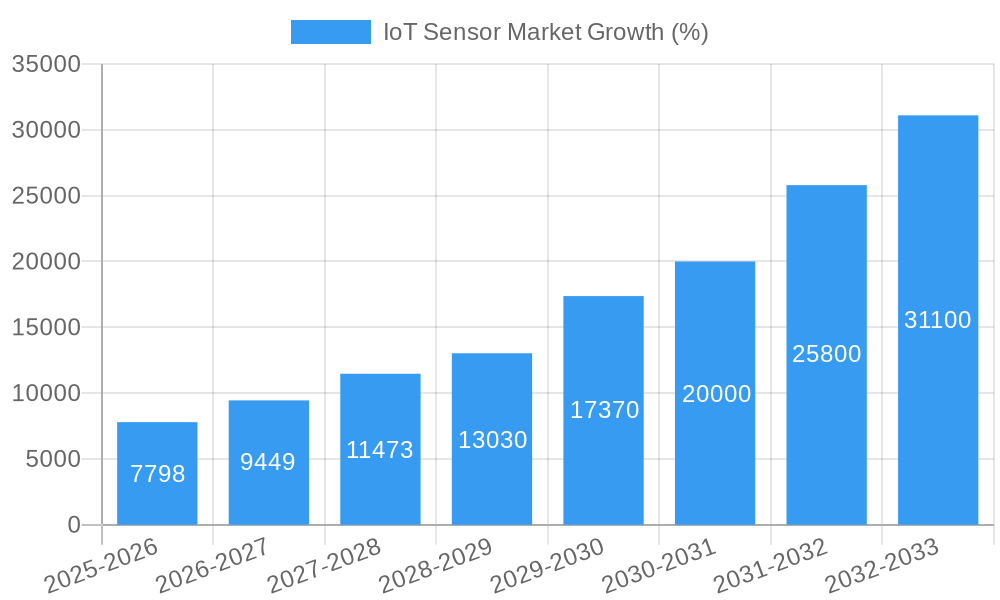
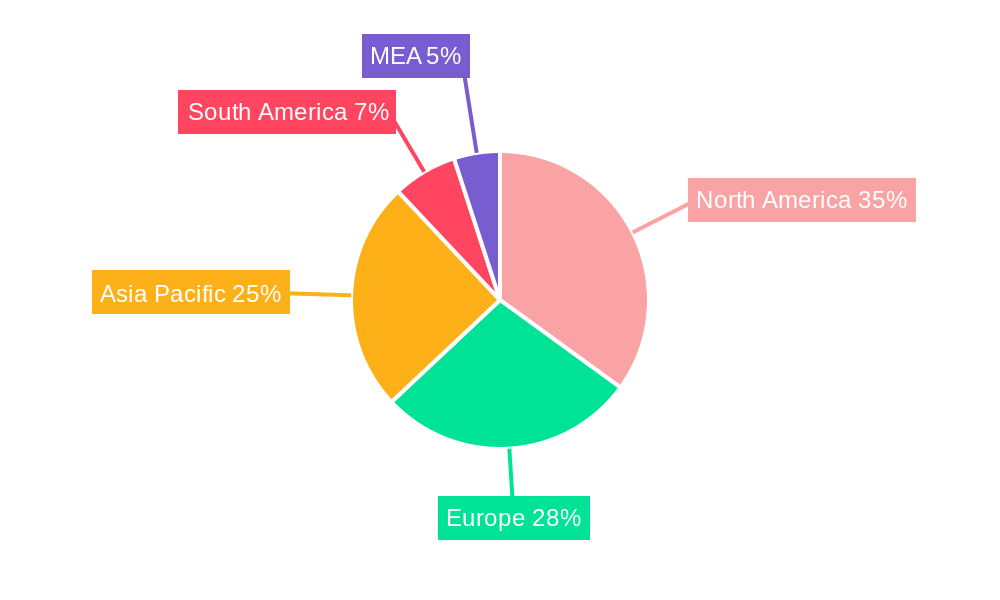
The global IoT sensor market is experiencing robust growth, projected to reach \$34.48 billion in 2025 and exhibiting a compound annual growth rate (CAGR) of 22.43% from 2025 to 2033. This expansion is fueled by several key drivers. The increasing adoption of smart devices and the Internet of Things (IoT) across diverse sectors like healthcare, automotive, and manufacturing is a primary catalyst. Advancements in sensor technology, including miniaturization, improved accuracy, and lower power consumption, are further enhancing market appeal. The rising demand for real-time data analytics and predictive maintenance in industrial settings is also contributing significantly. Specific growth segments include pressure, temperature, and chemical sensors, driven by their critical roles in various applications. The healthcare sector's adoption of wearable technology and remote patient monitoring systems is particularly noteworthy. Geographic growth is expected to be robust across regions, with North America and Asia Pacific anticipated as major contributors due to their advanced technological infrastructure and significant investments in IoT initiatives.
Despite the promising outlook, certain challenges hinder market growth. High initial investment costs associated with IoT sensor deployment and integration can be a deterrent for some businesses, especially smaller enterprises. Concerns regarding data security and privacy in interconnected systems also need to be addressed. However, ongoing technological advancements, decreasing sensor costs, and increasing government support for IoT adoption are likely to mitigate these constraints. The market is likely to see further fragmentation with the entry of new players in the niche areas, increasing competition and further technological improvements. The continuous development of low-power, long-range communication technologies will also contribute to the overall growth in the coming years. Competitive landscape will evolve rapidly with industry giants and specialized players vying for market share.
IoT Sensor Market: A Comprehensive Market Report (2019-2033)
This comprehensive report provides an in-depth analysis of the IoT sensor market, encompassing market dynamics, growth trends, regional dominance, product landscape, key challenges, emerging opportunities, growth accelerators, key players, and notable milestones. The study period covers 2019-2033, with 2025 as the base and estimated year. The forecast period spans 2025-2033, and the historical period includes 2019-2024. The market is segmented by type (Pressure, Temperature, Chemical, Motion/Proximity, Other Types) and end-user (Healthcare, Automotive and Transportation, Manufacturing/Industrial, Other End Users). Key players analyzed include Honeywell International Inc, ABB Ltd, TE Connectivity, Texas Instruments Inc, Sensata Technologies, Schneider Electric SE, STMicroelectronics NV, Robert Bosch GmbH, OMRON Corporation, and TDK Corporation. The market size is presented in million units.
IoT Sensor Market Dynamics & Structure
The IoT sensor market exhibits a moderately concentrated structure, with a few major players holding significant market share. Technological innovation, particularly in low-power wide-area networks (LPWAN) and advanced sensor technologies, is a primary growth driver. Stringent regulatory frameworks regarding data privacy and security present both challenges and opportunities. Competitive substitutes include traditional monitoring systems, but IoT sensors offer superior data granularity and real-time insights. End-user demographics are shifting towards increased adoption across diverse sectors, including smart homes, industrial automation, and precision agriculture. M&A activity is moderate, with strategic acquisitions aiming to expand product portfolios and geographical reach.
- Market Concentration: xx% held by top 5 players (2024).
- Technological Innovation: Focus on miniaturization, improved accuracy, and energy efficiency.
- Regulatory Landscape: Growing emphasis on data security and compliance standards.
- Competitive Substitutes: Traditional monitoring systems face increasing competition.
- M&A Activity: xx deals in the last 5 years, primarily focused on technology acquisition and geographic expansion.
IoT Sensor Market Growth Trends & Insights
The IoT sensor market has witnessed robust growth during the historical period (2019-2024), driven by the increasing adoption of smart devices and the rise of Industry 4.0. Market size reached xx million units in 2024, and is projected to reach xx million units by 2033, exhibiting a CAGR of xx% during the forecast period (2025-2033). Technological disruptions, such as the development of advanced sensor technologies like MEMS and nanotechnology sensors, are accelerating market growth. Shifting consumer behavior towards smart homes, connected cars, and personalized healthcare services further fuel demand. Adoption rates are highest in developed regions, but emerging markets are showing significant growth potential.
Dominant Regions, Countries, or Segments in IoT Sensor Market
The Manufacturing/Industrial sector currently dominates the IoT sensor market, accounting for xx% of the total market share in 2024. Within this sector, demand for pressure and temperature sensors is particularly high, driven by the need for real-time process monitoring and optimization. The North American and European regions currently lead in terms of market size and adoption, fueled by mature industrial infrastructure and advanced technological capabilities. However, the Asia-Pacific region is expected to experience the fastest growth in the coming years, driven by rapid industrialization and increasing government initiatives promoting IoT adoption.
- Key Drivers (Manufacturing/Industrial): Automation needs, predictive maintenance, improved efficiency.
- Key Drivers (North America): Advanced manufacturing capabilities, early adoption of IoT technologies.
- Growth Potential (Asia-Pacific): Rapid industrialization, expanding infrastructure development.
IoT Sensor Market Product Landscape
The IoT sensor market is characterized by a diverse range of products, each catering to specific needs and applications. Recent innovations focus on enhanced energy efficiency, smaller form factors, improved accuracy, and wireless connectivity options, including LPWAN technologies such as LoRaWAN and NB-IoT. Sensors are integrated into various devices and systems, enabling real-time data collection and analysis across a wide array of applications including smart homes, industrial automation, and healthcare monitoring. Unique selling propositions frequently include features like extended battery life, data encryption, and cloud connectivity.
Key Drivers, Barriers & Challenges in IoT Sensor Market
Key Drivers: Increasing demand for real-time data, advancements in sensor technology, and the growth of cloud computing and big data analytics are driving market growth. Government initiatives promoting digitalization and smart city development further fuel market expansion.
Key Challenges: High initial investment costs, data security concerns, and interoperability issues between different sensor technologies present significant barriers to adoption. Supply chain disruptions and the lack of skilled workforce further hinder market growth. Competition from established players and new entrants also impacts market dynamics.
Emerging Opportunities in IoT Sensor Market
The growing adoption of AI and machine learning (ML) in IoT sensor applications offers significant opportunities for growth. Untapped markets in developing economies and innovative applications, such as smart agriculture and environmental monitoring, present further potential. The shift towards edge computing and the integration of IoT sensors with other technologies, like blockchain, offer new avenues for value creation.
Growth Accelerators in the IoT Sensor Market Industry
Technological breakthroughs, such as the development of low-power, long-range wireless technologies and AI-powered analytics, are crucial growth catalysts. Strategic partnerships between sensor manufacturers, software providers, and system integrators facilitate market expansion. Increased investment in R&D, coupled with government support for IoT initiatives, further accelerate market growth. The emergence of new applications and services built upon IoT sensor data drives continued market expansion.
Key Players Shaping the IoT Sensor Market Market
- Honeywell International Inc
- ABB Ltd
- TE Connectivity
- Texas Instruments Inc
- Sensata Technologies
- Schneider Electric SE
- STMicroelectronics NV
- Robert Bosch GmbH
- OMRON Corporation
- TDK Corporation
Notable Milestones in IoT Sensor Market Sector
- September 2021: Heijman deploys 20,000 LoRaWAN sensors for smart building management in the Netherlands. This highlights the growing adoption of LPWAN technologies in large-scale deployments.
- August 2021: Bouchaine Vineyards integrates Cisco sensors for precision viticulture, demonstrating the expansion of IoT into agriculture.
- September 2020: Amazon launches a Ring mailbox sensor, showcasing the increasing penetration of IoT sensors in consumer applications.
In-Depth IoT Sensor Market Market Outlook
The IoT sensor market is poised for sustained growth, driven by continuous technological advancements and the expanding adoption of IoT across various industries. Future market potential lies in the development of highly integrated, intelligent sensors capable of sophisticated data analysis and decision-making at the edge. Strategic partnerships and the development of robust ecosystem will play a crucial role in unlocking future opportunities, ensuring secure and reliable IoT deployments across diverse sectors.
IoT Sensor Market Segmentation
-
1. Type
- 1.1. Pressure
- 1.2. Temperature
- 1.3. Chemical
- 1.4. Motion/Proximity
- 1.5. Other Types
-
2. End User
- 2.1. Healthcare
- 2.2. Automotive and Transportation
- 2.3. Manufacturing / Industrial
- 2.4. Other End Users
IoT Sensor Market Segmentation By Geography
-
1. North America
- 1.1. United States
- 1.2. Canada
-
2. Europe
- 2.1. United Kingdom
- 2.2. France
- 2.3. Germany
- 2.4. Rest of Europe
-
3. Asia Pacific
- 3.1. China
- 3.2. Japan
- 3.3. South Korea
- 3.4. India
- 3.5. Rest of the Asia Pacific
-
4. Rest of the World
- 4.1. Latin America
- 4.2. Middle East
IoT Sensor Market REPORT HIGHLIGHTS
| Aspects | Details |
|---|---|
| Study Period | 2019-2033 |
| Base Year | 2024 |
| Estimated Year | 2025 |
| Forecast Period | 2025-2033 |
| Historical Period | 2019-2024 |
| Growth Rate | CAGR of 22.43% from 2019-2033 |
| Segmentation |
|
Table of Contents
- 1. Introduction
- 1.1. Research Scope
- 1.2. Market Segmentation
- 1.3. Research Methodology
- 1.4. Definitions and Assumptions
- 2. Executive Summary
- 2.1. Introduction
- 3. Market Dynamics
- 3.1. Introduction
- 3.2. Market Drivers
- 3.2.1. Rising use of IoT sensors due to reduced cost and size; Increasing applications of Industry 4.0 and connected devices
- 3.3. Market Restrains
- 3.3.1. Rising concerns related to data security
- 3.4. Market Trends
- 3.4.1. Automotive and Transportation Industry to Drive the Market Growth
- 4. Market Factor Analysis
- 4.1. Porters Five Forces
- 4.2. Supply/Value Chain
- 4.3. PESTEL analysis
- 4.4. Market Entropy
- 4.5. Patent/Trademark Analysis
- 5. Global IoT Sensor Market Analysis, Insights and Forecast, 2019-2031
- 5.1. Market Analysis, Insights and Forecast - by Type
- 5.1.1. Pressure
- 5.1.2. Temperature
- 5.1.3. Chemical
- 5.1.4. Motion/Proximity
- 5.1.5. Other Types
- 5.2. Market Analysis, Insights and Forecast - by End User
- 5.2.1. Healthcare
- 5.2.2. Automotive and Transportation
- 5.2.3. Manufacturing / Industrial
- 5.2.4. Other End Users
- 5.3. Market Analysis, Insights and Forecast - by Region
- 5.3.1. North America
- 5.3.2. Europe
- 5.3.3. Asia Pacific
- 5.3.4. Rest of the World
- 5.1. Market Analysis, Insights and Forecast - by Type
- 6. North America IoT Sensor Market Analysis, Insights and Forecast, 2019-2031
- 6.1. Market Analysis, Insights and Forecast - by Type
- 6.1.1. Pressure
- 6.1.2. Temperature
- 6.1.3. Chemical
- 6.1.4. Motion/Proximity
- 6.1.5. Other Types
- 6.2. Market Analysis, Insights and Forecast - by End User
- 6.2.1. Healthcare
- 6.2.2. Automotive and Transportation
- 6.2.3. Manufacturing / Industrial
- 6.2.4. Other End Users
- 6.1. Market Analysis, Insights and Forecast - by Type
- 7. Europe IoT Sensor Market Analysis, Insights and Forecast, 2019-2031
- 7.1. Market Analysis, Insights and Forecast - by Type
- 7.1.1. Pressure
- 7.1.2. Temperature
- 7.1.3. Chemical
- 7.1.4. Motion/Proximity
- 7.1.5. Other Types
- 7.2. Market Analysis, Insights and Forecast - by End User
- 7.2.1. Healthcare
- 7.2.2. Automotive and Transportation
- 7.2.3. Manufacturing / Industrial
- 7.2.4. Other End Users
- 7.1. Market Analysis, Insights and Forecast - by Type
- 8. Asia Pacific IoT Sensor Market Analysis, Insights and Forecast, 2019-2031
- 8.1. Market Analysis, Insights and Forecast - by Type
- 8.1.1. Pressure
- 8.1.2. Temperature
- 8.1.3. Chemical
- 8.1.4. Motion/Proximity
- 8.1.5. Other Types
- 8.2. Market Analysis, Insights and Forecast - by End User
- 8.2.1. Healthcare
- 8.2.2. Automotive and Transportation
- 8.2.3. Manufacturing / Industrial
- 8.2.4. Other End Users
- 8.1. Market Analysis, Insights and Forecast - by Type
- 9. Rest of the World IoT Sensor Market Analysis, Insights and Forecast, 2019-2031
- 9.1. Market Analysis, Insights and Forecast - by Type
- 9.1.1. Pressure
- 9.1.2. Temperature
- 9.1.3. Chemical
- 9.1.4. Motion/Proximity
- 9.1.5. Other Types
- 9.2. Market Analysis, Insights and Forecast - by End User
- 9.2.1. Healthcare
- 9.2.2. Automotive and Transportation
- 9.2.3. Manufacturing / Industrial
- 9.2.4. Other End Users
- 9.1. Market Analysis, Insights and Forecast - by Type
- 10. North America IoT Sensor Market Analysis, Insights and Forecast, 2019-2031
- 10.1. Market Analysis, Insights and Forecast - By Country/Sub-region
- 10.1.1. undefined
- 11. Europe IoT Sensor Market Analysis, Insights and Forecast, 2019-2031
- 11.1. Market Analysis, Insights and Forecast - By Country/Sub-region
- 11.1.1. undefined
- 12. Asia Pacific IoT Sensor Market Analysis, Insights and Forecast, 2019-2031
- 12.1. Market Analysis, Insights and Forecast - By Country/Sub-region
- 12.1.1. undefined
- 13. South America IoT Sensor Market Analysis, Insights and Forecast, 2019-2031
- 13.1. Market Analysis, Insights and Forecast - By Country/Sub-region
- 13.1.1. undefined
- 14. North America IoT Sensor Market Analysis, Insights and Forecast, 2019-2031
- 14.1. Market Analysis, Insights and Forecast - By Country/Sub-region
- 14.1.1. undefined
- 15. MEA IoT Sensor Market Analysis, Insights and Forecast, 2019-2031
- 15.1. Market Analysis, Insights and Forecast - By Country/Sub-region
- 15.1.1. undefined
- 16. Competitive Analysis
- 16.1. Global Market Share Analysis 2024
- 16.2. Company Profiles
- 16.2.1 Honeywell International Inc
- 16.2.1.1. Overview
- 16.2.1.2. Products
- 16.2.1.3. SWOT Analysis
- 16.2.1.4. Recent Developments
- 16.2.1.5. Financials (Based on Availability)
- 16.2.2 ABB Ltd
- 16.2.2.1. Overview
- 16.2.2.2. Products
- 16.2.2.3. SWOT Analysis
- 16.2.2.4. Recent Developments
- 16.2.2.5. Financials (Based on Availability)
- 16.2.3 TE Connectivity
- 16.2.3.1. Overview
- 16.2.3.2. Products
- 16.2.3.3. SWOT Analysis
- 16.2.3.4. Recent Developments
- 16.2.3.5. Financials (Based on Availability)
- 16.2.4 Texas Instruments Inc
- 16.2.4.1. Overview
- 16.2.4.2. Products
- 16.2.4.3. SWOT Analysis
- 16.2.4.4. Recent Developments
- 16.2.4.5. Financials (Based on Availability)
- 16.2.5 Sensata Technologies
- 16.2.5.1. Overview
- 16.2.5.2. Products
- 16.2.5.3. SWOT Analysis
- 16.2.5.4. Recent Developments
- 16.2.5.5. Financials (Based on Availability)
- 16.2.6 Schneider Electric SE
- 16.2.6.1. Overview
- 16.2.6.2. Products
- 16.2.6.3. SWOT Analysis
- 16.2.6.4. Recent Developments
- 16.2.6.5. Financials (Based on Availability)
- 16.2.7 STMicroelectronics NV
- 16.2.7.1. Overview
- 16.2.7.2. Products
- 16.2.7.3. SWOT Analysis
- 16.2.7.4. Recent Developments
- 16.2.7.5. Financials (Based on Availability)
- 16.2.8 Robert Bosch GmbH
- 16.2.8.1. Overview
- 16.2.8.2. Products
- 16.2.8.3. SWOT Analysis
- 16.2.8.4. Recent Developments
- 16.2.8.5. Financials (Based on Availability)
- 16.2.9 OMRON Corporation
- 16.2.9.1. Overview
- 16.2.9.2. Products
- 16.2.9.3. SWOT Analysis
- 16.2.9.4. Recent Developments
- 16.2.9.5. Financials (Based on Availability)
- 16.2.10 TDK Corporation
- 16.2.10.1. Overview
- 16.2.10.2. Products
- 16.2.10.3. SWOT Analysis
- 16.2.10.4. Recent Developments
- 16.2.10.5. Financials (Based on Availability)
- 16.2.1 Honeywell International Inc
List of Figures
- Figure 1: Global IoT Sensor Market Revenue Breakdown (Million, %) by Region 2024 & 2032
- Figure 2: Global IoT Sensor Market Volume Breakdown (K Unit, %) by Region 2024 & 2032
- Figure 3: North America IoT Sensor Market Revenue (Million), by Country 2024 & 2032
- Figure 4: North America IoT Sensor Market Volume (K Unit), by Country 2024 & 2032
- Figure 5: North America IoT Sensor Market Revenue Share (%), by Country 2024 & 2032
- Figure 6: North America IoT Sensor Market Volume Share (%), by Country 2024 & 2032
- Figure 7: Europe IoT Sensor Market Revenue (Million), by Country 2024 & 2032
- Figure 8: Europe IoT Sensor Market Volume (K Unit), by Country 2024 & 2032
- Figure 9: Europe IoT Sensor Market Revenue Share (%), by Country 2024 & 2032
- Figure 10: Europe IoT Sensor Market Volume Share (%), by Country 2024 & 2032
- Figure 11: Asia Pacific IoT Sensor Market Revenue (Million), by Country 2024 & 2032
- Figure 12: Asia Pacific IoT Sensor Market Volume (K Unit), by Country 2024 & 2032
- Figure 13: Asia Pacific IoT Sensor Market Revenue Share (%), by Country 2024 & 2032
- Figure 14: Asia Pacific IoT Sensor Market Volume Share (%), by Country 2024 & 2032
- Figure 15: South America IoT Sensor Market Revenue (Million), by Country 2024 & 2032
- Figure 16: South America IoT Sensor Market Volume (K Unit), by Country 2024 & 2032
- Figure 17: South America IoT Sensor Market Revenue Share (%), by Country 2024 & 2032
- Figure 18: South America IoT Sensor Market Volume Share (%), by Country 2024 & 2032
- Figure 19: North America IoT Sensor Market Revenue (Million), by Country 2024 & 2032
- Figure 20: North America IoT Sensor Market Volume (K Unit), by Country 2024 & 2032
- Figure 21: North America IoT Sensor Market Revenue Share (%), by Country 2024 & 2032
- Figure 22: North America IoT Sensor Market Volume Share (%), by Country 2024 & 2032
- Figure 23: MEA IoT Sensor Market Revenue (Million), by Country 2024 & 2032
- Figure 24: MEA IoT Sensor Market Volume (K Unit), by Country 2024 & 2032
- Figure 25: MEA IoT Sensor Market Revenue Share (%), by Country 2024 & 2032
- Figure 26: MEA IoT Sensor Market Volume Share (%), by Country 2024 & 2032
- Figure 27: North America IoT Sensor Market Revenue (Million), by Type 2024 & 2032
- Figure 28: North America IoT Sensor Market Volume (K Unit), by Type 2024 & 2032
- Figure 29: North America IoT Sensor Market Revenue Share (%), by Type 2024 & 2032
- Figure 30: North America IoT Sensor Market Volume Share (%), by Type 2024 & 2032
- Figure 31: North America IoT Sensor Market Revenue (Million), by End User 2024 & 2032
- Figure 32: North America IoT Sensor Market Volume (K Unit), by End User 2024 & 2032
- Figure 33: North America IoT Sensor Market Revenue Share (%), by End User 2024 & 2032
- Figure 34: North America IoT Sensor Market Volume Share (%), by End User 2024 & 2032
- Figure 35: North America IoT Sensor Market Revenue (Million), by Country 2024 & 2032
- Figure 36: North America IoT Sensor Market Volume (K Unit), by Country 2024 & 2032
- Figure 37: North America IoT Sensor Market Revenue Share (%), by Country 2024 & 2032
- Figure 38: North America IoT Sensor Market Volume Share (%), by Country 2024 & 2032
- Figure 39: Europe IoT Sensor Market Revenue (Million), by Type 2024 & 2032
- Figure 40: Europe IoT Sensor Market Volume (K Unit), by Type 2024 & 2032
- Figure 41: Europe IoT Sensor Market Revenue Share (%), by Type 2024 & 2032
- Figure 42: Europe IoT Sensor Market Volume Share (%), by Type 2024 & 2032
- Figure 43: Europe IoT Sensor Market Revenue (Million), by End User 2024 & 2032
- Figure 44: Europe IoT Sensor Market Volume (K Unit), by End User 2024 & 2032
- Figure 45: Europe IoT Sensor Market Revenue Share (%), by End User 2024 & 2032
- Figure 46: Europe IoT Sensor Market Volume Share (%), by End User 2024 & 2032
- Figure 47: Europe IoT Sensor Market Revenue (Million), by Country 2024 & 2032
- Figure 48: Europe IoT Sensor Market Volume (K Unit), by Country 2024 & 2032
- Figure 49: Europe IoT Sensor Market Revenue Share (%), by Country 2024 & 2032
- Figure 50: Europe IoT Sensor Market Volume Share (%), by Country 2024 & 2032
- Figure 51: Asia Pacific IoT Sensor Market Revenue (Million), by Type 2024 & 2032
- Figure 52: Asia Pacific IoT Sensor Market Volume (K Unit), by Type 2024 & 2032
- Figure 53: Asia Pacific IoT Sensor Market Revenue Share (%), by Type 2024 & 2032
- Figure 54: Asia Pacific IoT Sensor Market Volume Share (%), by Type 2024 & 2032
- Figure 55: Asia Pacific IoT Sensor Market Revenue (Million), by End User 2024 & 2032
- Figure 56: Asia Pacific IoT Sensor Market Volume (K Unit), by End User 2024 & 2032
- Figure 57: Asia Pacific IoT Sensor Market Revenue Share (%), by End User 2024 & 2032
- Figure 58: Asia Pacific IoT Sensor Market Volume Share (%), by End User 2024 & 2032
- Figure 59: Asia Pacific IoT Sensor Market Revenue (Million), by Country 2024 & 2032
- Figure 60: Asia Pacific IoT Sensor Market Volume (K Unit), by Country 2024 & 2032
- Figure 61: Asia Pacific IoT Sensor Market Revenue Share (%), by Country 2024 & 2032
- Figure 62: Asia Pacific IoT Sensor Market Volume Share (%), by Country 2024 & 2032
- Figure 63: Rest of the World IoT Sensor Market Revenue (Million), by Type 2024 & 2032
- Figure 64: Rest of the World IoT Sensor Market Volume (K Unit), by Type 2024 & 2032
- Figure 65: Rest of the World IoT Sensor Market Revenue Share (%), by Type 2024 & 2032
- Figure 66: Rest of the World IoT Sensor Market Volume Share (%), by Type 2024 & 2032
- Figure 67: Rest of the World IoT Sensor Market Revenue (Million), by End User 2024 & 2032
- Figure 68: Rest of the World IoT Sensor Market Volume (K Unit), by End User 2024 & 2032
- Figure 69: Rest of the World IoT Sensor Market Revenue Share (%), by End User 2024 & 2032
- Figure 70: Rest of the World IoT Sensor Market Volume Share (%), by End User 2024 & 2032
- Figure 71: Rest of the World IoT Sensor Market Revenue (Million), by Country 2024 & 2032
- Figure 72: Rest of the World IoT Sensor Market Volume (K Unit), by Country 2024 & 2032
- Figure 73: Rest of the World IoT Sensor Market Revenue Share (%), by Country 2024 & 2032
- Figure 74: Rest of the World IoT Sensor Market Volume Share (%), by Country 2024 & 2032
List of Tables
- Table 1: Global IoT Sensor Market Revenue Million Forecast, by Region 2019 & 2032
- Table 2: Global IoT Sensor Market Volume K Unit Forecast, by Region 2019 & 2032
- Table 3: Global IoT Sensor Market Revenue Million Forecast, by Type 2019 & 2032
- Table 4: Global IoT Sensor Market Volume K Unit Forecast, by Type 2019 & 2032
- Table 5: Global IoT Sensor Market Revenue Million Forecast, by End User 2019 & 2032
- Table 6: Global IoT Sensor Market Volume K Unit Forecast, by End User 2019 & 2032
- Table 7: Global IoT Sensor Market Revenue Million Forecast, by Region 2019 & 2032
- Table 8: Global IoT Sensor Market Volume K Unit Forecast, by Region 2019 & 2032
- Table 9: Global IoT Sensor Market Revenue Million Forecast, by Country 2019 & 2032
- Table 10: Global IoT Sensor Market Volume K Unit Forecast, by Country 2019 & 2032
- Table 11: Global IoT Sensor Market Revenue Million Forecast, by Country 2019 & 2032
- Table 12: Global IoT Sensor Market Volume K Unit Forecast, by Country 2019 & 2032
- Table 13: Global IoT Sensor Market Revenue Million Forecast, by Country 2019 & 2032
- Table 14: Global IoT Sensor Market Volume K Unit Forecast, by Country 2019 & 2032
- Table 15: Global IoT Sensor Market Revenue Million Forecast, by Country 2019 & 2032
- Table 16: Global IoT Sensor Market Volume K Unit Forecast, by Country 2019 & 2032
- Table 17: Global IoT Sensor Market Revenue Million Forecast, by Country 2019 & 2032
- Table 18: Global IoT Sensor Market Volume K Unit Forecast, by Country 2019 & 2032
- Table 19: Global IoT Sensor Market Revenue Million Forecast, by Country 2019 & 2032
- Table 20: Global IoT Sensor Market Volume K Unit Forecast, by Country 2019 & 2032
- Table 21: Global IoT Sensor Market Revenue Million Forecast, by Type 2019 & 2032
- Table 22: Global IoT Sensor Market Volume K Unit Forecast, by Type 2019 & 2032
- Table 23: Global IoT Sensor Market Revenue Million Forecast, by End User 2019 & 2032
- Table 24: Global IoT Sensor Market Volume K Unit Forecast, by End User 2019 & 2032
- Table 25: Global IoT Sensor Market Revenue Million Forecast, by Country 2019 & 2032
- Table 26: Global IoT Sensor Market Volume K Unit Forecast, by Country 2019 & 2032
- Table 27: United States IoT Sensor Market Revenue (Million) Forecast, by Application 2019 & 2032
- Table 28: United States IoT Sensor Market Volume (K Unit) Forecast, by Application 2019 & 2032
- Table 29: Canada IoT Sensor Market Revenue (Million) Forecast, by Application 2019 & 2032
- Table 30: Canada IoT Sensor Market Volume (K Unit) Forecast, by Application 2019 & 2032
- Table 31: Global IoT Sensor Market Revenue Million Forecast, by Type 2019 & 2032
- Table 32: Global IoT Sensor Market Volume K Unit Forecast, by Type 2019 & 2032
- Table 33: Global IoT Sensor Market Revenue Million Forecast, by End User 2019 & 2032
- Table 34: Global IoT Sensor Market Volume K Unit Forecast, by End User 2019 & 2032
- Table 35: Global IoT Sensor Market Revenue Million Forecast, by Country 2019 & 2032
- Table 36: Global IoT Sensor Market Volume K Unit Forecast, by Country 2019 & 2032
- Table 37: United Kingdom IoT Sensor Market Revenue (Million) Forecast, by Application 2019 & 2032
- Table 38: United Kingdom IoT Sensor Market Volume (K Unit) Forecast, by Application 2019 & 2032
- Table 39: France IoT Sensor Market Revenue (Million) Forecast, by Application 2019 & 2032
- Table 40: France IoT Sensor Market Volume (K Unit) Forecast, by Application 2019 & 2032
- Table 41: Germany IoT Sensor Market Revenue (Million) Forecast, by Application 2019 & 2032
- Table 42: Germany IoT Sensor Market Volume (K Unit) Forecast, by Application 2019 & 2032
- Table 43: Rest of Europe IoT Sensor Market Revenue (Million) Forecast, by Application 2019 & 2032
- Table 44: Rest of Europe IoT Sensor Market Volume (K Unit) Forecast, by Application 2019 & 2032
- Table 45: Global IoT Sensor Market Revenue Million Forecast, by Type 2019 & 2032
- Table 46: Global IoT Sensor Market Volume K Unit Forecast, by Type 2019 & 2032
- Table 47: Global IoT Sensor Market Revenue Million Forecast, by End User 2019 & 2032
- Table 48: Global IoT Sensor Market Volume K Unit Forecast, by End User 2019 & 2032
- Table 49: Global IoT Sensor Market Revenue Million Forecast, by Country 2019 & 2032
- Table 50: Global IoT Sensor Market Volume K Unit Forecast, by Country 2019 & 2032
- Table 51: China IoT Sensor Market Revenue (Million) Forecast, by Application 2019 & 2032
- Table 52: China IoT Sensor Market Volume (K Unit) Forecast, by Application 2019 & 2032
- Table 53: Japan IoT Sensor Market Revenue (Million) Forecast, by Application 2019 & 2032
- Table 54: Japan IoT Sensor Market Volume (K Unit) Forecast, by Application 2019 & 2032
- Table 55: South Korea IoT Sensor Market Revenue (Million) Forecast, by Application 2019 & 2032
- Table 56: South Korea IoT Sensor Market Volume (K Unit) Forecast, by Application 2019 & 2032
- Table 57: India IoT Sensor Market Revenue (Million) Forecast, by Application 2019 & 2032
- Table 58: India IoT Sensor Market Volume (K Unit) Forecast, by Application 2019 & 2032
- Table 59: Rest of the Asia Pacific IoT Sensor Market Revenue (Million) Forecast, by Application 2019 & 2032
- Table 60: Rest of the Asia Pacific IoT Sensor Market Volume (K Unit) Forecast, by Application 2019 & 2032
- Table 61: Global IoT Sensor Market Revenue Million Forecast, by Type 2019 & 2032
- Table 62: Global IoT Sensor Market Volume K Unit Forecast, by Type 2019 & 2032
- Table 63: Global IoT Sensor Market Revenue Million Forecast, by End User 2019 & 2032
- Table 64: Global IoT Sensor Market Volume K Unit Forecast, by End User 2019 & 2032
- Table 65: Global IoT Sensor Market Revenue Million Forecast, by Country 2019 & 2032
- Table 66: Global IoT Sensor Market Volume K Unit Forecast, by Country 2019 & 2032
- Table 67: Latin America IoT Sensor Market Revenue (Million) Forecast, by Application 2019 & 2032
- Table 68: Latin America IoT Sensor Market Volume (K Unit) Forecast, by Application 2019 & 2032
- Table 69: Middle East IoT Sensor Market Revenue (Million) Forecast, by Application 2019 & 2032
- Table 70: Middle East IoT Sensor Market Volume (K Unit) Forecast, by Application 2019 & 2032
Frequently Asked Questions
1. What is the projected Compound Annual Growth Rate (CAGR) of the IoT Sensor Market?
The projected CAGR is approximately 22.43%.
2. Which companies are prominent players in the IoT Sensor Market?
Key companies in the market include Honeywell International Inc, ABB Ltd, TE Connectivity, Texas Instruments Inc , Sensata Technologies, Schneider Electric SE, STMicroelectronics NV, Robert Bosch GmbH, OMRON Corporation, TDK Corporation.
3. What are the main segments of the IoT Sensor Market?
The market segments include Type, End User.
4. Can you provide details about the market size?
The market size is estimated to be USD 34.48 Million as of 2022.
5. What are some drivers contributing to market growth?
Rising use of IoT sensors due to reduced cost and size; Increasing applications of Industry 4.0 and connected devices.
6. What are the notable trends driving market growth?
Automotive and Transportation Industry to Drive the Market Growth.
7. Are there any restraints impacting market growth?
Rising concerns related to data security.
8. Can you provide examples of recent developments in the market?
September 2021: Through its subsidiary Beyond Eyes, the Dutch construction company Heijman has deployed some 20,000 LORAWAN smart buildings IoT sensors for its customers. The aim is to enhance the management of buildings by leveraging real-time insights regarding energy and water usage, light intensity, humidity levels, carbon emissions levels, and noise levels while providing occupants with smart home functionalities. Beyond Eyes partnered with IoT connectivity solution firm Actility and IoT senor company Clickey to implement its smart building concept across the Netherlands.
9. What pricing options are available for accessing the report?
Pricing options include single-user, multi-user, and enterprise licenses priced at USD 4750, USD 5250, and USD 8750 respectively.
10. Is the market size provided in terms of value or volume?
The market size is provided in terms of value, measured in Million and volume, measured in K Unit.
11. Are there any specific market keywords associated with the report?
Yes, the market keyword associated with the report is "IoT Sensor Market," which aids in identifying and referencing the specific market segment covered.
12. How do I determine which pricing option suits my needs best?
The pricing options vary based on user requirements and access needs. Individual users may opt for single-user licenses, while businesses requiring broader access may choose multi-user or enterprise licenses for cost-effective access to the report.
13. Are there any additional resources or data provided in the IoT Sensor Market report?
While the report offers comprehensive insights, it's advisable to review the specific contents or supplementary materials provided to ascertain if additional resources or data are available.
14. How can I stay updated on further developments or reports in the IoT Sensor Market?
To stay informed about further developments, trends, and reports in the IoT Sensor Market, consider subscribing to industry newsletters, following relevant companies and organizations, or regularly checking reputable industry news sources and publications.
Methodology
Step 1 - Identification of Relevant Samples Size from Population Database


Step 2 - Approaches for Defining Global Market Size (Value, Volume* & Price*)

Note*: In applicable scenarios
Step 3 - Data Sources
Primary Research
- Web Analytics
- Survey Reports
- Research Institute
- Latest Research Reports
- Opinion Leaders
Secondary Research
- Annual Reports
- White Paper
- Latest Press Release
- Industry Association
- Paid Database
- Investor Presentations

Step 4 - Data Triangulation
Involves using different sources of information in order to increase the validity of a study
These sources are likely to be stakeholders in a program - participants, other researchers, program staff, other community members, and so on.
Then we put all data in single framework & apply various statistical tools to find out the dynamic on the market.
During the analysis stage, feedback from the stakeholder groups would be compared to determine areas of agreement as well as areas of divergence


