
Key Insights
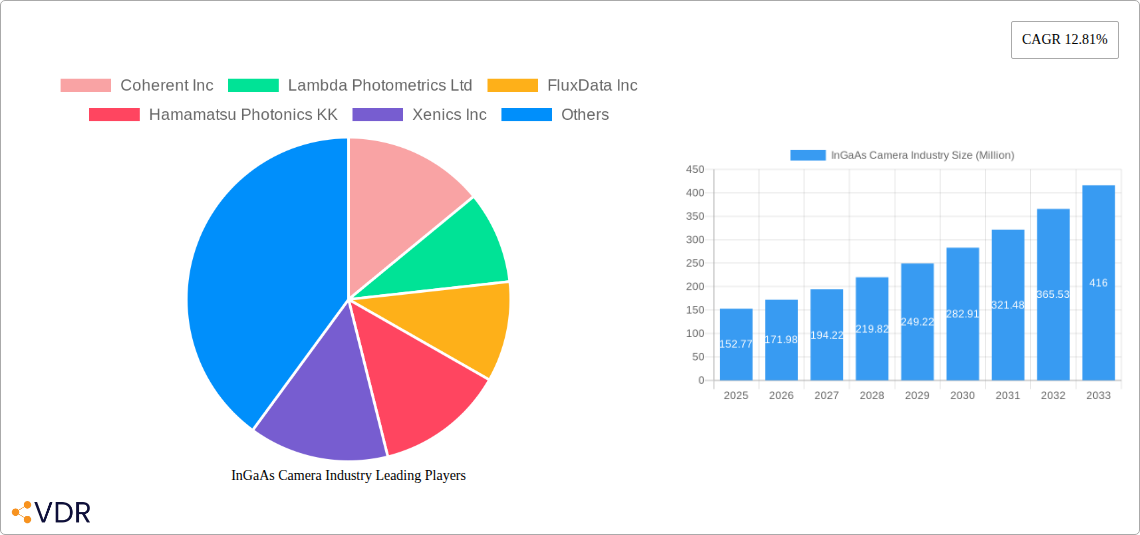
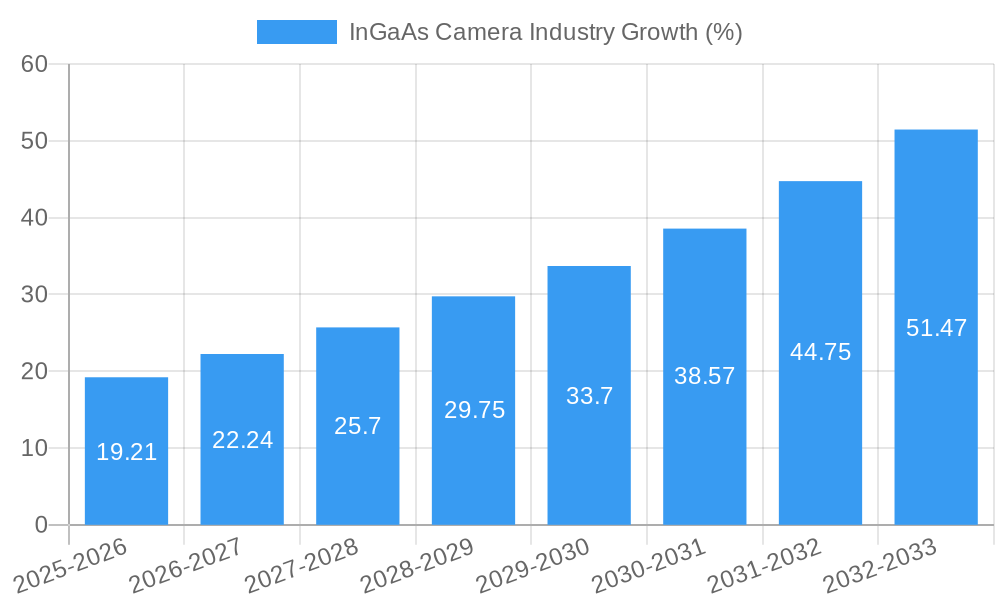
The InGaAs camera market, valued at $152.77 million in 2025, is experiencing robust growth, projected to expand at a Compound Annual Growth Rate (CAGR) of 12.81% from 2025 to 2033. This significant expansion is driven by increasing demand across diverse sectors. The military and defense sector is a major contributor, leveraging InGaAs cameras for their superior performance in low-light and challenging environmental conditions, particularly in night vision and surveillance applications. Industrial automation is another key driver, with InGaAs cameras enabling precise and efficient processes in manufacturing and quality control through advanced imaging capabilities. The growing need for enhanced security and surveillance systems, particularly in smart cities and critical infrastructure, further fuels market growth. Technological advancements, including improved sensor sensitivity, higher resolution capabilities, and reduced costs, are also contributing factors. The market's segmentation across applications (military and defense, industrial automation, surveillance and security, and other applications) reflects the breadth of its applications, offering numerous opportunities for growth. Regional variations in market adoption are expected, with North America and Asia Pacific projected to be leading markets due to robust technological advancements and increasing investments in defense and security.
The competitive landscape features both established players and emerging companies, indicating a dynamic market environment. Companies such as Coherent Inc., Hamamatsu Photonics KK, and FLIR Systems Inc. hold significant market share due to their established brand reputation and technological expertise. However, the emergence of innovative companies like Raptor Photonics Ltd. and Xenics Inc. with specialized products and competitive pricing poses a challenge to established players. The market’s future growth hinges on continued technological advancements, especially in areas like miniaturization, improved spectral range, and enhanced image processing capabilities. The increasing integration of InGaAs cameras into sophisticated systems and the growing adoption of these cameras in emerging applications will further propel market expansion in the coming years. The forecast period of 2025-2033 promises substantial growth opportunities for players in this evolving technological landscape.
InGaAs Camera Industry Market Report: 2019-2033
This comprehensive report provides an in-depth analysis of the InGaAs camera industry, encompassing market dynamics, growth trends, regional segmentation, product landscape, and key players. Covering the period 2019-2033, with a focus on 2025, this report is an essential resource for industry professionals, investors, and anyone seeking to understand this rapidly evolving sector. The parent market is the imaging sensor market, and the child market is specialized industrial cameras. The report projects xx Million units in total market value by 2033.
InGaAs Camera Industry Market Dynamics & Structure
This section analyzes the InGaAs camera market's competitive landscape, technological advancements, regulatory environment, and market consolidation activities. We examine market concentration, identifying the leading players and their market share percentages (e.g., Hamamatsu Photonics KK holding xx%, FLIR Systems Inc. holding xx%). The report also assesses the impact of mergers and acquisitions (M&A), noting xx M&A deals between 2019 and 2024.
- Market Concentration: Highly fragmented with several key players and numerous niche players.
- Technological Innovation: Driven by advancements in sensor technology, image processing algorithms, and miniaturization.
- Regulatory Frameworks: Compliance requirements vary across regions, impacting adoption rates in specific sectors (e.g., military, aerospace).
- Competitive Substitutes: Other imaging technologies (e.g., CCD, CMOS) compete for certain applications.
- End-User Demographics: Predominantly industrial and military applications, with growing adoption in other sectors (e.g., medical imaging, scientific research).
- M&A Trends: Consolidation is expected to continue, driven by the need for economies of scale and technological expertise. Innovation barriers include high R&D costs and specialized manufacturing processes.
InGaAs Camera Industry Growth Trends & Insights
The InGaAs camera market is experiencing significant growth, driven by increasing demand across various sectors. The report projects a Compound Annual Growth Rate (CAGR) of xx% from 2025 to 2033, reaching a market size of xx Million units by 2033. This growth is fueled by factors such as advancements in sensor technology resulting in improved image quality and sensitivity, the increasing demand for high-performance imaging in industrial automation, surveillance and security, and the expanding applications in the military and defense sector. The market penetration in key sectors like industrial automation is expected to increase from xx% in 2025 to xx% by 2033. Technological disruptions, such as the development of more compact and cost-effective InGaAs sensors, are further accelerating market growth.
Dominant Regions, Countries, or Segments in InGaAs Camera Industry
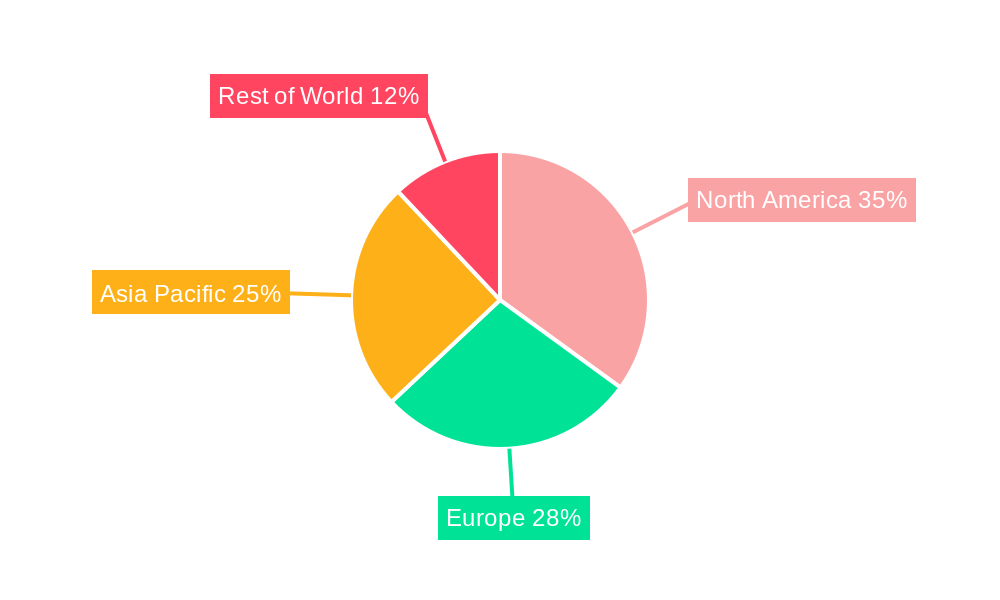
North America currently holds the largest market share, driven by strong demand from the military and defense sector and significant investments in industrial automation. However, the Asia-Pacific region shows the highest growth potential, driven by expanding industrialization and government initiatives promoting technological advancements.
- North America: High market share due to strong military and defense spending.
- Asia-Pacific: Fastest-growing region, driven by industrialization and government initiatives.
- Europe: Steady growth driven by investments in industrial automation and security applications.
- Military and Defense: Largest application segment, fueled by high defense budgets and increasing demand for advanced surveillance technologies.
- Industrial Automation: Rapid growth driven by increasing automation in manufacturing and process control.
InGaAs Camera Industry Product Landscape
InGaAs cameras are characterized by their ability to capture images in the near-infrared (NIR) spectrum. Recent product innovations focus on higher resolution, improved sensitivity, smaller form factors, and enhanced functionality, including advanced image processing capabilities. The unique selling propositions include the ability to see through fog, smoke, and darkness, making them suitable for diverse applications. Technological advancements like improved sensor materials, sophisticated cooling mechanisms and advanced signal processing algorithms further enhance camera performance.
Key Drivers, Barriers & Challenges in InGaAs Camera Industry
Key Drivers:
- Increasing demand for high-performance imaging across various sectors
- Advancements in sensor technology and image processing algorithms
- Growing adoption in emerging applications (e.g., medical, scientific research)
- Government investments in defense and security technologies
Key Challenges and Restraints:
- High cost of InGaAs sensors
- Limited availability of skilled labor
- Supply chain disruptions impacting component availability
- Stringent regulatory requirements for certain applications. These factors limit market expansion and increase production costs.
Emerging Opportunities in InGaAs Camera Industry
Emerging opportunities include the expansion into new applications such as autonomous vehicles, precision agriculture, and advanced medical imaging. The development of more cost-effective and compact InGaAs sensors is also creating opportunities for broader market penetration in various sectors. Furthermore, the growing demand for high-quality images in low-light conditions provides significant potential for market expansion.
Growth Accelerators in the InGaAs Camera Industry
Long-term growth is expected to be driven by continuous technological advancements, resulting in improved performance and reduced costs. Strategic partnerships between sensor manufacturers, camera manufacturers, and end-users will facilitate market expansion and foster innovation. Government initiatives promoting the adoption of advanced imaging technologies in various sectors will also play a vital role.
Key Players Shaping the InGaAs Camera Market
- Coherent Inc
- Lambda Photometrics Ltd
- FluxData Inc
- Hamamatsu Photonics KK
- Xenics Inc
- Raptor Photonics Ltd
- Specim Spectral Imaging Ltd
- New Imaging Technologies
- Allied Vision Technologies GmbH (TKH group)
- Flir Systems Inc
- Sensors Unlimited (Collins Aerospace Company)
- Acal BFI Limited Company (Discoverie Group PLC)
Notable Milestones in InGaAs Camera Industry Sector
- April 2022: 3D PLUS launched the 3DCM830 SWIR Space Camera Head, a high-performance 1.31 Mpixels SWIR camera for space applications. This signifies advancements in high-density, high-performance InGaAs sensor technology for specialized applications.
- January 2022: LUCID Vision Labs introduced the Atlas SWIR IP67-rated cameras, featuring Sony SenSWIR InGaAs sensors. This demonstrates the ongoing trend toward smaller, more robust, and versatile InGaAs cameras for industrial applications.
In-Depth InGaAs Camera Industry Market Outlook
The InGaAs camera market is poised for significant growth driven by technological innovation, expanding applications, and increasing demand across diverse sectors. Future market potential is substantial, especially in areas like autonomous driving, medical imaging, and advanced surveillance systems. Strategic partnerships and investments in R&D will play a crucial role in shaping the future of this dynamic industry.
InGaAs Camera Industry Segmentation
-
1. Application
- 1.1. Military and Defense
- 1.2. Industrial Automation
- 1.3. Surveillance and Security
- 1.4. Other Applications
-
2. Region
- 2.1. North America
- 2.2. Europe
- 2.3. Asia-Pacific
- 2.4. Rest of the World
InGaAs Camera Industry Segmentation By Geography
-
1. North America
- 1.1. United States
- 1.2. Canada
-
2. Europe
- 2.1. United Kingdom
- 2.2. Germany
- 2.3. France
- 2.4. Italy
-
3. Asia
- 3.1. China
- 3.2. India
- 3.3. Japan
- 3.4. Australia and New Zealand
- 3.5. South East Asia
- 4. Latin America
- 5. Middle East and Africa
InGaAs Camera Industry REPORT HIGHLIGHTS
| Aspects | Details |
|---|---|
| Study Period | 2019-2033 |
| Base Year | 2024 |
| Estimated Year | 2025 |
| Forecast Period | 2025-2033 |
| Historical Period | 2019-2024 |
| Growth Rate | CAGR of 12.81% from 2019-2033 |
| Segmentation |
|
Table of Contents
- 1. Introduction
- 1.1. Research Scope
- 1.2. Market Segmentation
- 1.3. Research Methodology
- 1.4. Definitions and Assumptions
- 2. Executive Summary
- 2.1. Introduction
- 3. Market Dynamics
- 3.1. Introduction
- 3.2. Market Drivers
- 3.2.1. Increasing Adoption in Machine Vision Applications; Rising Demand in Military and Defense Operations
- 3.3. Market Restrains
- 3.3.1. Customized Demands by Drillers; Decline in Drilling Activities and Rig Counts
- 3.4. Market Trends
- 3.4.1. Industrial Automation Expected to Occupy the Largest Market Share
- 4. Market Factor Analysis
- 4.1. Porters Five Forces
- 4.2. Supply/Value Chain
- 4.3. PESTEL analysis
- 4.4. Market Entropy
- 4.5. Patent/Trademark Analysis
- 5. Global InGaAs Camera Industry Analysis, Insights and Forecast, 2019-2031
- 5.1. Market Analysis, Insights and Forecast - by Application
- 5.1.1. Military and Defense
- 5.1.2. Industrial Automation
- 5.1.3. Surveillance and Security
- 5.1.4. Other Applications
- 5.2. Market Analysis, Insights and Forecast - by Region
- 5.2.1. North America
- 5.2.2. Europe
- 5.2.3. Asia-Pacific
- 5.2.4. Rest of the World
- 5.3. Market Analysis, Insights and Forecast - by Region
- 5.3.1. North America
- 5.3.2. Europe
- 5.3.3. Asia
- 5.3.4. Latin America
- 5.3.5. Middle East and Africa
- 5.1. Market Analysis, Insights and Forecast - by Application
- 6. North America InGaAs Camera Industry Analysis, Insights and Forecast, 2019-2031
- 6.1. Market Analysis, Insights and Forecast - by Application
- 6.1.1. Military and Defense
- 6.1.2. Industrial Automation
- 6.1.3. Surveillance and Security
- 6.1.4. Other Applications
- 6.2. Market Analysis, Insights and Forecast - by Region
- 6.2.1. North America
- 6.2.2. Europe
- 6.2.3. Asia-Pacific
- 6.2.4. Rest of the World
- 6.1. Market Analysis, Insights and Forecast - by Application
- 7. Europe InGaAs Camera Industry Analysis, Insights and Forecast, 2019-2031
- 7.1. Market Analysis, Insights and Forecast - by Application
- 7.1.1. Military and Defense
- 7.1.2. Industrial Automation
- 7.1.3. Surveillance and Security
- 7.1.4. Other Applications
- 7.2. Market Analysis, Insights and Forecast - by Region
- 7.2.1. North America
- 7.2.2. Europe
- 7.2.3. Asia-Pacific
- 7.2.4. Rest of the World
- 7.1. Market Analysis, Insights and Forecast - by Application
- 8. Asia InGaAs Camera Industry Analysis, Insights and Forecast, 2019-2031
- 8.1. Market Analysis, Insights and Forecast - by Application
- 8.1.1. Military and Defense
- 8.1.2. Industrial Automation
- 8.1.3. Surveillance and Security
- 8.1.4. Other Applications
- 8.2. Market Analysis, Insights and Forecast - by Region
- 8.2.1. North America
- 8.2.2. Europe
- 8.2.3. Asia-Pacific
- 8.2.4. Rest of the World
- 8.1. Market Analysis, Insights and Forecast - by Application
- 9. Latin America InGaAs Camera Industry Analysis, Insights and Forecast, 2019-2031
- 9.1. Market Analysis, Insights and Forecast - by Application
- 9.1.1. Military and Defense
- 9.1.2. Industrial Automation
- 9.1.3. Surveillance and Security
- 9.1.4. Other Applications
- 9.2. Market Analysis, Insights and Forecast - by Region
- 9.2.1. North America
- 9.2.2. Europe
- 9.2.3. Asia-Pacific
- 9.2.4. Rest of the World
- 9.1. Market Analysis, Insights and Forecast - by Application
- 10. Middle East and Africa InGaAs Camera Industry Analysis, Insights and Forecast, 2019-2031
- 10.1. Market Analysis, Insights and Forecast - by Application
- 10.1.1. Military and Defense
- 10.1.2. Industrial Automation
- 10.1.3. Surveillance and Security
- 10.1.4. Other Applications
- 10.2. Market Analysis, Insights and Forecast - by Region
- 10.2.1. North America
- 10.2.2. Europe
- 10.2.3. Asia-Pacific
- 10.2.4. Rest of the World
- 10.1. Market Analysis, Insights and Forecast - by Application
- 11. North America InGaAs Camera Industry Analysis, Insights and Forecast, 2019-2031
- 11.1. Market Analysis, Insights and Forecast - By Country/Sub-region
- 11.1.1 United States
- 11.1.2 Canada
- 11.1.3 Mexico
- 12. Europe InGaAs Camera Industry Analysis, Insights and Forecast, 2019-2031
- 12.1. Market Analysis, Insights and Forecast - By Country/Sub-region
- 12.1.1 Germany
- 12.1.2 United Kingdom
- 12.1.3 France
- 12.1.4 Spain
- 12.1.5 Italy
- 12.1.6 Spain
- 12.1.7 Belgium
- 12.1.8 Netherland
- 12.1.9 Nordics
- 12.1.10 Rest of Europe
- 13. Asia Pacific InGaAs Camera Industry Analysis, Insights and Forecast, 2019-2031
- 13.1. Market Analysis, Insights and Forecast - By Country/Sub-region
- 13.1.1 China
- 13.1.2 Japan
- 13.1.3 India
- 13.1.4 South Korea
- 13.1.5 Southeast Asia
- 13.1.6 Australia
- 13.1.7 Indonesia
- 13.1.8 Phillipes
- 13.1.9 Singapore
- 13.1.10 Thailandc
- 13.1.11 Rest of Asia Pacific
- 14. South America InGaAs Camera Industry Analysis, Insights and Forecast, 2019-2031
- 14.1. Market Analysis, Insights and Forecast - By Country/Sub-region
- 14.1.1 Brazil
- 14.1.2 Argentina
- 14.1.3 Peru
- 14.1.4 Chile
- 14.1.5 Colombia
- 14.1.6 Ecuador
- 14.1.7 Venezuela
- 14.1.8 Rest of South America
- 15. North America InGaAs Camera Industry Analysis, Insights and Forecast, 2019-2031
- 15.1. Market Analysis, Insights and Forecast - By Country/Sub-region
- 15.1.1 United States
- 15.1.2 Canada
- 15.1.3 Mexico
- 16. MEA InGaAs Camera Industry Analysis, Insights and Forecast, 2019-2031
- 16.1. Market Analysis, Insights and Forecast - By Country/Sub-region
- 16.1.1 United Arab Emirates
- 16.1.2 Saudi Arabia
- 16.1.3 South Africa
- 16.1.4 Rest of Middle East and Africa
- 17. Competitive Analysis
- 17.1. Global Market Share Analysis 2024
- 17.2. Company Profiles
- 17.2.1 Coherent Inc
- 17.2.1.1. Overview
- 17.2.1.2. Products
- 17.2.1.3. SWOT Analysis
- 17.2.1.4. Recent Developments
- 17.2.1.5. Financials (Based on Availability)
- 17.2.2 Lambda Photometrics Ltd
- 17.2.2.1. Overview
- 17.2.2.2. Products
- 17.2.2.3. SWOT Analysis
- 17.2.2.4. Recent Developments
- 17.2.2.5. Financials (Based on Availability)
- 17.2.3 FluxData Inc
- 17.2.3.1. Overview
- 17.2.3.2. Products
- 17.2.3.3. SWOT Analysis
- 17.2.3.4. Recent Developments
- 17.2.3.5. Financials (Based on Availability)
- 17.2.4 Hamamatsu Photonics KK
- 17.2.4.1. Overview
- 17.2.4.2. Products
- 17.2.4.3. SWOT Analysis
- 17.2.4.4. Recent Developments
- 17.2.4.5. Financials (Based on Availability)
- 17.2.5 Xenics Inc
- 17.2.5.1. Overview
- 17.2.5.2. Products
- 17.2.5.3. SWOT Analysis
- 17.2.5.4. Recent Developments
- 17.2.5.5. Financials (Based on Availability)
- 17.2.6 Raptor Photonics Ltd
- 17.2.6.1. Overview
- 17.2.6.2. Products
- 17.2.6.3. SWOT Analysis
- 17.2.6.4. Recent Developments
- 17.2.6.5. Financials (Based on Availability)
- 17.2.7 Specim Spectral Imaging Ltd
- 17.2.7.1. Overview
- 17.2.7.2. Products
- 17.2.7.3. SWOT Analysis
- 17.2.7.4. Recent Developments
- 17.2.7.5. Financials (Based on Availability)
- 17.2.8 New Imaging Technologies
- 17.2.8.1. Overview
- 17.2.8.2. Products
- 17.2.8.3. SWOT Analysis
- 17.2.8.4. Recent Developments
- 17.2.8.5. Financials (Based on Availability)
- 17.2.9 Allied Vision Technologies GmbH (TKH group)
- 17.2.9.1. Overview
- 17.2.9.2. Products
- 17.2.9.3. SWOT Analysis
- 17.2.9.4. Recent Developments
- 17.2.9.5. Financials (Based on Availability)
- 17.2.10 Flir Systems Inc
- 17.2.10.1. Overview
- 17.2.10.2. Products
- 17.2.10.3. SWOT Analysis
- 17.2.10.4. Recent Developments
- 17.2.10.5. Financials (Based on Availability)
- 17.2.11 Sensors Unlimited (Collins Aerospace Company)
- 17.2.11.1. Overview
- 17.2.11.2. Products
- 17.2.11.3. SWOT Analysis
- 17.2.11.4. Recent Developments
- 17.2.11.5. Financials (Based on Availability)
- 17.2.12 Acal BFI Limited Company (Discoverie Group PLC)
- 17.2.12.1. Overview
- 17.2.12.2. Products
- 17.2.12.3. SWOT Analysis
- 17.2.12.4. Recent Developments
- 17.2.12.5. Financials (Based on Availability)
- 17.2.1 Coherent Inc
List of Figures
- Figure 1: Global InGaAs Camera Industry Revenue Breakdown (Million, %) by Region 2024 & 2032
- Figure 2: Global InGaAs Camera Industry Volume Breakdown (K Unit, %) by Region 2024 & 2032
- Figure 3: North America InGaAs Camera Industry Revenue (Million), by Country 2024 & 2032
- Figure 4: North America InGaAs Camera Industry Volume (K Unit), by Country 2024 & 2032
- Figure 5: North America InGaAs Camera Industry Revenue Share (%), by Country 2024 & 2032
- Figure 6: North America InGaAs Camera Industry Volume Share (%), by Country 2024 & 2032
- Figure 7: Europe InGaAs Camera Industry Revenue (Million), by Country 2024 & 2032
- Figure 8: Europe InGaAs Camera Industry Volume (K Unit), by Country 2024 & 2032
- Figure 9: Europe InGaAs Camera Industry Revenue Share (%), by Country 2024 & 2032
- Figure 10: Europe InGaAs Camera Industry Volume Share (%), by Country 2024 & 2032
- Figure 11: Asia Pacific InGaAs Camera Industry Revenue (Million), by Country 2024 & 2032
- Figure 12: Asia Pacific InGaAs Camera Industry Volume (K Unit), by Country 2024 & 2032
- Figure 13: Asia Pacific InGaAs Camera Industry Revenue Share (%), by Country 2024 & 2032
- Figure 14: Asia Pacific InGaAs Camera Industry Volume Share (%), by Country 2024 & 2032
- Figure 15: South America InGaAs Camera Industry Revenue (Million), by Country 2024 & 2032
- Figure 16: South America InGaAs Camera Industry Volume (K Unit), by Country 2024 & 2032
- Figure 17: South America InGaAs Camera Industry Revenue Share (%), by Country 2024 & 2032
- Figure 18: South America InGaAs Camera Industry Volume Share (%), by Country 2024 & 2032
- Figure 19: North America InGaAs Camera Industry Revenue (Million), by Country 2024 & 2032
- Figure 20: North America InGaAs Camera Industry Volume (K Unit), by Country 2024 & 2032
- Figure 21: North America InGaAs Camera Industry Revenue Share (%), by Country 2024 & 2032
- Figure 22: North America InGaAs Camera Industry Volume Share (%), by Country 2024 & 2032
- Figure 23: MEA InGaAs Camera Industry Revenue (Million), by Country 2024 & 2032
- Figure 24: MEA InGaAs Camera Industry Volume (K Unit), by Country 2024 & 2032
- Figure 25: MEA InGaAs Camera Industry Revenue Share (%), by Country 2024 & 2032
- Figure 26: MEA InGaAs Camera Industry Volume Share (%), by Country 2024 & 2032
- Figure 27: North America InGaAs Camera Industry Revenue (Million), by Application 2024 & 2032
- Figure 28: North America InGaAs Camera Industry Volume (K Unit), by Application 2024 & 2032
- Figure 29: North America InGaAs Camera Industry Revenue Share (%), by Application 2024 & 2032
- Figure 30: North America InGaAs Camera Industry Volume Share (%), by Application 2024 & 2032
- Figure 31: North America InGaAs Camera Industry Revenue (Million), by Region 2024 & 2032
- Figure 32: North America InGaAs Camera Industry Volume (K Unit), by Region 2024 & 2032
- Figure 33: North America InGaAs Camera Industry Revenue Share (%), by Region 2024 & 2032
- Figure 34: North America InGaAs Camera Industry Volume Share (%), by Region 2024 & 2032
- Figure 35: North America InGaAs Camera Industry Revenue (Million), by Country 2024 & 2032
- Figure 36: North America InGaAs Camera Industry Volume (K Unit), by Country 2024 & 2032
- Figure 37: North America InGaAs Camera Industry Revenue Share (%), by Country 2024 & 2032
- Figure 38: North America InGaAs Camera Industry Volume Share (%), by Country 2024 & 2032
- Figure 39: Europe InGaAs Camera Industry Revenue (Million), by Application 2024 & 2032
- Figure 40: Europe InGaAs Camera Industry Volume (K Unit), by Application 2024 & 2032
- Figure 41: Europe InGaAs Camera Industry Revenue Share (%), by Application 2024 & 2032
- Figure 42: Europe InGaAs Camera Industry Volume Share (%), by Application 2024 & 2032
- Figure 43: Europe InGaAs Camera Industry Revenue (Million), by Region 2024 & 2032
- Figure 44: Europe InGaAs Camera Industry Volume (K Unit), by Region 2024 & 2032
- Figure 45: Europe InGaAs Camera Industry Revenue Share (%), by Region 2024 & 2032
- Figure 46: Europe InGaAs Camera Industry Volume Share (%), by Region 2024 & 2032
- Figure 47: Europe InGaAs Camera Industry Revenue (Million), by Country 2024 & 2032
- Figure 48: Europe InGaAs Camera Industry Volume (K Unit), by Country 2024 & 2032
- Figure 49: Europe InGaAs Camera Industry Revenue Share (%), by Country 2024 & 2032
- Figure 50: Europe InGaAs Camera Industry Volume Share (%), by Country 2024 & 2032
- Figure 51: Asia InGaAs Camera Industry Revenue (Million), by Application 2024 & 2032
- Figure 52: Asia InGaAs Camera Industry Volume (K Unit), by Application 2024 & 2032
- Figure 53: Asia InGaAs Camera Industry Revenue Share (%), by Application 2024 & 2032
- Figure 54: Asia InGaAs Camera Industry Volume Share (%), by Application 2024 & 2032
- Figure 55: Asia InGaAs Camera Industry Revenue (Million), by Region 2024 & 2032
- Figure 56: Asia InGaAs Camera Industry Volume (K Unit), by Region 2024 & 2032
- Figure 57: Asia InGaAs Camera Industry Revenue Share (%), by Region 2024 & 2032
- Figure 58: Asia InGaAs Camera Industry Volume Share (%), by Region 2024 & 2032
- Figure 59: Asia InGaAs Camera Industry Revenue (Million), by Country 2024 & 2032
- Figure 60: Asia InGaAs Camera Industry Volume (K Unit), by Country 2024 & 2032
- Figure 61: Asia InGaAs Camera Industry Revenue Share (%), by Country 2024 & 2032
- Figure 62: Asia InGaAs Camera Industry Volume Share (%), by Country 2024 & 2032
- Figure 63: Latin America InGaAs Camera Industry Revenue (Million), by Application 2024 & 2032
- Figure 64: Latin America InGaAs Camera Industry Volume (K Unit), by Application 2024 & 2032
- Figure 65: Latin America InGaAs Camera Industry Revenue Share (%), by Application 2024 & 2032
- Figure 66: Latin America InGaAs Camera Industry Volume Share (%), by Application 2024 & 2032
- Figure 67: Latin America InGaAs Camera Industry Revenue (Million), by Region 2024 & 2032
- Figure 68: Latin America InGaAs Camera Industry Volume (K Unit), by Region 2024 & 2032
- Figure 69: Latin America InGaAs Camera Industry Revenue Share (%), by Region 2024 & 2032
- Figure 70: Latin America InGaAs Camera Industry Volume Share (%), by Region 2024 & 2032
- Figure 71: Latin America InGaAs Camera Industry Revenue (Million), by Country 2024 & 2032
- Figure 72: Latin America InGaAs Camera Industry Volume (K Unit), by Country 2024 & 2032
- Figure 73: Latin America InGaAs Camera Industry Revenue Share (%), by Country 2024 & 2032
- Figure 74: Latin America InGaAs Camera Industry Volume Share (%), by Country 2024 & 2032
- Figure 75: Middle East and Africa InGaAs Camera Industry Revenue (Million), by Application 2024 & 2032
- Figure 76: Middle East and Africa InGaAs Camera Industry Volume (K Unit), by Application 2024 & 2032
- Figure 77: Middle East and Africa InGaAs Camera Industry Revenue Share (%), by Application 2024 & 2032
- Figure 78: Middle East and Africa InGaAs Camera Industry Volume Share (%), by Application 2024 & 2032
- Figure 79: Middle East and Africa InGaAs Camera Industry Revenue (Million), by Region 2024 & 2032
- Figure 80: Middle East and Africa InGaAs Camera Industry Volume (K Unit), by Region 2024 & 2032
- Figure 81: Middle East and Africa InGaAs Camera Industry Revenue Share (%), by Region 2024 & 2032
- Figure 82: Middle East and Africa InGaAs Camera Industry Volume Share (%), by Region 2024 & 2032
- Figure 83: Middle East and Africa InGaAs Camera Industry Revenue (Million), by Country 2024 & 2032
- Figure 84: Middle East and Africa InGaAs Camera Industry Volume (K Unit), by Country 2024 & 2032
- Figure 85: Middle East and Africa InGaAs Camera Industry Revenue Share (%), by Country 2024 & 2032
- Figure 86: Middle East and Africa InGaAs Camera Industry Volume Share (%), by Country 2024 & 2032
List of Tables
- Table 1: Global InGaAs Camera Industry Revenue Million Forecast, by Region 2019 & 2032
- Table 2: Global InGaAs Camera Industry Volume K Unit Forecast, by Region 2019 & 2032
- Table 3: Global InGaAs Camera Industry Revenue Million Forecast, by Application 2019 & 2032
- Table 4: Global InGaAs Camera Industry Volume K Unit Forecast, by Application 2019 & 2032
- Table 5: Global InGaAs Camera Industry Revenue Million Forecast, by Region 2019 & 2032
- Table 6: Global InGaAs Camera Industry Volume K Unit Forecast, by Region 2019 & 2032
- Table 7: Global InGaAs Camera Industry Revenue Million Forecast, by Region 2019 & 2032
- Table 8: Global InGaAs Camera Industry Volume K Unit Forecast, by Region 2019 & 2032
- Table 9: Global InGaAs Camera Industry Revenue Million Forecast, by Country 2019 & 2032
- Table 10: Global InGaAs Camera Industry Volume K Unit Forecast, by Country 2019 & 2032
- Table 11: United States InGaAs Camera Industry Revenue (Million) Forecast, by Application 2019 & 2032
- Table 12: United States InGaAs Camera Industry Volume (K Unit) Forecast, by Application 2019 & 2032
- Table 13: Canada InGaAs Camera Industry Revenue (Million) Forecast, by Application 2019 & 2032
- Table 14: Canada InGaAs Camera Industry Volume (K Unit) Forecast, by Application 2019 & 2032
- Table 15: Mexico InGaAs Camera Industry Revenue (Million) Forecast, by Application 2019 & 2032
- Table 16: Mexico InGaAs Camera Industry Volume (K Unit) Forecast, by Application 2019 & 2032
- Table 17: Global InGaAs Camera Industry Revenue Million Forecast, by Country 2019 & 2032
- Table 18: Global InGaAs Camera Industry Volume K Unit Forecast, by Country 2019 & 2032
- Table 19: Germany InGaAs Camera Industry Revenue (Million) Forecast, by Application 2019 & 2032
- Table 20: Germany InGaAs Camera Industry Volume (K Unit) Forecast, by Application 2019 & 2032
- Table 21: United Kingdom InGaAs Camera Industry Revenue (Million) Forecast, by Application 2019 & 2032
- Table 22: United Kingdom InGaAs Camera Industry Volume (K Unit) Forecast, by Application 2019 & 2032
- Table 23: France InGaAs Camera Industry Revenue (Million) Forecast, by Application 2019 & 2032
- Table 24: France InGaAs Camera Industry Volume (K Unit) Forecast, by Application 2019 & 2032
- Table 25: Spain InGaAs Camera Industry Revenue (Million) Forecast, by Application 2019 & 2032
- Table 26: Spain InGaAs Camera Industry Volume (K Unit) Forecast, by Application 2019 & 2032
- Table 27: Italy InGaAs Camera Industry Revenue (Million) Forecast, by Application 2019 & 2032
- Table 28: Italy InGaAs Camera Industry Volume (K Unit) Forecast, by Application 2019 & 2032
- Table 29: Spain InGaAs Camera Industry Revenue (Million) Forecast, by Application 2019 & 2032
- Table 30: Spain InGaAs Camera Industry Volume (K Unit) Forecast, by Application 2019 & 2032
- Table 31: Belgium InGaAs Camera Industry Revenue (Million) Forecast, by Application 2019 & 2032
- Table 32: Belgium InGaAs Camera Industry Volume (K Unit) Forecast, by Application 2019 & 2032
- Table 33: Netherland InGaAs Camera Industry Revenue (Million) Forecast, by Application 2019 & 2032
- Table 34: Netherland InGaAs Camera Industry Volume (K Unit) Forecast, by Application 2019 & 2032
- Table 35: Nordics InGaAs Camera Industry Revenue (Million) Forecast, by Application 2019 & 2032
- Table 36: Nordics InGaAs Camera Industry Volume (K Unit) Forecast, by Application 2019 & 2032
- Table 37: Rest of Europe InGaAs Camera Industry Revenue (Million) Forecast, by Application 2019 & 2032
- Table 38: Rest of Europe InGaAs Camera Industry Volume (K Unit) Forecast, by Application 2019 & 2032
- Table 39: Global InGaAs Camera Industry Revenue Million Forecast, by Country 2019 & 2032
- Table 40: Global InGaAs Camera Industry Volume K Unit Forecast, by Country 2019 & 2032
- Table 41: China InGaAs Camera Industry Revenue (Million) Forecast, by Application 2019 & 2032
- Table 42: China InGaAs Camera Industry Volume (K Unit) Forecast, by Application 2019 & 2032
- Table 43: Japan InGaAs Camera Industry Revenue (Million) Forecast, by Application 2019 & 2032
- Table 44: Japan InGaAs Camera Industry Volume (K Unit) Forecast, by Application 2019 & 2032
- Table 45: India InGaAs Camera Industry Revenue (Million) Forecast, by Application 2019 & 2032
- Table 46: India InGaAs Camera Industry Volume (K Unit) Forecast, by Application 2019 & 2032
- Table 47: South Korea InGaAs Camera Industry Revenue (Million) Forecast, by Application 2019 & 2032
- Table 48: South Korea InGaAs Camera Industry Volume (K Unit) Forecast, by Application 2019 & 2032
- Table 49: Southeast Asia InGaAs Camera Industry Revenue (Million) Forecast, by Application 2019 & 2032
- Table 50: Southeast Asia InGaAs Camera Industry Volume (K Unit) Forecast, by Application 2019 & 2032
- Table 51: Australia InGaAs Camera Industry Revenue (Million) Forecast, by Application 2019 & 2032
- Table 52: Australia InGaAs Camera Industry Volume (K Unit) Forecast, by Application 2019 & 2032
- Table 53: Indonesia InGaAs Camera Industry Revenue (Million) Forecast, by Application 2019 & 2032
- Table 54: Indonesia InGaAs Camera Industry Volume (K Unit) Forecast, by Application 2019 & 2032
- Table 55: Phillipes InGaAs Camera Industry Revenue (Million) Forecast, by Application 2019 & 2032
- Table 56: Phillipes InGaAs Camera Industry Volume (K Unit) Forecast, by Application 2019 & 2032
- Table 57: Singapore InGaAs Camera Industry Revenue (Million) Forecast, by Application 2019 & 2032
- Table 58: Singapore InGaAs Camera Industry Volume (K Unit) Forecast, by Application 2019 & 2032
- Table 59: Thailandc InGaAs Camera Industry Revenue (Million) Forecast, by Application 2019 & 2032
- Table 60: Thailandc InGaAs Camera Industry Volume (K Unit) Forecast, by Application 2019 & 2032
- Table 61: Rest of Asia Pacific InGaAs Camera Industry Revenue (Million) Forecast, by Application 2019 & 2032
- Table 62: Rest of Asia Pacific InGaAs Camera Industry Volume (K Unit) Forecast, by Application 2019 & 2032
- Table 63: Global InGaAs Camera Industry Revenue Million Forecast, by Country 2019 & 2032
- Table 64: Global InGaAs Camera Industry Volume K Unit Forecast, by Country 2019 & 2032
- Table 65: Brazil InGaAs Camera Industry Revenue (Million) Forecast, by Application 2019 & 2032
- Table 66: Brazil InGaAs Camera Industry Volume (K Unit) Forecast, by Application 2019 & 2032
- Table 67: Argentina InGaAs Camera Industry Revenue (Million) Forecast, by Application 2019 & 2032
- Table 68: Argentina InGaAs Camera Industry Volume (K Unit) Forecast, by Application 2019 & 2032
- Table 69: Peru InGaAs Camera Industry Revenue (Million) Forecast, by Application 2019 & 2032
- Table 70: Peru InGaAs Camera Industry Volume (K Unit) Forecast, by Application 2019 & 2032
- Table 71: Chile InGaAs Camera Industry Revenue (Million) Forecast, by Application 2019 & 2032
- Table 72: Chile InGaAs Camera Industry Volume (K Unit) Forecast, by Application 2019 & 2032
- Table 73: Colombia InGaAs Camera Industry Revenue (Million) Forecast, by Application 2019 & 2032
- Table 74: Colombia InGaAs Camera Industry Volume (K Unit) Forecast, by Application 2019 & 2032
- Table 75: Ecuador InGaAs Camera Industry Revenue (Million) Forecast, by Application 2019 & 2032
- Table 76: Ecuador InGaAs Camera Industry Volume (K Unit) Forecast, by Application 2019 & 2032
- Table 77: Venezuela InGaAs Camera Industry Revenue (Million) Forecast, by Application 2019 & 2032
- Table 78: Venezuela InGaAs Camera Industry Volume (K Unit) Forecast, by Application 2019 & 2032
- Table 79: Rest of South America InGaAs Camera Industry Revenue (Million) Forecast, by Application 2019 & 2032
- Table 80: Rest of South America InGaAs Camera Industry Volume (K Unit) Forecast, by Application 2019 & 2032
- Table 81: Global InGaAs Camera Industry Revenue Million Forecast, by Country 2019 & 2032
- Table 82: Global InGaAs Camera Industry Volume K Unit Forecast, by Country 2019 & 2032
- Table 83: United States InGaAs Camera Industry Revenue (Million) Forecast, by Application 2019 & 2032
- Table 84: United States InGaAs Camera Industry Volume (K Unit) Forecast, by Application 2019 & 2032
- Table 85: Canada InGaAs Camera Industry Revenue (Million) Forecast, by Application 2019 & 2032
- Table 86: Canada InGaAs Camera Industry Volume (K Unit) Forecast, by Application 2019 & 2032
- Table 87: Mexico InGaAs Camera Industry Revenue (Million) Forecast, by Application 2019 & 2032
- Table 88: Mexico InGaAs Camera Industry Volume (K Unit) Forecast, by Application 2019 & 2032
- Table 89: Global InGaAs Camera Industry Revenue Million Forecast, by Country 2019 & 2032
- Table 90: Global InGaAs Camera Industry Volume K Unit Forecast, by Country 2019 & 2032
- Table 91: United Arab Emirates InGaAs Camera Industry Revenue (Million) Forecast, by Application 2019 & 2032
- Table 92: United Arab Emirates InGaAs Camera Industry Volume (K Unit) Forecast, by Application 2019 & 2032
- Table 93: Saudi Arabia InGaAs Camera Industry Revenue (Million) Forecast, by Application 2019 & 2032
- Table 94: Saudi Arabia InGaAs Camera Industry Volume (K Unit) Forecast, by Application 2019 & 2032
- Table 95: South Africa InGaAs Camera Industry Revenue (Million) Forecast, by Application 2019 & 2032
- Table 96: South Africa InGaAs Camera Industry Volume (K Unit) Forecast, by Application 2019 & 2032
- Table 97: Rest of Middle East and Africa InGaAs Camera Industry Revenue (Million) Forecast, by Application 2019 & 2032
- Table 98: Rest of Middle East and Africa InGaAs Camera Industry Volume (K Unit) Forecast, by Application 2019 & 2032
- Table 99: Global InGaAs Camera Industry Revenue Million Forecast, by Application 2019 & 2032
- Table 100: Global InGaAs Camera Industry Volume K Unit Forecast, by Application 2019 & 2032
- Table 101: Global InGaAs Camera Industry Revenue Million Forecast, by Region 2019 & 2032
- Table 102: Global InGaAs Camera Industry Volume K Unit Forecast, by Region 2019 & 2032
- Table 103: Global InGaAs Camera Industry Revenue Million Forecast, by Country 2019 & 2032
- Table 104: Global InGaAs Camera Industry Volume K Unit Forecast, by Country 2019 & 2032
- Table 105: United States InGaAs Camera Industry Revenue (Million) Forecast, by Application 2019 & 2032
- Table 106: United States InGaAs Camera Industry Volume (K Unit) Forecast, by Application 2019 & 2032
- Table 107: Canada InGaAs Camera Industry Revenue (Million) Forecast, by Application 2019 & 2032
- Table 108: Canada InGaAs Camera Industry Volume (K Unit) Forecast, by Application 2019 & 2032
- Table 109: Global InGaAs Camera Industry Revenue Million Forecast, by Application 2019 & 2032
- Table 110: Global InGaAs Camera Industry Volume K Unit Forecast, by Application 2019 & 2032
- Table 111: Global InGaAs Camera Industry Revenue Million Forecast, by Region 2019 & 2032
- Table 112: Global InGaAs Camera Industry Volume K Unit Forecast, by Region 2019 & 2032
- Table 113: Global InGaAs Camera Industry Revenue Million Forecast, by Country 2019 & 2032
- Table 114: Global InGaAs Camera Industry Volume K Unit Forecast, by Country 2019 & 2032
- Table 115: United Kingdom InGaAs Camera Industry Revenue (Million) Forecast, by Application 2019 & 2032
- Table 116: United Kingdom InGaAs Camera Industry Volume (K Unit) Forecast, by Application 2019 & 2032
- Table 117: Germany InGaAs Camera Industry Revenue (Million) Forecast, by Application 2019 & 2032
- Table 118: Germany InGaAs Camera Industry Volume (K Unit) Forecast, by Application 2019 & 2032
- Table 119: France InGaAs Camera Industry Revenue (Million) Forecast, by Application 2019 & 2032
- Table 120: France InGaAs Camera Industry Volume (K Unit) Forecast, by Application 2019 & 2032
- Table 121: Italy InGaAs Camera Industry Revenue (Million) Forecast, by Application 2019 & 2032
- Table 122: Italy InGaAs Camera Industry Volume (K Unit) Forecast, by Application 2019 & 2032
- Table 123: Global InGaAs Camera Industry Revenue Million Forecast, by Application 2019 & 2032
- Table 124: Global InGaAs Camera Industry Volume K Unit Forecast, by Application 2019 & 2032
- Table 125: Global InGaAs Camera Industry Revenue Million Forecast, by Region 2019 & 2032
- Table 126: Global InGaAs Camera Industry Volume K Unit Forecast, by Region 2019 & 2032
- Table 127: Global InGaAs Camera Industry Revenue Million Forecast, by Country 2019 & 2032
- Table 128: Global InGaAs Camera Industry Volume K Unit Forecast, by Country 2019 & 2032
- Table 129: China InGaAs Camera Industry Revenue (Million) Forecast, by Application 2019 & 2032
- Table 130: China InGaAs Camera Industry Volume (K Unit) Forecast, by Application 2019 & 2032
- Table 131: India InGaAs Camera Industry Revenue (Million) Forecast, by Application 2019 & 2032
- Table 132: India InGaAs Camera Industry Volume (K Unit) Forecast, by Application 2019 & 2032
- Table 133: Japan InGaAs Camera Industry Revenue (Million) Forecast, by Application 2019 & 2032
- Table 134: Japan InGaAs Camera Industry Volume (K Unit) Forecast, by Application 2019 & 2032
- Table 135: Australia and New Zealand InGaAs Camera Industry Revenue (Million) Forecast, by Application 2019 & 2032
- Table 136: Australia and New Zealand InGaAs Camera Industry Volume (K Unit) Forecast, by Application 2019 & 2032
- Table 137: South East Asia InGaAs Camera Industry Revenue (Million) Forecast, by Application 2019 & 2032
- Table 138: South East Asia InGaAs Camera Industry Volume (K Unit) Forecast, by Application 2019 & 2032
- Table 139: Global InGaAs Camera Industry Revenue Million Forecast, by Application 2019 & 2032
- Table 140: Global InGaAs Camera Industry Volume K Unit Forecast, by Application 2019 & 2032
- Table 141: Global InGaAs Camera Industry Revenue Million Forecast, by Region 2019 & 2032
- Table 142: Global InGaAs Camera Industry Volume K Unit Forecast, by Region 2019 & 2032
- Table 143: Global InGaAs Camera Industry Revenue Million Forecast, by Country 2019 & 2032
- Table 144: Global InGaAs Camera Industry Volume K Unit Forecast, by Country 2019 & 2032
- Table 145: Global InGaAs Camera Industry Revenue Million Forecast, by Application 2019 & 2032
- Table 146: Global InGaAs Camera Industry Volume K Unit Forecast, by Application 2019 & 2032
- Table 147: Global InGaAs Camera Industry Revenue Million Forecast, by Region 2019 & 2032
- Table 148: Global InGaAs Camera Industry Volume K Unit Forecast, by Region 2019 & 2032
- Table 149: Global InGaAs Camera Industry Revenue Million Forecast, by Country 2019 & 2032
- Table 150: Global InGaAs Camera Industry Volume K Unit Forecast, by Country 2019 & 2032
Frequently Asked Questions
1. What is the projected Compound Annual Growth Rate (CAGR) of the InGaAs Camera Industry?
The projected CAGR is approximately 12.81%.
2. Which companies are prominent players in the InGaAs Camera Industry?
Key companies in the market include Coherent Inc, Lambda Photometrics Ltd, FluxData Inc, Hamamatsu Photonics KK, Xenics Inc, Raptor Photonics Ltd, Specim Spectral Imaging Ltd, New Imaging Technologies, Allied Vision Technologies GmbH (TKH group), Flir Systems Inc, Sensors Unlimited (Collins Aerospace Company), Acal BFI Limited Company (Discoverie Group PLC).
3. What are the main segments of the InGaAs Camera Industry?
The market segments include Application, Region .
4. Can you provide details about the market size?
The market size is estimated to be USD 152.77 Million as of 2022.
5. What are some drivers contributing to market growth?
Increasing Adoption in Machine Vision Applications; Rising Demand in Military and Defense Operations.
6. What are the notable trends driving market growth?
Industrial Automation Expected to Occupy the Largest Market Share.
7. Are there any restraints impacting market growth?
Customized Demands by Drillers; Decline in Drilling Activities and Rig Counts.
8. Can you provide examples of recent developments in the market?
April 2022: 3D PLUS expanded its space camera head family by including a high-density, high-performance 1.31 Mpixels SWIR Camera Head for space applications. The 3DCM830 SWIR Space Camera Head embeds a SWIR InGaAs image sensor with associated memories and a high-performance FPGA-based electronic architecture, allowing for efficient sensor operation and the integration of image processing and formatting close to the image sensor.
9. What pricing options are available for accessing the report?
Pricing options include single-user, multi-user, and enterprise licenses priced at USD 4750, USD 5250, and USD 8750 respectively.
10. Is the market size provided in terms of value or volume?
The market size is provided in terms of value, measured in Million and volume, measured in K Unit.
11. Are there any specific market keywords associated with the report?
Yes, the market keyword associated with the report is "InGaAs Camera Industry," which aids in identifying and referencing the specific market segment covered.
12. How do I determine which pricing option suits my needs best?
The pricing options vary based on user requirements and access needs. Individual users may opt for single-user licenses, while businesses requiring broader access may choose multi-user or enterprise licenses for cost-effective access to the report.
13. Are there any additional resources or data provided in the InGaAs Camera Industry report?
While the report offers comprehensive insights, it's advisable to review the specific contents or supplementary materials provided to ascertain if additional resources or data are available.
14. How can I stay updated on further developments or reports in the InGaAs Camera Industry?
To stay informed about further developments, trends, and reports in the InGaAs Camera Industry, consider subscribing to industry newsletters, following relevant companies and organizations, or regularly checking reputable industry news sources and publications.
Methodology
Step 1 - Identification of Relevant Samples Size from Population Database


Step 2 - Approaches for Defining Global Market Size (Value, Volume* & Price*)

Note*: In applicable scenarios
Step 3 - Data Sources
Primary Research
- Web Analytics
- Survey Reports
- Research Institute
- Latest Research Reports
- Opinion Leaders
Secondary Research
- Annual Reports
- White Paper
- Latest Press Release
- Industry Association
- Paid Database
- Investor Presentations

Step 4 - Data Triangulation
Involves using different sources of information in order to increase the validity of a study
These sources are likely to be stakeholders in a program - participants, other researchers, program staff, other community members, and so on.
Then we put all data in single framework & apply various statistical tools to find out the dynamic on the market.
During the analysis stage, feedback from the stakeholder groups would be compared to determine areas of agreement as well as areas of divergence


