
Key Insights
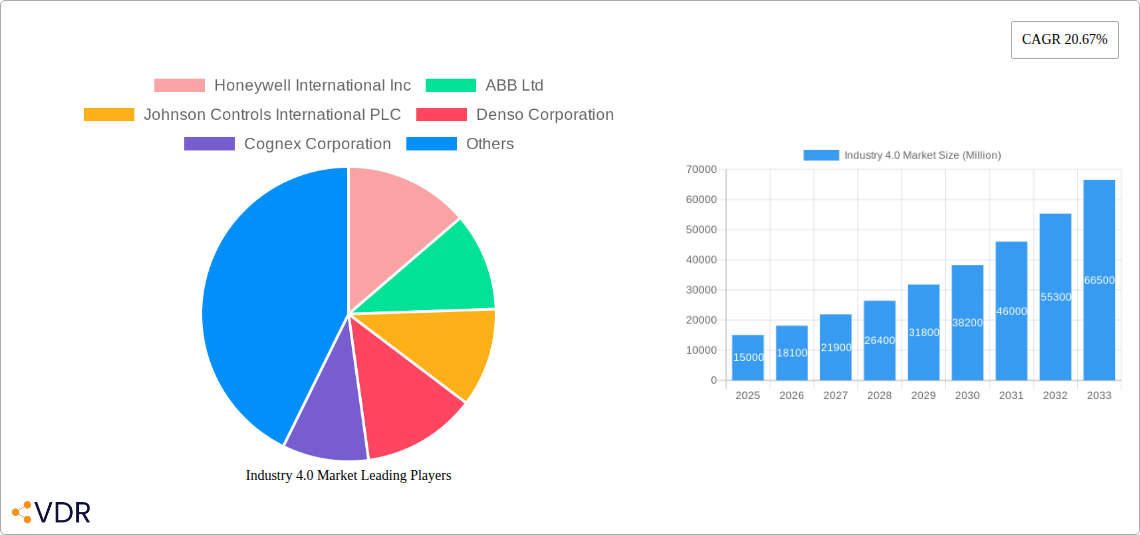
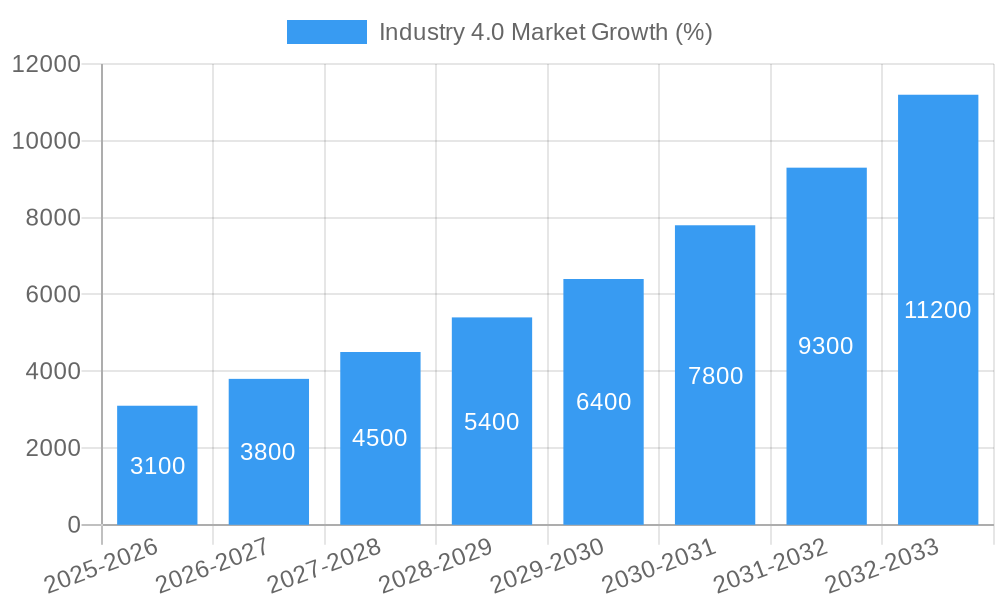
The Industry 4.0 market, encompassing technologies like Industrial Robotics, IIoT, AI/ML, and digital twins, is experiencing robust growth, projected to maintain a Compound Annual Growth Rate (CAGR) of 20.67% from 2025 to 2033. This expansion is fueled by several key drivers. Increased automation demands across manufacturing, automotive, and energy sectors are pushing adoption of advanced technologies for enhanced efficiency and productivity. The ongoing digital transformation initiatives within businesses are creating a favorable environment for Industry 4.0 solutions, as companies strive to optimize operations, improve data analytics, and gain a competitive edge. Furthermore, the growing focus on predictive maintenance, enabled by IIoT and AI, is significantly contributing to market growth. While challenges remain, such as the high initial investment costs associated with implementing Industry 4.0 technologies and the need for skilled workforce training, the long-term benefits of increased efficiency and reduced operational costs outweigh these limitations. The market is segmented by technology type and end-user industry, with manufacturing and automotive sectors currently dominating, but significant growth is anticipated in energy and utilities as well as aerospace and defense sectors as they increasingly adopt smart manufacturing and digitalization strategies.
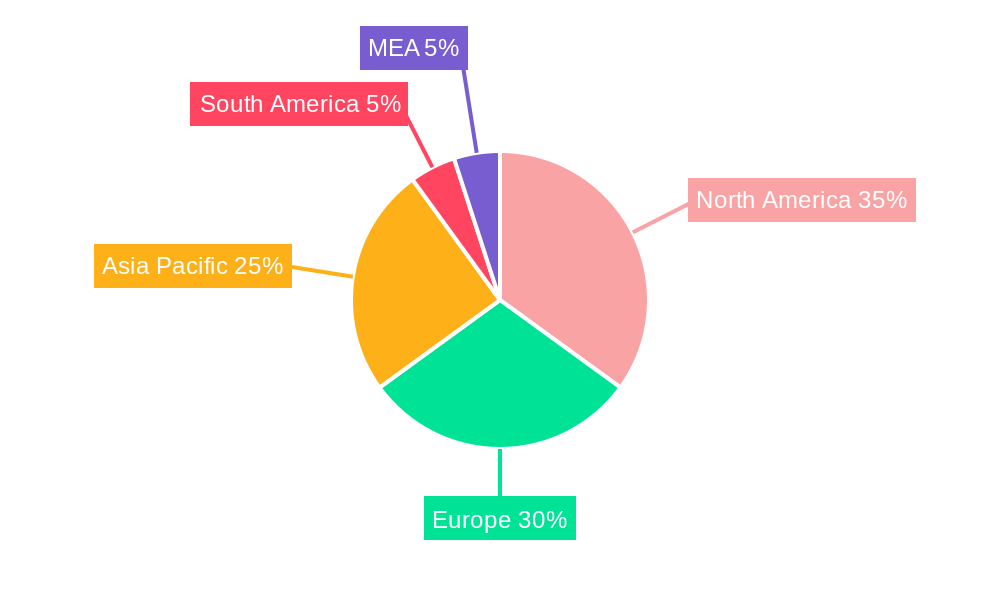
Geographic distribution shows North America and Europe as early adopters and major market players, while the Asia-Pacific region is projected to witness substantial growth in the coming years due to rapid industrialization and technological advancements in countries like China and India. Competition in the market is intense, with established players like Honeywell, ABB, Siemens, and Rockwell Automation competing alongside emerging technology providers. Strategic partnerships and acquisitions are prevalent as companies seek to expand their product portfolios and enhance their market presence within specific segments. Future market dynamics will largely be shaped by advancements in artificial intelligence, the expansion of 5G networks, and the development of more robust cybersecurity measures to address the growing concerns about data privacy and security within interconnected industrial environments. The continued integration of these technologies will further propel the growth of the Industry 4.0 market.
Industry 4.0 Market: A Comprehensive Report (2019-2033)
This comprehensive report provides a detailed analysis of the Industry 4.0 market, encompassing its dynamics, growth trends, dominant segments, and key players. With a study period spanning 2019-2033, a base year of 2025, and a forecast period of 2025-2033, this report offers invaluable insights for industry professionals seeking to navigate the complexities of this rapidly evolving landscape. The market is segmented by Technology Type (Industrial Robotics, IIoT, AI and ML, Blockchain, Extended Reality, Digital Twin, 3D Printing, Other Technology Types) and End-user Industry (Manufacturing, Automotive, Oil and Gas, Energy and Utilities, Electronics and Foundry, Food and Beverage, Aerospace and Defense, Other End-user Industries). The total market size is projected to reach xx Million by 2033.
Industry 4.0 Market Dynamics & Structure
The Industry 4.0 market is characterized by a moderately concentrated landscape, with key players such as Honeywell International Inc., ABB Ltd., and Siemens AG holding significant market shares. However, the market is also witnessing increased competition from smaller, agile companies specializing in niche technologies. Technological innovation is a key driver, fueled by advancements in AI, machine learning, and the Internet of Things (IoT). Regulatory frameworks, including data privacy regulations and cybersecurity standards, are increasingly shaping market dynamics. The market also experiences competitive pressure from substitute technologies, such as legacy automation systems. The end-user demographics are diverse, with significant adoption across various sectors, reflecting a broad range of needs and applications. M&A activity is frequent, reflecting strategic moves by larger companies to expand their product portfolios and geographic reach.
- Market Concentration: Moderately concentrated, with top players holding approximately xx% market share in 2025.
- Technological Innovation: Rapid advancements in AI, ML, and IoT are driving market growth.
- Regulatory Framework: Data privacy and cybersecurity regulations are increasing in importance.
- Competitive Substitutes: Legacy automation systems and emerging technologies present competitive threats.
- End-User Demographics: Diverse, with significant adoption across multiple industries.
- M&A Trends: Frequent mergers and acquisitions to expand product portfolios and geographic reach. Approximately xx M&A deals occurred between 2019 and 2024.
Industry 4.0 Market Growth Trends & Insights
The Industry 4.0 market has experienced significant growth over the historical period (2019-2024), with a CAGR of xx%. This growth is driven by increasing adoption of smart factories, rising demand for automation and efficiency, and the increasing availability of affordable and scalable technologies. The market is expected to continue its upward trajectory, with a projected CAGR of xx% during the forecast period (2025-2033). The adoption rate of Industry 4.0 technologies is steadily increasing across various end-user industries, fueled by the proven benefits of improved productivity, reduced operational costs, and enhanced product quality. Technological disruptions, such as the emergence of 5G and edge computing, are accelerating market growth and creating new opportunities for innovation. Consumer behavior shifts towards greater demand for personalized products and faster delivery times are further driving adoption. Market penetration is estimated at xx% in 2025 and is projected to reach xx% by 2033.
Dominant Regions, Countries, or Segments in Industry 4.0 Market
North America and Europe currently dominate the Industry 4.0 market, driven by high technological maturity, robust industrial infrastructure, and supportive government policies. However, Asia-Pacific is expected to experience rapid growth in the coming years, fueled by increasing industrialization and government investments in digital transformation. Within technology types, Industrial Robotics and IIoT currently hold the largest market share, with AI and ML rapidly gaining traction. The Manufacturing and Automotive sectors are major end-user industries, contributing significantly to overall market demand.
Key Drivers:
- North America: High technological maturity and robust industrial base.
- Europe: Strong government support for digital transformation initiatives.
- Asia-Pacific: Rapid industrialization and increasing investments in Industry 4.0 technologies.
- Technology Type: Industrial Robotics and IIoT are leading segments.
- End-user Industry: Manufacturing and Automotive sectors driving market demand.
Dominance Factors:
- Advanced infrastructure and skilled workforce in North America and Europe.
- Government support and favorable regulatory environment.
- High adoption rates in mature manufacturing and automotive sectors.
Industry 4.0 Market Product Landscape
Industry 4.0 product offerings are characterized by ongoing innovation, with a focus on enhancing efficiency, improving data analytics, and integrating various technologies. Products range from sophisticated industrial robots and advanced sensors to cloud-based platforms and AI-powered software solutions. Unique selling propositions often include improved operational flexibility, reduced downtime, and enhanced product quality. Technological advancements are driven by the integration of AI, ML, and IoT, allowing for predictive maintenance, real-time data analysis, and autonomous operations.
Key Drivers, Barriers & Challenges in Industry 4.0 Market
Key Drivers: Technological advancements (AI, IoT, 5G), increasing demand for automation and efficiency, government support for digital transformation initiatives, and the growing need for data-driven decision-making are all major drivers of market growth. For instance, the development of faster and more efficient AI-powered technologies like GE Healthcare's Sonic DL significantly reduces MRI scan times, driving increased adoption in the healthcare sector.
Key Challenges: High initial investment costs, cybersecurity concerns, integration complexities, skills gap in the workforce, and regulatory uncertainties present significant obstacles. Supply chain disruptions can also lead to project delays and increased costs. For example, the xx% reduction in satellite launch container bulk using 3D printing showcases the cost-saving potential but also highlights potential challenges in achieving widespread adoption of this technology.
Emerging Opportunities in Industry 4.0 Market
Untapped markets in developing economies, particularly in sectors like agriculture and healthcare, present significant opportunities. The growing adoption of edge computing and 5G technologies is opening new avenues for real-time data processing and analysis. Innovative applications of AI and ML in predictive maintenance and quality control are generating considerable interest. Evolving consumer preferences for customized products and enhanced sustainability are further driving market growth.
Growth Accelerators in the Industry 4.0 Market Industry
Strategic partnerships between technology providers and end-user industries are crucial for accelerating adoption. Technological breakthroughs such as the development of advanced sensors and AI algorithms are constantly pushing the boundaries of what is possible. Government initiatives aimed at promoting digital transformation and smart manufacturing are boosting market growth. The expansion of Industry 4.0 applications into new sectors and geographic regions offers significant growth potential.
Key Players Shaping the Industry 4.0 Market Market
- Honeywell International Inc
- ABB Ltd
- Johnson Controls International PLC
- Denso Corporation
- Cognex Corporation
- Cisco Systems Inc
- Siemens AG
- Fanuc Corporation
- Schneider Electric
- Robert Bosch GmbH
- Rockwell Automation Inc
- General Electric Company
- Intel Corporation
- Swisslog Holding AG (Kuka AG)
- Emerson Electric Company
Notable Milestones in Industry 4.0 Market Sector
- June 2023: GE HealthCare introduces Sonic DL, an AI deep learning technology for faster MRI imaging. This significantly improves the speed and efficiency of medical imaging.
- January 2023: Creatz3D launches a lightweight 3D-printed satellite launch container, demonstrating the cost and time-saving potential of additive manufacturing in aerospace.
In-Depth Industry 4.0 Market Market Outlook
The Industry 4.0 market is poised for substantial growth, driven by sustained technological innovation, increasing adoption across diverse sectors, and supportive government policies. The convergence of AI, IoT, and other enabling technologies will unlock new opportunities for improved efficiency, enhanced productivity, and the creation of entirely new business models. Strategic partnerships and collaborations will be crucial in driving market expansion and accelerating the adoption of Industry 4.0 solutions. The market's long-term potential is considerable, offering significant rewards for companies that can successfully navigate the challenges and capitalize on the emerging opportunities.
Industry 4.0 Market Segmentation
-
1. Technology Type
- 1.1. Industrial Robotics
- 1.2. IIoT
- 1.3. AI and ML
- 1.4. Blockchain
- 1.5. Extended Reality
- 1.6. Digital Twin
- 1.7. 3D Printing
- 1.8. Other Technology Types
-
2. End-user Industry
- 2.1. Manufacturing
- 2.2. Automotive
- 2.3. Oil and Gas
- 2.4. Energy and Utilities
- 2.5. Electronics and Foundry
- 2.6. Food and Beverage
- 2.7. Aerospace and Defense
- 2.8. Other End-user Industries
Industry 4.0 Market Segmentation By Geography
-
1. North America
- 1.1. United States
- 1.2. Canada
-
2. Europe
- 2.1. Germany
- 2.2. United Kingdom
- 2.3. France
- 2.4. Spain
-
3. Asia
- 3.1. India
- 3.2. China
- 3.3. Japan
- 4. Australia and New Zealand
- 5. Latin America
- 6. Middle East and Africa
Industry 4.0 Market REPORT HIGHLIGHTS
| Aspects | Details |
|---|---|
| Study Period | 2019-2033 |
| Base Year | 2024 |
| Estimated Year | 2025 |
| Forecast Period | 2025-2033 |
| Historical Period | 2019-2024 |
| Growth Rate | CAGR of 20.67% from 2019-2033 |
| Segmentation |
|
Table of Contents
- 1. Introduction
- 1.1. Research Scope
- 1.2. Market Segmentation
- 1.3. Research Methodology
- 1.4. Definitions and Assumptions
- 2. Executive Summary
- 2.1. Introduction
- 3. Market Dynamics
- 3.1. Introduction
- 3.2. Market Drivers
- 3.2.1. Favorable Governmental Initiatives and Collaborations Between Stakeholders; Growth in Demand for Industrial Robotics; Digital Transformation Initiatives Undertaken by SMEs
- 3.3. Market Restrains
- 3.3.1. Relative Lack of Awareness on the ROI Related to Adoption of Industry 4.; Workforce and Standardization Related Challenges
- 3.4. Market Trends
- 3.4.1. IIoT Technology Type Segment is Expected to Hold Significant Market Share
- 4. Market Factor Analysis
- 4.1. Porters Five Forces
- 4.2. Supply/Value Chain
- 4.3. PESTEL analysis
- 4.4. Market Entropy
- 4.5. Patent/Trademark Analysis
- 5. Global Industry 4.0 Market Analysis, Insights and Forecast, 2019-2031
- 5.1. Market Analysis, Insights and Forecast - by Technology Type
- 5.1.1. Industrial Robotics
- 5.1.2. IIoT
- 5.1.3. AI and ML
- 5.1.4. Blockchain
- 5.1.5. Extended Reality
- 5.1.6. Digital Twin
- 5.1.7. 3D Printing
- 5.1.8. Other Technology Types
- 5.2. Market Analysis, Insights and Forecast - by End-user Industry
- 5.2.1. Manufacturing
- 5.2.2. Automotive
- 5.2.3. Oil and Gas
- 5.2.4. Energy and Utilities
- 5.2.5. Electronics and Foundry
- 5.2.6. Food and Beverage
- 5.2.7. Aerospace and Defense
- 5.2.8. Other End-user Industries
- 5.3. Market Analysis, Insights and Forecast - by Region
- 5.3.1. North America
- 5.3.2. Europe
- 5.3.3. Asia
- 5.3.4. Australia and New Zealand
- 5.3.5. Latin America
- 5.3.6. Middle East and Africa
- 5.1. Market Analysis, Insights and Forecast - by Technology Type
- 6. North America Industry 4.0 Market Analysis, Insights and Forecast, 2019-2031
- 6.1. Market Analysis, Insights and Forecast - by Technology Type
- 6.1.1. Industrial Robotics
- 6.1.2. IIoT
- 6.1.3. AI and ML
- 6.1.4. Blockchain
- 6.1.5. Extended Reality
- 6.1.6. Digital Twin
- 6.1.7. 3D Printing
- 6.1.8. Other Technology Types
- 6.2. Market Analysis, Insights and Forecast - by End-user Industry
- 6.2.1. Manufacturing
- 6.2.2. Automotive
- 6.2.3. Oil and Gas
- 6.2.4. Energy and Utilities
- 6.2.5. Electronics and Foundry
- 6.2.6. Food and Beverage
- 6.2.7. Aerospace and Defense
- 6.2.8. Other End-user Industries
- 6.1. Market Analysis, Insights and Forecast - by Technology Type
- 7. Europe Industry 4.0 Market Analysis, Insights and Forecast, 2019-2031
- 7.1. Market Analysis, Insights and Forecast - by Technology Type
- 7.1.1. Industrial Robotics
- 7.1.2. IIoT
- 7.1.3. AI and ML
- 7.1.4. Blockchain
- 7.1.5. Extended Reality
- 7.1.6. Digital Twin
- 7.1.7. 3D Printing
- 7.1.8. Other Technology Types
- 7.2. Market Analysis, Insights and Forecast - by End-user Industry
- 7.2.1. Manufacturing
- 7.2.2. Automotive
- 7.2.3. Oil and Gas
- 7.2.4. Energy and Utilities
- 7.2.5. Electronics and Foundry
- 7.2.6. Food and Beverage
- 7.2.7. Aerospace and Defense
- 7.2.8. Other End-user Industries
- 7.1. Market Analysis, Insights and Forecast - by Technology Type
- 8. Asia Industry 4.0 Market Analysis, Insights and Forecast, 2019-2031
- 8.1. Market Analysis, Insights and Forecast - by Technology Type
- 8.1.1. Industrial Robotics
- 8.1.2. IIoT
- 8.1.3. AI and ML
- 8.1.4. Blockchain
- 8.1.5. Extended Reality
- 8.1.6. Digital Twin
- 8.1.7. 3D Printing
- 8.1.8. Other Technology Types
- 8.2. Market Analysis, Insights and Forecast - by End-user Industry
- 8.2.1. Manufacturing
- 8.2.2. Automotive
- 8.2.3. Oil and Gas
- 8.2.4. Energy and Utilities
- 8.2.5. Electronics and Foundry
- 8.2.6. Food and Beverage
- 8.2.7. Aerospace and Defense
- 8.2.8. Other End-user Industries
- 8.1. Market Analysis, Insights and Forecast - by Technology Type
- 9. Australia and New Zealand Industry 4.0 Market Analysis, Insights and Forecast, 2019-2031
- 9.1. Market Analysis, Insights and Forecast - by Technology Type
- 9.1.1. Industrial Robotics
- 9.1.2. IIoT
- 9.1.3. AI and ML
- 9.1.4. Blockchain
- 9.1.5. Extended Reality
- 9.1.6. Digital Twin
- 9.1.7. 3D Printing
- 9.1.8. Other Technology Types
- 9.2. Market Analysis, Insights and Forecast - by End-user Industry
- 9.2.1. Manufacturing
- 9.2.2. Automotive
- 9.2.3. Oil and Gas
- 9.2.4. Energy and Utilities
- 9.2.5. Electronics and Foundry
- 9.2.6. Food and Beverage
- 9.2.7. Aerospace and Defense
- 9.2.8. Other End-user Industries
- 9.1. Market Analysis, Insights and Forecast - by Technology Type
- 10. Latin America Industry 4.0 Market Analysis, Insights and Forecast, 2019-2031
- 10.1. Market Analysis, Insights and Forecast - by Technology Type
- 10.1.1. Industrial Robotics
- 10.1.2. IIoT
- 10.1.3. AI and ML
- 10.1.4. Blockchain
- 10.1.5. Extended Reality
- 10.1.6. Digital Twin
- 10.1.7. 3D Printing
- 10.1.8. Other Technology Types
- 10.2. Market Analysis, Insights and Forecast - by End-user Industry
- 10.2.1. Manufacturing
- 10.2.2. Automotive
- 10.2.3. Oil and Gas
- 10.2.4. Energy and Utilities
- 10.2.5. Electronics and Foundry
- 10.2.6. Food and Beverage
- 10.2.7. Aerospace and Defense
- 10.2.8. Other End-user Industries
- 10.1. Market Analysis, Insights and Forecast - by Technology Type
- 11. Middle East and Africa Industry 4.0 Market Analysis, Insights and Forecast, 2019-2031
- 11.1. Market Analysis, Insights and Forecast - by Technology Type
- 11.1.1. Industrial Robotics
- 11.1.2. IIoT
- 11.1.3. AI and ML
- 11.1.4. Blockchain
- 11.1.5. Extended Reality
- 11.1.6. Digital Twin
- 11.1.7. 3D Printing
- 11.1.8. Other Technology Types
- 11.2. Market Analysis, Insights and Forecast - by End-user Industry
- 11.2.1. Manufacturing
- 11.2.2. Automotive
- 11.2.3. Oil and Gas
- 11.2.4. Energy and Utilities
- 11.2.5. Electronics and Foundry
- 11.2.6. Food and Beverage
- 11.2.7. Aerospace and Defense
- 11.2.8. Other End-user Industries
- 11.1. Market Analysis, Insights and Forecast - by Technology Type
- 12. North America Industry 4.0 Market Analysis, Insights and Forecast, 2019-2031
- 12.1. Market Analysis, Insights and Forecast - By Country/Sub-region
- 12.1.1. undefined
- 13. Europe Industry 4.0 Market Analysis, Insights and Forecast, 2019-2031
- 13.1. Market Analysis, Insights and Forecast - By Country/Sub-region
- 13.1.1. undefined
- 14. Asia Pacific Industry 4.0 Market Analysis, Insights and Forecast, 2019-2031
- 14.1. Market Analysis, Insights and Forecast - By Country/Sub-region
- 14.1.1. undefined
- 15. South America Industry 4.0 Market Analysis, Insights and Forecast, 2019-2031
- 15.1. Market Analysis, Insights and Forecast - By Country/Sub-region
- 15.1.1. undefined
- 16. North America Industry 4.0 Market Analysis, Insights and Forecast, 2019-2031
- 16.1. Market Analysis, Insights and Forecast - By Country/Sub-region
- 16.1.1. undefined
- 17. MEA Industry 4.0 Market Analysis, Insights and Forecast, 2019-2031
- 17.1. Market Analysis, Insights and Forecast - By Country/Sub-region
- 17.1.1. undefined
- 18. Competitive Analysis
- 18.1. Global Market Share Analysis 2024
- 18.2. Company Profiles
- 18.2.1 Honeywell International Inc
- 18.2.1.1. Overview
- 18.2.1.2. Products
- 18.2.1.3. SWOT Analysis
- 18.2.1.4. Recent Developments
- 18.2.1.5. Financials (Based on Availability)
- 18.2.2 ABB Ltd
- 18.2.2.1. Overview
- 18.2.2.2. Products
- 18.2.2.3. SWOT Analysis
- 18.2.2.4. Recent Developments
- 18.2.2.5. Financials (Based on Availability)
- 18.2.3 Johnson Controls International PLC
- 18.2.3.1. Overview
- 18.2.3.2. Products
- 18.2.3.3. SWOT Analysis
- 18.2.3.4. Recent Developments
- 18.2.3.5. Financials (Based on Availability)
- 18.2.4 Denso Corporation
- 18.2.4.1. Overview
- 18.2.4.2. Products
- 18.2.4.3. SWOT Analysis
- 18.2.4.4. Recent Developments
- 18.2.4.5. Financials (Based on Availability)
- 18.2.5 Cognex Corporation
- 18.2.5.1. Overview
- 18.2.5.2. Products
- 18.2.5.3. SWOT Analysis
- 18.2.5.4. Recent Developments
- 18.2.5.5. Financials (Based on Availability)
- 18.2.6 Cisco Systems Inc
- 18.2.6.1. Overview
- 18.2.6.2. Products
- 18.2.6.3. SWOT Analysis
- 18.2.6.4. Recent Developments
- 18.2.6.5. Financials (Based on Availability)
- 18.2.7 Siemens AG
- 18.2.7.1. Overview
- 18.2.7.2. Products
- 18.2.7.3. SWOT Analysis
- 18.2.7.4. Recent Developments
- 18.2.7.5. Financials (Based on Availability)
- 18.2.8 Fanuc Corporation
- 18.2.8.1. Overview
- 18.2.8.2. Products
- 18.2.8.3. SWOT Analysis
- 18.2.8.4. Recent Developments
- 18.2.8.5. Financials (Based on Availability)
- 18.2.9 Schneider Electric
- 18.2.9.1. Overview
- 18.2.9.2. Products
- 18.2.9.3. SWOT Analysis
- 18.2.9.4. Recent Developments
- 18.2.9.5. Financials (Based on Availability)
- 18.2.10 Robert Bosch GmbH
- 18.2.10.1. Overview
- 18.2.10.2. Products
- 18.2.10.3. SWOT Analysis
- 18.2.10.4. Recent Developments
- 18.2.10.5. Financials (Based on Availability)
- 18.2.11 Rockwell Automation Inc
- 18.2.11.1. Overview
- 18.2.11.2. Products
- 18.2.11.3. SWOT Analysis
- 18.2.11.4. Recent Developments
- 18.2.11.5. Financials (Based on Availability)
- 18.2.12 General Electric Company
- 18.2.12.1. Overview
- 18.2.12.2. Products
- 18.2.12.3. SWOT Analysis
- 18.2.12.4. Recent Developments
- 18.2.12.5. Financials (Based on Availability)
- 18.2.13 Intel Corporation
- 18.2.13.1. Overview
- 18.2.13.2. Products
- 18.2.13.3. SWOT Analysis
- 18.2.13.4. Recent Developments
- 18.2.13.5. Financials (Based on Availability)
- 18.2.14 Swisslog Holding AG (Kuka AG)
- 18.2.14.1. Overview
- 18.2.14.2. Products
- 18.2.14.3. SWOT Analysis
- 18.2.14.4. Recent Developments
- 18.2.14.5. Financials (Based on Availability)
- 18.2.15 Emerson Electric Company
- 18.2.15.1. Overview
- 18.2.15.2. Products
- 18.2.15.3. SWOT Analysis
- 18.2.15.4. Recent Developments
- 18.2.15.5. Financials (Based on Availability)
- 18.2.1 Honeywell International Inc
List of Figures
- Figure 1: Global Industry 4.0 Market Revenue Breakdown (Million, %) by Region 2024 & 2032
- Figure 2: Global Industry 4.0 Market Volume Breakdown (K Units, %) by Region 2024 & 2032
- Figure 3: North America Industry 4.0 Market Revenue (Million), by Country 2024 & 2032
- Figure 4: North America Industry 4.0 Market Volume (K Units), by Country 2024 & 2032
- Figure 5: North America Industry 4.0 Market Revenue Share (%), by Country 2024 & 2032
- Figure 6: North America Industry 4.0 Market Volume Share (%), by Country 2024 & 2032
- Figure 7: Europe Industry 4.0 Market Revenue (Million), by Country 2024 & 2032
- Figure 8: Europe Industry 4.0 Market Volume (K Units), by Country 2024 & 2032
- Figure 9: Europe Industry 4.0 Market Revenue Share (%), by Country 2024 & 2032
- Figure 10: Europe Industry 4.0 Market Volume Share (%), by Country 2024 & 2032
- Figure 11: Asia Pacific Industry 4.0 Market Revenue (Million), by Country 2024 & 2032
- Figure 12: Asia Pacific Industry 4.0 Market Volume (K Units), by Country 2024 & 2032
- Figure 13: Asia Pacific Industry 4.0 Market Revenue Share (%), by Country 2024 & 2032
- Figure 14: Asia Pacific Industry 4.0 Market Volume Share (%), by Country 2024 & 2032
- Figure 15: South America Industry 4.0 Market Revenue (Million), by Country 2024 & 2032
- Figure 16: South America Industry 4.0 Market Volume (K Units), by Country 2024 & 2032
- Figure 17: South America Industry 4.0 Market Revenue Share (%), by Country 2024 & 2032
- Figure 18: South America Industry 4.0 Market Volume Share (%), by Country 2024 & 2032
- Figure 19: North America Industry 4.0 Market Revenue (Million), by Country 2024 & 2032
- Figure 20: North America Industry 4.0 Market Volume (K Units), by Country 2024 & 2032
- Figure 21: North America Industry 4.0 Market Revenue Share (%), by Country 2024 & 2032
- Figure 22: North America Industry 4.0 Market Volume Share (%), by Country 2024 & 2032
- Figure 23: MEA Industry 4.0 Market Revenue (Million), by Country 2024 & 2032
- Figure 24: MEA Industry 4.0 Market Volume (K Units), by Country 2024 & 2032
- Figure 25: MEA Industry 4.0 Market Revenue Share (%), by Country 2024 & 2032
- Figure 26: MEA Industry 4.0 Market Volume Share (%), by Country 2024 & 2032
- Figure 27: North America Industry 4.0 Market Revenue (Million), by Technology Type 2024 & 2032
- Figure 28: North America Industry 4.0 Market Volume (K Units), by Technology Type 2024 & 2032
- Figure 29: North America Industry 4.0 Market Revenue Share (%), by Technology Type 2024 & 2032
- Figure 30: North America Industry 4.0 Market Volume Share (%), by Technology Type 2024 & 2032
- Figure 31: North America Industry 4.0 Market Revenue (Million), by End-user Industry 2024 & 2032
- Figure 32: North America Industry 4.0 Market Volume (K Units), by End-user Industry 2024 & 2032
- Figure 33: North America Industry 4.0 Market Revenue Share (%), by End-user Industry 2024 & 2032
- Figure 34: North America Industry 4.0 Market Volume Share (%), by End-user Industry 2024 & 2032
- Figure 35: North America Industry 4.0 Market Revenue (Million), by Country 2024 & 2032
- Figure 36: North America Industry 4.0 Market Volume (K Units), by Country 2024 & 2032
- Figure 37: North America Industry 4.0 Market Revenue Share (%), by Country 2024 & 2032
- Figure 38: North America Industry 4.0 Market Volume Share (%), by Country 2024 & 2032
- Figure 39: Europe Industry 4.0 Market Revenue (Million), by Technology Type 2024 & 2032
- Figure 40: Europe Industry 4.0 Market Volume (K Units), by Technology Type 2024 & 2032
- Figure 41: Europe Industry 4.0 Market Revenue Share (%), by Technology Type 2024 & 2032
- Figure 42: Europe Industry 4.0 Market Volume Share (%), by Technology Type 2024 & 2032
- Figure 43: Europe Industry 4.0 Market Revenue (Million), by End-user Industry 2024 & 2032
- Figure 44: Europe Industry 4.0 Market Volume (K Units), by End-user Industry 2024 & 2032
- Figure 45: Europe Industry 4.0 Market Revenue Share (%), by End-user Industry 2024 & 2032
- Figure 46: Europe Industry 4.0 Market Volume Share (%), by End-user Industry 2024 & 2032
- Figure 47: Europe Industry 4.0 Market Revenue (Million), by Country 2024 & 2032
- Figure 48: Europe Industry 4.0 Market Volume (K Units), by Country 2024 & 2032
- Figure 49: Europe Industry 4.0 Market Revenue Share (%), by Country 2024 & 2032
- Figure 50: Europe Industry 4.0 Market Volume Share (%), by Country 2024 & 2032
- Figure 51: Asia Industry 4.0 Market Revenue (Million), by Technology Type 2024 & 2032
- Figure 52: Asia Industry 4.0 Market Volume (K Units), by Technology Type 2024 & 2032
- Figure 53: Asia Industry 4.0 Market Revenue Share (%), by Technology Type 2024 & 2032
- Figure 54: Asia Industry 4.0 Market Volume Share (%), by Technology Type 2024 & 2032
- Figure 55: Asia Industry 4.0 Market Revenue (Million), by End-user Industry 2024 & 2032
- Figure 56: Asia Industry 4.0 Market Volume (K Units), by End-user Industry 2024 & 2032
- Figure 57: Asia Industry 4.0 Market Revenue Share (%), by End-user Industry 2024 & 2032
- Figure 58: Asia Industry 4.0 Market Volume Share (%), by End-user Industry 2024 & 2032
- Figure 59: Asia Industry 4.0 Market Revenue (Million), by Country 2024 & 2032
- Figure 60: Asia Industry 4.0 Market Volume (K Units), by Country 2024 & 2032
- Figure 61: Asia Industry 4.0 Market Revenue Share (%), by Country 2024 & 2032
- Figure 62: Asia Industry 4.0 Market Volume Share (%), by Country 2024 & 2032
- Figure 63: Australia and New Zealand Industry 4.0 Market Revenue (Million), by Technology Type 2024 & 2032
- Figure 64: Australia and New Zealand Industry 4.0 Market Volume (K Units), by Technology Type 2024 & 2032
- Figure 65: Australia and New Zealand Industry 4.0 Market Revenue Share (%), by Technology Type 2024 & 2032
- Figure 66: Australia and New Zealand Industry 4.0 Market Volume Share (%), by Technology Type 2024 & 2032
- Figure 67: Australia and New Zealand Industry 4.0 Market Revenue (Million), by End-user Industry 2024 & 2032
- Figure 68: Australia and New Zealand Industry 4.0 Market Volume (K Units), by End-user Industry 2024 & 2032
- Figure 69: Australia and New Zealand Industry 4.0 Market Revenue Share (%), by End-user Industry 2024 & 2032
- Figure 70: Australia and New Zealand Industry 4.0 Market Volume Share (%), by End-user Industry 2024 & 2032
- Figure 71: Australia and New Zealand Industry 4.0 Market Revenue (Million), by Country 2024 & 2032
- Figure 72: Australia and New Zealand Industry 4.0 Market Volume (K Units), by Country 2024 & 2032
- Figure 73: Australia and New Zealand Industry 4.0 Market Revenue Share (%), by Country 2024 & 2032
- Figure 74: Australia and New Zealand Industry 4.0 Market Volume Share (%), by Country 2024 & 2032
- Figure 75: Latin America Industry 4.0 Market Revenue (Million), by Technology Type 2024 & 2032
- Figure 76: Latin America Industry 4.0 Market Volume (K Units), by Technology Type 2024 & 2032
- Figure 77: Latin America Industry 4.0 Market Revenue Share (%), by Technology Type 2024 & 2032
- Figure 78: Latin America Industry 4.0 Market Volume Share (%), by Technology Type 2024 & 2032
- Figure 79: Latin America Industry 4.0 Market Revenue (Million), by End-user Industry 2024 & 2032
- Figure 80: Latin America Industry 4.0 Market Volume (K Units), by End-user Industry 2024 & 2032
- Figure 81: Latin America Industry 4.0 Market Revenue Share (%), by End-user Industry 2024 & 2032
- Figure 82: Latin America Industry 4.0 Market Volume Share (%), by End-user Industry 2024 & 2032
- Figure 83: Latin America Industry 4.0 Market Revenue (Million), by Country 2024 & 2032
- Figure 84: Latin America Industry 4.0 Market Volume (K Units), by Country 2024 & 2032
- Figure 85: Latin America Industry 4.0 Market Revenue Share (%), by Country 2024 & 2032
- Figure 86: Latin America Industry 4.0 Market Volume Share (%), by Country 2024 & 2032
- Figure 87: Middle East and Africa Industry 4.0 Market Revenue (Million), by Technology Type 2024 & 2032
- Figure 88: Middle East and Africa Industry 4.0 Market Volume (K Units), by Technology Type 2024 & 2032
- Figure 89: Middle East and Africa Industry 4.0 Market Revenue Share (%), by Technology Type 2024 & 2032
- Figure 90: Middle East and Africa Industry 4.0 Market Volume Share (%), by Technology Type 2024 & 2032
- Figure 91: Middle East and Africa Industry 4.0 Market Revenue (Million), by End-user Industry 2024 & 2032
- Figure 92: Middle East and Africa Industry 4.0 Market Volume (K Units), by End-user Industry 2024 & 2032
- Figure 93: Middle East and Africa Industry 4.0 Market Revenue Share (%), by End-user Industry 2024 & 2032
- Figure 94: Middle East and Africa Industry 4.0 Market Volume Share (%), by End-user Industry 2024 & 2032
- Figure 95: Middle East and Africa Industry 4.0 Market Revenue (Million), by Country 2024 & 2032
- Figure 96: Middle East and Africa Industry 4.0 Market Volume (K Units), by Country 2024 & 2032
- Figure 97: Middle East and Africa Industry 4.0 Market Revenue Share (%), by Country 2024 & 2032
- Figure 98: Middle East and Africa Industry 4.0 Market Volume Share (%), by Country 2024 & 2032
List of Tables
- Table 1: Global Industry 4.0 Market Revenue Million Forecast, by Region 2019 & 2032
- Table 2: Global Industry 4.0 Market Volume K Units Forecast, by Region 2019 & 2032
- Table 3: Global Industry 4.0 Market Revenue Million Forecast, by Technology Type 2019 & 2032
- Table 4: Global Industry 4.0 Market Volume K Units Forecast, by Technology Type 2019 & 2032
- Table 5: Global Industry 4.0 Market Revenue Million Forecast, by End-user Industry 2019 & 2032
- Table 6: Global Industry 4.0 Market Volume K Units Forecast, by End-user Industry 2019 & 2032
- Table 7: Global Industry 4.0 Market Revenue Million Forecast, by Region 2019 & 2032
- Table 8: Global Industry 4.0 Market Volume K Units Forecast, by Region 2019 & 2032
- Table 9: Global Industry 4.0 Market Revenue Million Forecast, by Country 2019 & 2032
- Table 10: Global Industry 4.0 Market Volume K Units Forecast, by Country 2019 & 2032
- Table 11: Global Industry 4.0 Market Revenue Million Forecast, by Country 2019 & 2032
- Table 12: Global Industry 4.0 Market Volume K Units Forecast, by Country 2019 & 2032
- Table 13: Global Industry 4.0 Market Revenue Million Forecast, by Country 2019 & 2032
- Table 14: Global Industry 4.0 Market Volume K Units Forecast, by Country 2019 & 2032
- Table 15: Global Industry 4.0 Market Revenue Million Forecast, by Country 2019 & 2032
- Table 16: Global Industry 4.0 Market Volume K Units Forecast, by Country 2019 & 2032
- Table 17: Global Industry 4.0 Market Revenue Million Forecast, by Country 2019 & 2032
- Table 18: Global Industry 4.0 Market Volume K Units Forecast, by Country 2019 & 2032
- Table 19: Global Industry 4.0 Market Revenue Million Forecast, by Country 2019 & 2032
- Table 20: Global Industry 4.0 Market Volume K Units Forecast, by Country 2019 & 2032
- Table 21: Global Industry 4.0 Market Revenue Million Forecast, by Technology Type 2019 & 2032
- Table 22: Global Industry 4.0 Market Volume K Units Forecast, by Technology Type 2019 & 2032
- Table 23: Global Industry 4.0 Market Revenue Million Forecast, by End-user Industry 2019 & 2032
- Table 24: Global Industry 4.0 Market Volume K Units Forecast, by End-user Industry 2019 & 2032
- Table 25: Global Industry 4.0 Market Revenue Million Forecast, by Country 2019 & 2032
- Table 26: Global Industry 4.0 Market Volume K Units Forecast, by Country 2019 & 2032
- Table 27: United States Industry 4.0 Market Revenue (Million) Forecast, by Application 2019 & 2032
- Table 28: United States Industry 4.0 Market Volume (K Units) Forecast, by Application 2019 & 2032
- Table 29: Canada Industry 4.0 Market Revenue (Million) Forecast, by Application 2019 & 2032
- Table 30: Canada Industry 4.0 Market Volume (K Units) Forecast, by Application 2019 & 2032
- Table 31: Global Industry 4.0 Market Revenue Million Forecast, by Technology Type 2019 & 2032
- Table 32: Global Industry 4.0 Market Volume K Units Forecast, by Technology Type 2019 & 2032
- Table 33: Global Industry 4.0 Market Revenue Million Forecast, by End-user Industry 2019 & 2032
- Table 34: Global Industry 4.0 Market Volume K Units Forecast, by End-user Industry 2019 & 2032
- Table 35: Global Industry 4.0 Market Revenue Million Forecast, by Country 2019 & 2032
- Table 36: Global Industry 4.0 Market Volume K Units Forecast, by Country 2019 & 2032
- Table 37: Germany Industry 4.0 Market Revenue (Million) Forecast, by Application 2019 & 2032
- Table 38: Germany Industry 4.0 Market Volume (K Units) Forecast, by Application 2019 & 2032
- Table 39: United Kingdom Industry 4.0 Market Revenue (Million) Forecast, by Application 2019 & 2032
- Table 40: United Kingdom Industry 4.0 Market Volume (K Units) Forecast, by Application 2019 & 2032
- Table 41: France Industry 4.0 Market Revenue (Million) Forecast, by Application 2019 & 2032
- Table 42: France Industry 4.0 Market Volume (K Units) Forecast, by Application 2019 & 2032
- Table 43: Spain Industry 4.0 Market Revenue (Million) Forecast, by Application 2019 & 2032
- Table 44: Spain Industry 4.0 Market Volume (K Units) Forecast, by Application 2019 & 2032
- Table 45: Global Industry 4.0 Market Revenue Million Forecast, by Technology Type 2019 & 2032
- Table 46: Global Industry 4.0 Market Volume K Units Forecast, by Technology Type 2019 & 2032
- Table 47: Global Industry 4.0 Market Revenue Million Forecast, by End-user Industry 2019 & 2032
- Table 48: Global Industry 4.0 Market Volume K Units Forecast, by End-user Industry 2019 & 2032
- Table 49: Global Industry 4.0 Market Revenue Million Forecast, by Country 2019 & 2032
- Table 50: Global Industry 4.0 Market Volume K Units Forecast, by Country 2019 & 2032
- Table 51: India Industry 4.0 Market Revenue (Million) Forecast, by Application 2019 & 2032
- Table 52: India Industry 4.0 Market Volume (K Units) Forecast, by Application 2019 & 2032
- Table 53: China Industry 4.0 Market Revenue (Million) Forecast, by Application 2019 & 2032
- Table 54: China Industry 4.0 Market Volume (K Units) Forecast, by Application 2019 & 2032
- Table 55: Japan Industry 4.0 Market Revenue (Million) Forecast, by Application 2019 & 2032
- Table 56: Japan Industry 4.0 Market Volume (K Units) Forecast, by Application 2019 & 2032
- Table 57: Global Industry 4.0 Market Revenue Million Forecast, by Technology Type 2019 & 2032
- Table 58: Global Industry 4.0 Market Volume K Units Forecast, by Technology Type 2019 & 2032
- Table 59: Global Industry 4.0 Market Revenue Million Forecast, by End-user Industry 2019 & 2032
- Table 60: Global Industry 4.0 Market Volume K Units Forecast, by End-user Industry 2019 & 2032
- Table 61: Global Industry 4.0 Market Revenue Million Forecast, by Country 2019 & 2032
- Table 62: Global Industry 4.0 Market Volume K Units Forecast, by Country 2019 & 2032
- Table 63: Global Industry 4.0 Market Revenue Million Forecast, by Technology Type 2019 & 2032
- Table 64: Global Industry 4.0 Market Volume K Units Forecast, by Technology Type 2019 & 2032
- Table 65: Global Industry 4.0 Market Revenue Million Forecast, by End-user Industry 2019 & 2032
- Table 66: Global Industry 4.0 Market Volume K Units Forecast, by End-user Industry 2019 & 2032
- Table 67: Global Industry 4.0 Market Revenue Million Forecast, by Country 2019 & 2032
- Table 68: Global Industry 4.0 Market Volume K Units Forecast, by Country 2019 & 2032
- Table 69: Global Industry 4.0 Market Revenue Million Forecast, by Technology Type 2019 & 2032
- Table 70: Global Industry 4.0 Market Volume K Units Forecast, by Technology Type 2019 & 2032
- Table 71: Global Industry 4.0 Market Revenue Million Forecast, by End-user Industry 2019 & 2032
- Table 72: Global Industry 4.0 Market Volume K Units Forecast, by End-user Industry 2019 & 2032
- Table 73: Global Industry 4.0 Market Revenue Million Forecast, by Country 2019 & 2032
- Table 74: Global Industry 4.0 Market Volume K Units Forecast, by Country 2019 & 2032
Frequently Asked Questions
1. What is the projected Compound Annual Growth Rate (CAGR) of the Industry 4.0 Market?
The projected CAGR is approximately 20.67%.
2. Which companies are prominent players in the Industry 4.0 Market?
Key companies in the market include Honeywell International Inc, ABB Ltd, Johnson Controls International PLC, Denso Corporation, Cognex Corporation, Cisco Systems Inc, Siemens AG, Fanuc Corporation, Schneider Electric, Robert Bosch GmbH, Rockwell Automation Inc, General Electric Company, Intel Corporation, Swisslog Holding AG (Kuka AG), Emerson Electric Company.
3. What are the main segments of the Industry 4.0 Market?
The market segments include Technology Type, End-user Industry.
4. Can you provide details about the market size?
The market size is estimated to be USD XX Million as of 2022.
5. What are some drivers contributing to market growth?
Favorable Governmental Initiatives and Collaborations Between Stakeholders; Growth in Demand for Industrial Robotics; Digital Transformation Initiatives Undertaken by SMEs.
6. What are the notable trends driving market growth?
IIoT Technology Type Segment is Expected to Hold Significant Market Share.
7. Are there any restraints impacting market growth?
Relative Lack of Awareness on the ROI Related to Adoption of Industry 4.; Workforce and Standardization Related Challenges.
8. Can you provide examples of recent developments in the market?
June 2023: GE HealthCare Introduces Sonic DL, an advanced, FDA-Cleared AI Deep Learning Technology for Faster MRI. Sonic DL is a deep learning (DL) technology that primarily acquires high-quality magnetic resonance (MR) images up to around 12 times faster than conventional methods, allowing cardiac imaging within a single heartbeat.
9. What pricing options are available for accessing the report?
Pricing options include single-user, multi-user, and enterprise licenses priced at USD 4750, USD 5250, and USD 8750 respectively.
10. Is the market size provided in terms of value or volume?
The market size is provided in terms of value, measured in Million and volume, measured in K Units.
11. Are there any specific market keywords associated with the report?
Yes, the market keyword associated with the report is "Industry 4.0 Market," which aids in identifying and referencing the specific market segment covered.
12. How do I determine which pricing option suits my needs best?
The pricing options vary based on user requirements and access needs. Individual users may opt for single-user licenses, while businesses requiring broader access may choose multi-user or enterprise licenses for cost-effective access to the report.
13. Are there any additional resources or data provided in the Industry 4.0 Market report?
While the report offers comprehensive insights, it's advisable to review the specific contents or supplementary materials provided to ascertain if additional resources or data are available.
14. How can I stay updated on further developments or reports in the Industry 4.0 Market?
To stay informed about further developments, trends, and reports in the Industry 4.0 Market, consider subscribing to industry newsletters, following relevant companies and organizations, or regularly checking reputable industry news sources and publications.
Methodology
Step 1 - Identification of Relevant Samples Size from Population Database


Step 2 - Approaches for Defining Global Market Size (Value, Volume* & Price*)

Note*: In applicable scenarios
Step 3 - Data Sources
Primary Research
- Web Analytics
- Survey Reports
- Research Institute
- Latest Research Reports
- Opinion Leaders
Secondary Research
- Annual Reports
- White Paper
- Latest Press Release
- Industry Association
- Paid Database
- Investor Presentations

Step 4 - Data Triangulation
Involves using different sources of information in order to increase the validity of a study
These sources are likely to be stakeholders in a program - participants, other researchers, program staff, other community members, and so on.
Then we put all data in single framework & apply various statistical tools to find out the dynamic on the market.
During the analysis stage, feedback from the stakeholder groups would be compared to determine areas of agreement as well as areas of divergence


