
Key Insights
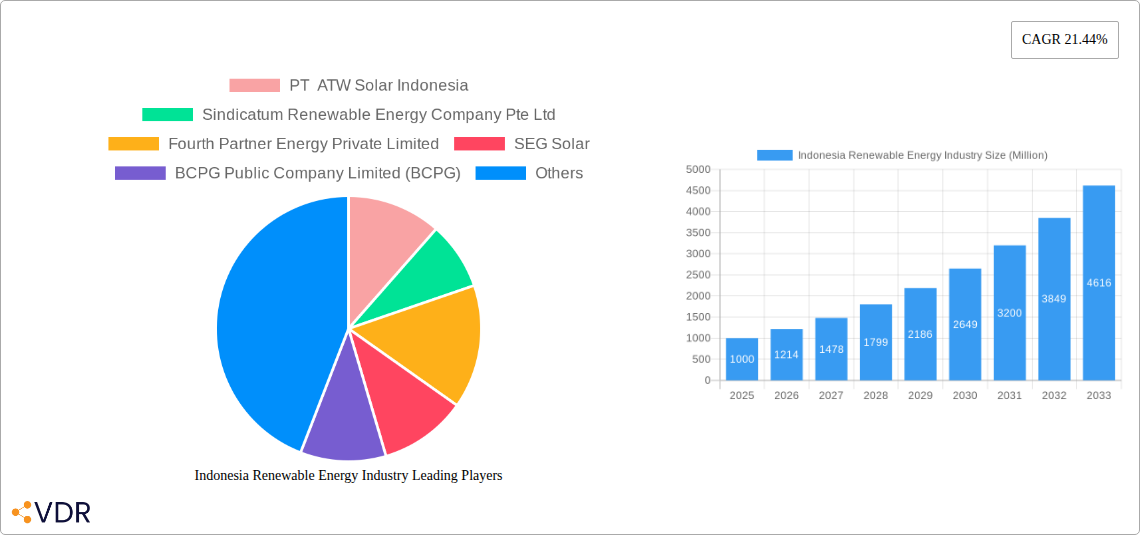
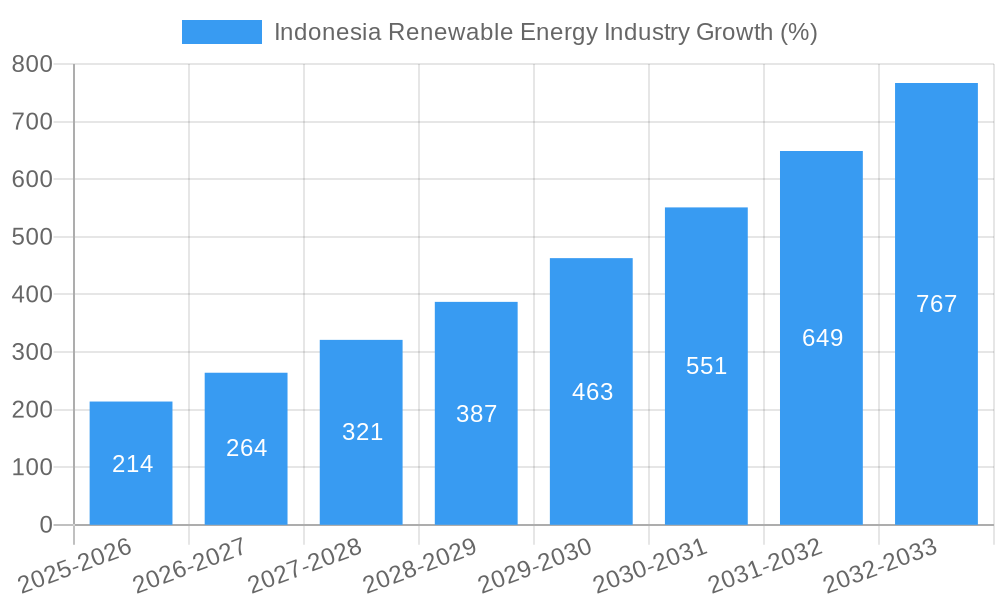
The Indonesian renewable energy market is experiencing robust growth, projected to expand significantly over the forecast period (2025-2033). A Compound Annual Growth Rate (CAGR) of 21.44% indicates substantial investor interest and government support for transitioning away from fossil fuels. This surge is driven by several factors, including Indonesia's commitment to reducing carbon emissions, increasing energy demand from a growing population and economy, and the declining cost of renewable energy technologies such as solar and wind power. The government's policy initiatives aimed at promoting renewable energy adoption, such as feed-in tariffs and renewable portfolio standards, further fuel market expansion. Furthermore, the abundance of solar and geothermal resources in the archipelago provides a strong foundation for large-scale renewable energy projects. Key players like PT ATW Solar Indonesia, Sindicatum Renewable Energy, and Canadian Solar are actively shaping the market landscape through project development, investment, and technological innovation. However, challenges remain, including the need for improved grid infrastructure to effectively integrate renewable energy sources and the need for continued investment in research and development to further enhance the efficiency and affordability of renewable energy technologies.
The segmentation of the Indonesian renewable energy market reflects the diverse sources available. Solar, wind, and hydro power are likely to dominate, given their established presence and readily available resources. However, the "Other Sources" segment, which could encompass geothermal, biomass, and potentially emerging technologies like wave energy, also holds considerable growth potential. The regional distribution of renewable energy projects will largely depend on resource availability and governmental incentives, with certain regions potentially experiencing faster growth than others. Ongoing efforts to diversify the renewable energy mix, coupled with consistent governmental support and private investment, will be pivotal in sustaining the projected CAGR and achieving the nation's renewable energy targets. Competitive pricing and technological advancements will also play a crucial role in accelerating the transition to a cleaner, more sustainable energy future for Indonesia.
Indonesia Renewable Energy Industry: A Comprehensive Market Report (2019-2033)
This in-depth report provides a comprehensive analysis of the Indonesian renewable energy market, encompassing market dynamics, growth trends, key players, and future outlook. The study period covers 2019-2033, with 2025 as the base and estimated year. This report is essential for investors, industry professionals, and policymakers seeking to understand and capitalize on opportunities within this rapidly evolving sector. The report covers parent markets (renewable energy) and child markets (solar, wind, hydro, bioenergy).
Indonesia Renewable Energy Industry Market Dynamics & Structure
This section analyzes the Indonesian renewable energy market's structure, encompassing market concentration, technological innovation, regulatory frameworks, competitive dynamics, end-user demographics, and mergers & acquisitions (M&A) trends. The Indonesian renewable energy market is characterized by a diverse range of players, from large multinational corporations to smaller, local developers. Market concentration is moderate, with several key players holding significant market share.
- Market Concentration: xx% held by top 5 players (2024).
- Technological Innovation: Strong focus on solar PV and wind power technologies, with increasing interest in bioenergy solutions. Barriers include limited access to capital and skilled labor.
- Regulatory Framework: The Indonesian government supports renewable energy through various policies and incentives, including feed-in tariffs and tax breaks. However, regulatory complexities and bureaucratic hurdles remain a challenge.
- Competitive Substitutes: Fossil fuels remain the dominant energy source in Indonesia, presenting a significant competitive challenge to renewable energy. However, increasing environmental concerns and rising fossil fuel prices are shifting the landscape.
- End-User Demographics: A mix of utility-scale projects, commercial and industrial applications, and residential installations drive demand.
- M&A Trends: A moderate level of M&A activity in recent years, driven by consolidation and expansion efforts among key players. Estimated deal volume in 2024: xx Million USD.
Indonesia Renewable Energy Industry Growth Trends & Insights
This section analyzes the evolution of the Indonesian renewable energy market, providing insights into market size, adoption rates, technological disruptions, and consumer behavior shifts. The market has experienced substantial growth in recent years, driven by government support, falling technology costs, and increasing environmental awareness.
The market size (in Million USD) is estimated at xx in 2025, exhibiting a Compound Annual Growth Rate (CAGR) of xx% during the forecast period (2025-2033). Market penetration for renewable energy is projected to reach xx% by 2033. Technological advancements, especially in solar PV and wind energy technologies, are driving cost reductions and improved efficiency. Shifting consumer preferences towards sustainable energy are also contributing to market expansion.
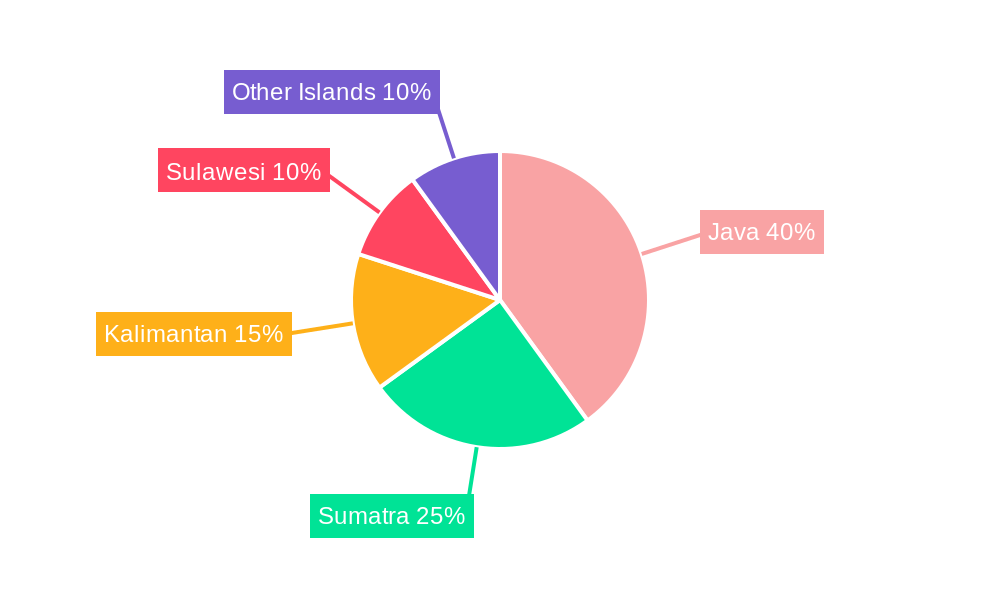
Dominant Regions, Countries, or Segments in Indonesia Renewable Energy Industry
Java Island is currently the dominant region for renewable energy development in Indonesia. This is due to factors like higher population density, advanced infrastructure, and government focus on supporting renewable energy initiatives within the region. However, other regions are seeing increasing investment.
- Solar: Dominates the Indonesian renewable energy market due to abundant sunlight and falling costs of solar PV technology. Market share in 2024: xx%. Growth is fueled by government incentives and large-scale solar projects.
- Wind: Significant potential, particularly in eastern Indonesia, but faces challenges related to grid infrastructure and wind resource variability. Market share in 2024: xx%.
- Hydro: Established source of renewable energy but further development is limited by environmental concerns and suitable site availability. Market share in 2024: xx%.
- Bioenergy: Growing sector fueled by the government's focus on reducing carbon emissions and promoting sustainable agriculture. Market share in 2024: xx%.
- Other Sources: Includes geothermal and biomass, with promising potential but limited development due to high initial investment costs. Market share in 2024: xx%.
Indonesia Renewable Energy Industry Product Landscape
The Indonesian renewable energy market offers a diverse range of products, encompassing various solar PV technologies (monocrystalline, polycrystalline, thin-film), wind turbines (onshore and offshore), hydropower systems, and bioenergy technologies. Technological advancements are focused on improving efficiency, reducing costs, and enhancing reliability. Innovative financing models, such as power purchase agreements (PPAs), are also gaining traction.
Key Drivers, Barriers & Challenges in Indonesia Renewable Energy Industry
Key Drivers:
- Increasing government support through policies and incentives.
- Falling technology costs, making renewable energy more competitive with fossil fuels.
- Growing awareness of climate change and the need for sustainable energy.
Challenges:
- Grid infrastructure limitations, particularly in remote areas.
- Regulatory uncertainties and bureaucratic delays.
- High upfront investment costs.
- Competition from established fossil fuel industries. Estimated annual loss due to regulatory hurdles: xx Million USD (2024).
Emerging Opportunities in Indonesia Renewable Energy Industry
- Untapped potential in rural electrification using decentralized renewable energy systems.
- Growing demand for energy storage solutions to address intermittency of renewable energy sources.
- Opportunities in the development of green hydrogen production using renewable energy.
Growth Accelerators in the Indonesia Renewable Energy Industry Industry
Long-term growth will be driven by continued government support, technological advancements (particularly in battery storage), and increasing private sector investment. Strategic partnerships between local and international players will also play a crucial role in accelerating market development. Furthermore, the integration of renewable energy into the existing grid infrastructure is paramount for sustained growth.
Key Players Shaping the Indonesia Renewable Energy Industry Market
- PT ATW Solar Indonesia
- Sindicatum Renewable Energy Company Pte Ltd
- Fourth Partner Energy Private Limited
- SEG Solar
- BCPG Public Company Limited (BCPG)
- TotalEnergies ENEOS
- Canadian Solar Inc
- Trina Solar Ltd
- PT Sumber Energi Sukses Makmur
- Xurya Daya Indonesia
Notable Milestones in Indonesia Renewable Energy Industry Sector
- June 2023: SEG Solar's USD 500 million investment in a 5GW solar cell and 3GW solar module manufacturing facility in Central Java, signifying a major boost to local manufacturing capacity.
- December 2022: PT Bukit Asam Tbk's pilot biomass project, highlighting the government's commitment to diversifying energy sources and reducing carbon emissions.
In-Depth Indonesia Renewable Energy Industry Market Outlook
The Indonesian renewable energy market is poised for significant growth over the next decade. Continued government support, falling technology costs, and increasing private sector investment will drive market expansion. Strategic partnerships, technological breakthroughs in energy storage, and the development of a robust grid infrastructure will play a critical role in unlocking the market's full potential. The market is expected to attract significant foreign investment, further boosting its growth trajectory.
Indonesia Renewable Energy Industry Segmentation
-
1. Source
- 1.1. Solar
- 1.2. Wind
- 1.3. Hydro
- 1.4. Bioenergy
- 1.5. Other Sources
Indonesia Renewable Energy Industry Segmentation By Geography
- 1. Indonesia
Indonesia Renewable Energy Industry REPORT HIGHLIGHTS
| Aspects | Details |
|---|---|
| Study Period | 2019-2033 |
| Base Year | 2024 |
| Estimated Year | 2025 |
| Forecast Period | 2025-2033 |
| Historical Period | 2019-2024 |
| Growth Rate | CAGR of 21.44% from 2019-2033 |
| Segmentation |
|
Table of Contents
- 1. Introduction
- 1.1. Research Scope
- 1.2. Market Segmentation
- 1.3. Research Methodology
- 1.4. Definitions and Assumptions
- 2. Executive Summary
- 2.1. Introduction
- 3. Market Dynamics
- 3.1. Introduction
- 3.2. Market Drivers
- 3.2.1. 4.; Immense Potential in Renewable sector due to Natural Landscape of the country4.; Supportive Government Policies and Initiatives
- 3.3. Market Restrains
- 3.3.1. 4.; Rising Adoption of Alternate Clean Power Sources
- 3.4. Market Trends
- 3.4.1. Solar Energy Is Expected to Witness Significant Growth
- 4. Market Factor Analysis
- 4.1. Porters Five Forces
- 4.2. Supply/Value Chain
- 4.3. PESTEL analysis
- 4.4. Market Entropy
- 4.5. Patent/Trademark Analysis
- 5. Indonesia Renewable Energy Industry Analysis, Insights and Forecast, 2019-2031
- 5.1. Market Analysis, Insights and Forecast - by Source
- 5.1.1. Solar
- 5.1.2. Wind
- 5.1.3. Hydro
- 5.1.4. Bioenergy
- 5.1.5. Other Sources
- 5.2. Market Analysis, Insights and Forecast - by Region
- 5.2.1. Indonesia
- 5.1. Market Analysis, Insights and Forecast - by Source
- 6. Competitive Analysis
- 6.1. Market Share Analysis 2024
- 6.2. Company Profiles
- 6.2.1 PT ATW Solar Indonesia
- 6.2.1.1. Overview
- 6.2.1.2. Products
- 6.2.1.3. SWOT Analysis
- 6.2.1.4. Recent Developments
- 6.2.1.5. Financials (Based on Availability)
- 6.2.2 Sindicatum Renewable Energy Company Pte Ltd
- 6.2.2.1. Overview
- 6.2.2.2. Products
- 6.2.2.3. SWOT Analysis
- 6.2.2.4. Recent Developments
- 6.2.2.5. Financials (Based on Availability)
- 6.2.3 Fourth Partner Energy Private Limited
- 6.2.3.1. Overview
- 6.2.3.2. Products
- 6.2.3.3. SWOT Analysis
- 6.2.3.4. Recent Developments
- 6.2.3.5. Financials (Based on Availability)
- 6.2.4 SEG Solar
- 6.2.4.1. Overview
- 6.2.4.2. Products
- 6.2.4.3. SWOT Analysis
- 6.2.4.4. Recent Developments
- 6.2.4.5. Financials (Based on Availability)
- 6.2.5 BCPG Public Company Limited (BCPG)
- 6.2.5.1. Overview
- 6.2.5.2. Products
- 6.2.5.3. SWOT Analysis
- 6.2.5.4. Recent Developments
- 6.2.5.5. Financials (Based on Availability)
- 6.2.6 TotalEnergies ENEOS*List Not Exhaustive
- 6.2.6.1. Overview
- 6.2.6.2. Products
- 6.2.6.3. SWOT Analysis
- 6.2.6.4. Recent Developments
- 6.2.6.5. Financials (Based on Availability)
- 6.2.7 Canadian Solar Inc
- 6.2.7.1. Overview
- 6.2.7.2. Products
- 6.2.7.3. SWOT Analysis
- 6.2.7.4. Recent Developments
- 6.2.7.5. Financials (Based on Availability)
- 6.2.8 Trina Solar Ltd
- 6.2.8.1. Overview
- 6.2.8.2. Products
- 6.2.8.3. SWOT Analysis
- 6.2.8.4. Recent Developments
- 6.2.8.5. Financials (Based on Availability)
- 6.2.9 PT Sumber Energi Sukses Makmur
- 6.2.9.1. Overview
- 6.2.9.2. Products
- 6.2.9.3. SWOT Analysis
- 6.2.9.4. Recent Developments
- 6.2.9.5. Financials (Based on Availability)
- 6.2.10 Xurya Daya Indonesia
- 6.2.10.1. Overview
- 6.2.10.2. Products
- 6.2.10.3. SWOT Analysis
- 6.2.10.4. Recent Developments
- 6.2.10.5. Financials (Based on Availability)
- 6.2.1 PT ATW Solar Indonesia
List of Figures
- Figure 1: Indonesia Renewable Energy Industry Revenue Breakdown (Million, %) by Product 2024 & 2032
- Figure 2: Indonesia Renewable Energy Industry Share (%) by Company 2024
List of Tables
- Table 1: Indonesia Renewable Energy Industry Revenue Million Forecast, by Region 2019 & 2032
- Table 2: Indonesia Renewable Energy Industry Volume gigawatt Forecast, by Region 2019 & 2032
- Table 3: Indonesia Renewable Energy Industry Revenue Million Forecast, by Source 2019 & 2032
- Table 4: Indonesia Renewable Energy Industry Volume gigawatt Forecast, by Source 2019 & 2032
- Table 5: Indonesia Renewable Energy Industry Revenue Million Forecast, by Region 2019 & 2032
- Table 6: Indonesia Renewable Energy Industry Volume gigawatt Forecast, by Region 2019 & 2032
- Table 7: Indonesia Renewable Energy Industry Revenue Million Forecast, by Country 2019 & 2032
- Table 8: Indonesia Renewable Energy Industry Volume gigawatt Forecast, by Country 2019 & 2032
- Table 9: Indonesia Renewable Energy Industry Revenue Million Forecast, by Source 2019 & 2032
- Table 10: Indonesia Renewable Energy Industry Volume gigawatt Forecast, by Source 2019 & 2032
- Table 11: Indonesia Renewable Energy Industry Revenue Million Forecast, by Country 2019 & 2032
- Table 12: Indonesia Renewable Energy Industry Volume gigawatt Forecast, by Country 2019 & 2032
Frequently Asked Questions
1. What is the projected Compound Annual Growth Rate (CAGR) of the Indonesia Renewable Energy Industry?
The projected CAGR is approximately 21.44%.
2. Which companies are prominent players in the Indonesia Renewable Energy Industry?
Key companies in the market include PT ATW Solar Indonesia, Sindicatum Renewable Energy Company Pte Ltd, Fourth Partner Energy Private Limited, SEG Solar, BCPG Public Company Limited (BCPG), TotalEnergies ENEOS*List Not Exhaustive, Canadian Solar Inc, Trina Solar Ltd, PT Sumber Energi Sukses Makmur, Xurya Daya Indonesia.
3. What are the main segments of the Indonesia Renewable Energy Industry?
The market segments include Source.
4. Can you provide details about the market size?
The market size is estimated to be USD XX Million as of 2022.
5. What are some drivers contributing to market growth?
4.; Immense Potential in Renewable sector due to Natural Landscape of the country4.; Supportive Government Policies and Initiatives.
6. What are the notable trends driving market growth?
Solar Energy Is Expected to Witness Significant Growth.
7. Are there any restraints impacting market growth?
4.; Rising Adoption of Alternate Clean Power Sources.
8. Can you provide examples of recent developments in the market?
June 2023: SEG Solar (SEG) and PT Kawasan Industri Terpadu Batang (KITB) have announced they have entered into a binding agreement for the lease of approximately 41 hectares of land located in the Batang Regency, Central Java, Indonesia. Through PT SEG ATW Solar Manufaktur Indonesia, a joint-venture project company, SEG intends to invest USD 500 million in developing the land to construct a 5GW solar cell manufacturing facility and a 3GW solar module manufacturing facility. To assist with developing local facilities in Indonesia, SEG has partnered with PT ATW Investasi Selaras (ATW Group).
9. What pricing options are available for accessing the report?
Pricing options include single-user, multi-user, and enterprise licenses priced at USD 3800, USD 4500, and USD 5800 respectively.
10. Is the market size provided in terms of value or volume?
The market size is provided in terms of value, measured in Million and volume, measured in gigawatt.
11. Are there any specific market keywords associated with the report?
Yes, the market keyword associated with the report is "Indonesia Renewable Energy Industry," which aids in identifying and referencing the specific market segment covered.
12. How do I determine which pricing option suits my needs best?
The pricing options vary based on user requirements and access needs. Individual users may opt for single-user licenses, while businesses requiring broader access may choose multi-user or enterprise licenses for cost-effective access to the report.
13. Are there any additional resources or data provided in the Indonesia Renewable Energy Industry report?
While the report offers comprehensive insights, it's advisable to review the specific contents or supplementary materials provided to ascertain if additional resources or data are available.
14. How can I stay updated on further developments or reports in the Indonesia Renewable Energy Industry?
To stay informed about further developments, trends, and reports in the Indonesia Renewable Energy Industry, consider subscribing to industry newsletters, following relevant companies and organizations, or regularly checking reputable industry news sources and publications.
Methodology
Step 1 - Identification of Relevant Samples Size from Population Database


Step 2 - Approaches for Defining Global Market Size (Value, Volume* & Price*)

Note*: In applicable scenarios
Step 3 - Data Sources
Primary Research
- Web Analytics
- Survey Reports
- Research Institute
- Latest Research Reports
- Opinion Leaders
Secondary Research
- Annual Reports
- White Paper
- Latest Press Release
- Industry Association
- Paid Database
- Investor Presentations

Step 4 - Data Triangulation
Involves using different sources of information in order to increase the validity of a study
These sources are likely to be stakeholders in a program - participants, other researchers, program staff, other community members, and so on.
Then we put all data in single framework & apply various statistical tools to find out the dynamic on the market.
During the analysis stage, feedback from the stakeholder groups would be compared to determine areas of agreement as well as areas of divergence


