
Key Insights
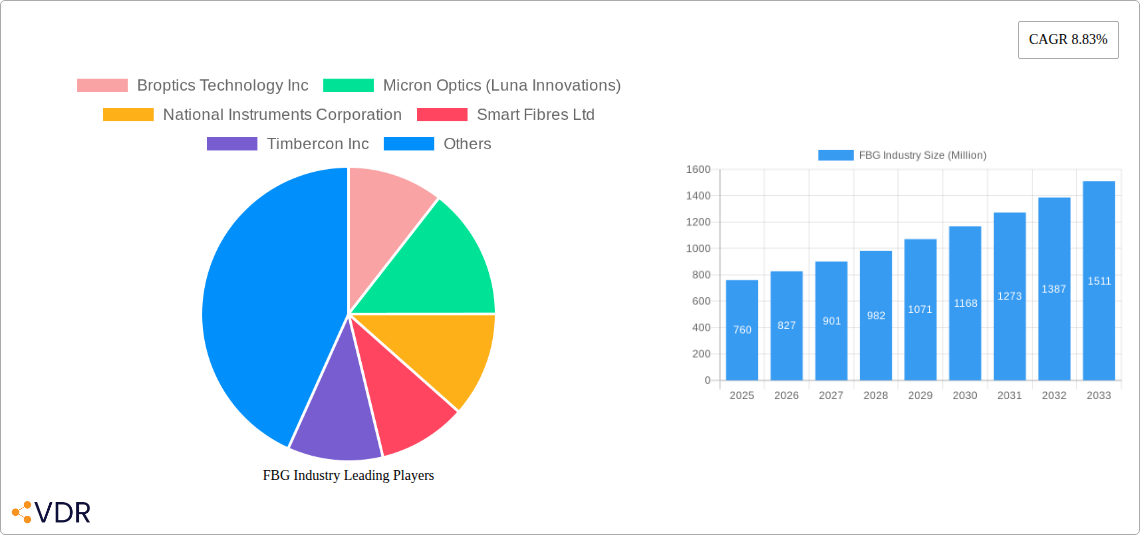
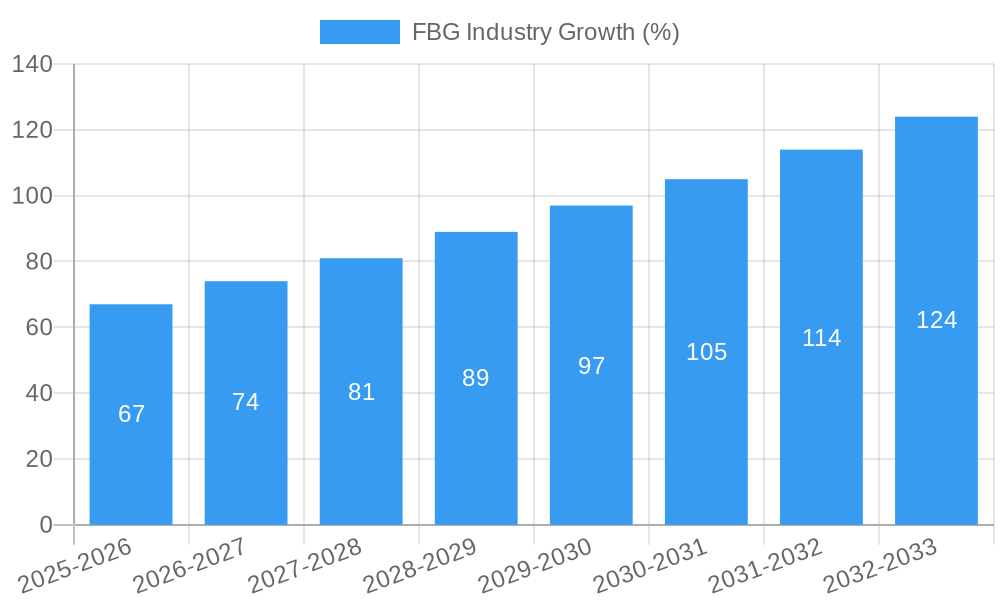
The Fiber Bragg Grating (FBG) sensor market, valued at $0.76 billion in 2025, is projected to experience robust growth, driven by increasing demand across diverse sectors. A compound annual growth rate (CAGR) of 8.83% from 2025 to 2033 indicates significant expansion, fueled by several key factors. The rising adoption of FBG sensors in telecommunications for network monitoring and maintenance is a primary driver, alongside the growth of the aerospace industry, demanding advanced sensing solutions for structural health monitoring and improved safety. Furthermore, the construction and infrastructure sector's increasing reliance on smart sensors for improved efficiency and structural integrity contributes significantly to market growth. The energy and power sector also leverages FBG technology for real-time monitoring of critical infrastructure, enhancing operational efficiency and safety. Technological advancements, such as miniaturization and improved sensor sensitivity, are further propelling market expansion. Different sensor types, including temperature, strain, and pressure sensors, cater to diverse application needs, with temperature sensors currently holding a significant market share.
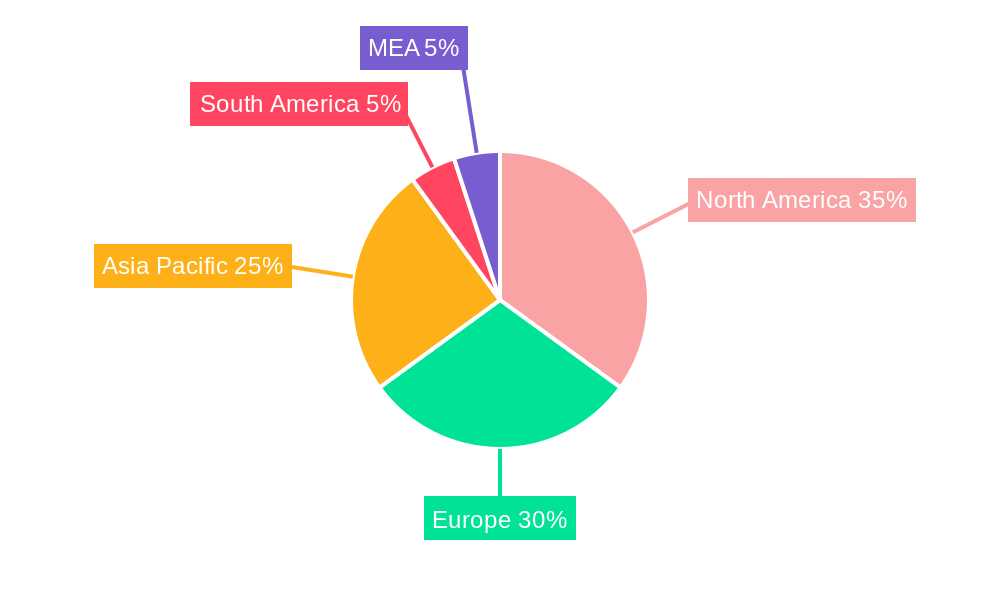
However, certain challenges might restrain market growth. High initial investment costs associated with FBG sensor installation and maintenance could act as a barrier for some smaller companies. Furthermore, the need for specialized expertise in installation and data interpretation might limit widespread adoption. Despite these constraints, the long-term benefits of enhanced accuracy, reliability, and real-time monitoring capabilities provided by FBG sensors outweigh these challenges. The market is expected to see continued growth in the Asia-Pacific region, driven by expanding infrastructure projects and increasing industrialization in countries like China and India. North America and Europe will also contribute significantly to market growth, backed by robust technological advancements and established infrastructure. The competitive landscape is characterized by both established players and emerging companies, each focusing on innovation and technological improvements to gain a competitive edge. This dynamic environment ensures continued market dynamism and growth in the coming years.
FBG Industry Market Report: 2019-2033
This comprehensive report provides an in-depth analysis of the Fiber Bragg Grating (FBG) industry, covering market dynamics, growth trends, key players, and future outlook. The study period spans 2019-2033, with 2025 as the base and estimated year. This report is invaluable for industry professionals, investors, and researchers seeking a complete understanding of this rapidly evolving sector. The report segments the market by type (Temperature Sensor, Strain Sensor, Pressure Sensor, Other Types) and end-user industry (Telecommunication, Aerospace, Construction & Infrastructure, Energy & Power, Mining, Other End-user Industries), offering granular insights into market size and growth potential within each segment. Market values are presented in million units.
FBG Industry Market Dynamics & Structure
The FBG industry is characterized by a moderately concentrated market structure, with several key players dominating specific segments. Technological innovation, particularly in sensor sensitivity and miniaturization, is a primary growth driver. Regulatory frameworks, such as those related to safety and environmental standards in various end-user industries, significantly influence market dynamics. Competitive substitutes, such as other optical sensing technologies, pose a challenge, while M&A activity shapes the competitive landscape.
- Market Concentration: The top 10 companies hold an estimated xx% market share in 2025.
- Technological Innovation: Ongoing R&D in improving sensor accuracy, durability, and cost-effectiveness drives growth. Barriers to innovation include high R&D costs and the need for specialized expertise.
- Regulatory Landscape: Stringent safety and environmental regulations in industries like aerospace and energy influence FBG sensor adoption.
- Competitive Substitutes: Technologies like fiber optic interferometry and other sensing methods compete with FBG sensors, but FBG's inherent advantages in certain applications remain strong.
- M&A Trends: The past five years have seen xx M&A deals, primarily focused on consolidating market share and acquiring specialized technologies. This trend is projected to continue.
- End-User Demographics: The demand for FBG sensors is heavily influenced by the growth of industries like telecommunications, aerospace, and renewable energy.
FBG Industry Growth Trends & Insights
The global FBG industry experienced significant growth during the historical period (2019-2024), with a CAGR of xx%. This growth is attributed to increasing demand from various end-user industries, driven by infrastructure development, technological advancements, and favorable government policies. Market penetration is currently estimated at xx% in key segments, with significant room for expansion. Technological disruptions, such as the development of more robust and cost-effective FBG sensors, are further fueling market growth. Consumer behavior shifts towards greater adoption of smart infrastructure and automation are supporting the growth trajectory. The forecast period (2025-2033) projects a CAGR of xx%, driven by continued innovation and expanding applications across diverse sectors.
Dominant Regions, Countries, or Segments in FBG Industry
North America and Europe currently dominate the FBG market, driven by robust technological advancements, strong research and development activities, and established industrial infrastructure. Within the segmentation:
By Type: The Temperature Sensor segment holds the largest market share (xx%), followed by Strain Sensor (xx%) and Pressure Sensor (xx%). This is due to their widespread use in various applications. Other types account for xx%.
By End-user Industry: The Telecommunication sector is the leading end-user segment (xx%), driven by the need for high-performance monitoring systems in fiber optic networks. Aerospace (xx%) and Construction & Infrastructure (xx%) segments exhibit strong growth potential, particularly due to increased investments in smart infrastructure projects and the demand for advanced structural health monitoring. Energy & Power (xx%) and Mining (xx%) show steady growth due to the implementation of advanced monitoring systems for safety and efficiency.
Key Drivers: Government support for infrastructure development, increasing investments in renewable energy, and stringent safety standards are major drivers of regional and segment growth.
FBG Industry Product Landscape
FBG sensors are experiencing continuous improvement in performance parameters, particularly in terms of sensitivity, temperature range, and durability. Recent innovations focus on miniaturization and integration with other sensing technologies, enabling more compact and versatile sensor systems. The key selling proposition is the inherent ability of FBG sensors to provide precise and reliable measurements under harsh environmental conditions. Technological advancements include improved fabrication techniques and the development of advanced interrogation systems.
Key Drivers, Barriers & Challenges in FBG Industry
Key Drivers:
- Increasing demand for structural health monitoring in infrastructure and aerospace.
- Growth of renewable energy sectors necessitating advanced monitoring solutions.
- Advancements in sensor technology and manufacturing processes.
Key Barriers & Challenges:
- High initial investment costs for installation and infrastructure.
- Competitive pressures from alternative sensing technologies.
- Supply chain disruptions impacting the availability of critical components.
Emerging Opportunities in FBG Industry
- Expansion into emerging markets with growing infrastructure development.
- Integration of FBG sensors with IoT platforms for enhanced data analysis.
- Development of specialized sensors for niche applications (e.g., medical devices, environmental monitoring).
Growth Accelerators in the FBG Industry Industry
Technological breakthroughs, particularly in the development of highly sensitive and cost-effective sensors, are crucial growth catalysts. Strategic partnerships between sensor manufacturers and system integrators are expanding market reach. Aggressive market expansion strategies into emerging economies, focused on infrastructure development projects, are also driving the sector's growth.
Key Players Shaping the FBG Industry Market
- Broptics Technology Inc
- Micron Optics (Luna Innovations)
- National Instruments Corporation
- Smart Fibres Ltd
- Timbercon Inc
- ITF Technologies
- HBM Inc (An HBK Company)
- FBGS International NV
- Technica Optical Components LLC
- Advanced Optics Solutions (AOS) GmbH
Notable Milestones in FBG Industry Sector
- October 2022: The French government's Energy Efficiency Plan boosts demand for FBG sensors for energy monitoring and efficiency improvements.
- March 2022: The ANGELA Consortium's use of FBG sensors in a flight-ready landing gear system showcases the technology's capabilities in demanding applications.
In-Depth FBG Industry Market Outlook
The FBG industry is poised for continued robust growth over the forecast period, driven by increasing demand across diverse sectors. Strategic opportunities exist in expanding into untapped markets, focusing on innovation, and developing specialized sensors for emerging applications. The future looks bright for this technology as it plays a critical role in various sectors, and companies that adapt to the changing needs of the market will lead the way in shaping this technology's trajectory.
FBG Industry Segmentation
-
1. Type
- 1.1. Temperature Sensor
- 1.2. Strain Sensor
- 1.3. Pressure Sensor
- 1.4. Other Types
-
2. End-user Industry
- 2.1. Telecommunication
- 2.2. Aerospace
- 2.3. Construction and Infrastructure
- 2.4. Energy and Power
- 2.5. Mining
- 2.6. Other End-user Industries
FBG Industry Segmentation By Geography
- 1. North America
- 2. Europe
- 3. Asia Pacific
- 4. Rest of the World
FBG Industry REPORT HIGHLIGHTS
| Aspects | Details |
|---|---|
| Study Period | 2019-2033 |
| Base Year | 2024 |
| Estimated Year | 2025 |
| Forecast Period | 2025-2033 |
| Historical Period | 2019-2024 |
| Growth Rate | CAGR of 8.83% from 2019-2033 |
| Segmentation |
|
Table of Contents
- 1. Introduction
- 1.1. Research Scope
- 1.2. Market Segmentation
- 1.3. Research Methodology
- 1.4. Definitions and Assumptions
- 2. Executive Summary
- 2.1. Introduction
- 3. Market Dynamics
- 3.1. Introduction
- 3.2. Market Drivers
- 3.2.1. Increasing Usage in the Aircraft; Built-in Calibration Artifacts and Longer Lifetime
- 3.3. Market Restrains
- 3.3.1. Thermal and Transverse Strain Sensitivity
- 3.4. Market Trends
- 3.4.1. Aerospace to be Among the Fastest Growing End User for FBG Sensors
- 4. Market Factor Analysis
- 4.1. Porters Five Forces
- 4.2. Supply/Value Chain
- 4.3. PESTEL analysis
- 4.4. Market Entropy
- 4.5. Patent/Trademark Analysis
- 5. Global FBG Industry Analysis, Insights and Forecast, 2019-2031
- 5.1. Market Analysis, Insights and Forecast - by Type
- 5.1.1. Temperature Sensor
- 5.1.2. Strain Sensor
- 5.1.3. Pressure Sensor
- 5.1.4. Other Types
- 5.2. Market Analysis, Insights and Forecast - by End-user Industry
- 5.2.1. Telecommunication
- 5.2.2. Aerospace
- 5.2.3. Construction and Infrastructure
- 5.2.4. Energy and Power
- 5.2.5. Mining
- 5.2.6. Other End-user Industries
- 5.3. Market Analysis, Insights and Forecast - by Region
- 5.3.1. North America
- 5.3.2. Europe
- 5.3.3. Asia Pacific
- 5.3.4. Rest of the World
- 5.1. Market Analysis, Insights and Forecast - by Type
- 6. North America FBG Industry Analysis, Insights and Forecast, 2019-2031
- 6.1. Market Analysis, Insights and Forecast - by Type
- 6.1.1. Temperature Sensor
- 6.1.2. Strain Sensor
- 6.1.3. Pressure Sensor
- 6.1.4. Other Types
- 6.2. Market Analysis, Insights and Forecast - by End-user Industry
- 6.2.1. Telecommunication
- 6.2.2. Aerospace
- 6.2.3. Construction and Infrastructure
- 6.2.4. Energy and Power
- 6.2.5. Mining
- 6.2.6. Other End-user Industries
- 6.1. Market Analysis, Insights and Forecast - by Type
- 7. Europe FBG Industry Analysis, Insights and Forecast, 2019-2031
- 7.1. Market Analysis, Insights and Forecast - by Type
- 7.1.1. Temperature Sensor
- 7.1.2. Strain Sensor
- 7.1.3. Pressure Sensor
- 7.1.4. Other Types
- 7.2. Market Analysis, Insights and Forecast - by End-user Industry
- 7.2.1. Telecommunication
- 7.2.2. Aerospace
- 7.2.3. Construction and Infrastructure
- 7.2.4. Energy and Power
- 7.2.5. Mining
- 7.2.6. Other End-user Industries
- 7.1. Market Analysis, Insights and Forecast - by Type
- 8. Asia Pacific FBG Industry Analysis, Insights and Forecast, 2019-2031
- 8.1. Market Analysis, Insights and Forecast - by Type
- 8.1.1. Temperature Sensor
- 8.1.2. Strain Sensor
- 8.1.3. Pressure Sensor
- 8.1.4. Other Types
- 8.2. Market Analysis, Insights and Forecast - by End-user Industry
- 8.2.1. Telecommunication
- 8.2.2. Aerospace
- 8.2.3. Construction and Infrastructure
- 8.2.4. Energy and Power
- 8.2.5. Mining
- 8.2.6. Other End-user Industries
- 8.1. Market Analysis, Insights and Forecast - by Type
- 9. Rest of the World FBG Industry Analysis, Insights and Forecast, 2019-2031
- 9.1. Market Analysis, Insights and Forecast - by Type
- 9.1.1. Temperature Sensor
- 9.1.2. Strain Sensor
- 9.1.3. Pressure Sensor
- 9.1.4. Other Types
- 9.2. Market Analysis, Insights and Forecast - by End-user Industry
- 9.2.1. Telecommunication
- 9.2.2. Aerospace
- 9.2.3. Construction and Infrastructure
- 9.2.4. Energy and Power
- 9.2.5. Mining
- 9.2.6. Other End-user Industries
- 9.1. Market Analysis, Insights and Forecast - by Type
- 10. North America FBG Industry Analysis, Insights and Forecast, 2019-2031
- 10.1. Market Analysis, Insights and Forecast - By Country/Sub-region
- 10.1.1 United States
- 10.1.2 Canada
- 10.1.3 Mexico
- 11. Europe FBG Industry Analysis, Insights and Forecast, 2019-2031
- 11.1. Market Analysis, Insights and Forecast - By Country/Sub-region
- 11.1.1 Germany
- 11.1.2 United Kingdom
- 11.1.3 France
- 11.1.4 Spain
- 11.1.5 Italy
- 11.1.6 Spain
- 11.1.7 Belgium
- 11.1.8 Netherland
- 11.1.9 Nordics
- 11.1.10 Rest of Europe
- 12. Asia Pacific FBG Industry Analysis, Insights and Forecast, 2019-2031
- 12.1. Market Analysis, Insights and Forecast - By Country/Sub-region
- 12.1.1 China
- 12.1.2 Japan
- 12.1.3 India
- 12.1.4 South Korea
- 12.1.5 Southeast Asia
- 12.1.6 Australia
- 12.1.7 Indonesia
- 12.1.8 Phillipes
- 12.1.9 Singapore
- 12.1.10 Thailandc
- 12.1.11 Rest of Asia Pacific
- 13. South America FBG Industry Analysis, Insights and Forecast, 2019-2031
- 13.1. Market Analysis, Insights and Forecast - By Country/Sub-region
- 13.1.1 Brazil
- 13.1.2 Argentina
- 13.1.3 Peru
- 13.1.4 Chile
- 13.1.5 Colombia
- 13.1.6 Ecuador
- 13.1.7 Venezuela
- 13.1.8 Rest of South America
- 14. North America FBG Industry Analysis, Insights and Forecast, 2019-2031
- 14.1. Market Analysis, Insights and Forecast - By Country/Sub-region
- 14.1.1 United States
- 14.1.2 Canada
- 14.1.3 Mexico
- 15. MEA FBG Industry Analysis, Insights and Forecast, 2019-2031
- 15.1. Market Analysis, Insights and Forecast - By Country/Sub-region
- 15.1.1 United Arab Emirates
- 15.1.2 Saudi Arabia
- 15.1.3 South Africa
- 15.1.4 Rest of Middle East and Africa
- 16. Competitive Analysis
- 16.1. Global Market Share Analysis 2024
- 16.2. Company Profiles
- 16.2.1 Broptics Technology Inc
- 16.2.1.1. Overview
- 16.2.1.2. Products
- 16.2.1.3. SWOT Analysis
- 16.2.1.4. Recent Developments
- 16.2.1.5. Financials (Based on Availability)
- 16.2.2 Micron Optics (Luna Innovations)
- 16.2.2.1. Overview
- 16.2.2.2. Products
- 16.2.2.3. SWOT Analysis
- 16.2.2.4. Recent Developments
- 16.2.2.5. Financials (Based on Availability)
- 16.2.3 National Instruments Corporation
- 16.2.3.1. Overview
- 16.2.3.2. Products
- 16.2.3.3. SWOT Analysis
- 16.2.3.4. Recent Developments
- 16.2.3.5. Financials (Based on Availability)
- 16.2.4 Smart Fibres Ltd
- 16.2.4.1. Overview
- 16.2.4.2. Products
- 16.2.4.3. SWOT Analysis
- 16.2.4.4. Recent Developments
- 16.2.4.5. Financials (Based on Availability)
- 16.2.5 Timbercon Inc
- 16.2.5.1. Overview
- 16.2.5.2. Products
- 16.2.5.3. SWOT Analysis
- 16.2.5.4. Recent Developments
- 16.2.5.5. Financials (Based on Availability)
- 16.2.6 ITF Technologies
- 16.2.6.1. Overview
- 16.2.6.2. Products
- 16.2.6.3. SWOT Analysis
- 16.2.6.4. Recent Developments
- 16.2.6.5. Financials (Based on Availability)
- 16.2.7 HBM Inc (An HBK Company)
- 16.2.7.1. Overview
- 16.2.7.2. Products
- 16.2.7.3. SWOT Analysis
- 16.2.7.4. Recent Developments
- 16.2.7.5. Financials (Based on Availability)
- 16.2.8 FBGS International NV
- 16.2.8.1. Overview
- 16.2.8.2. Products
- 16.2.8.3. SWOT Analysis
- 16.2.8.4. Recent Developments
- 16.2.8.5. Financials (Based on Availability)
- 16.2.9 Technica Optical Components LLC
- 16.2.9.1. Overview
- 16.2.9.2. Products
- 16.2.9.3. SWOT Analysis
- 16.2.9.4. Recent Developments
- 16.2.9.5. Financials (Based on Availability)
- 16.2.10 Advanced Optics Solutions (AOS) GmbH
- 16.2.10.1. Overview
- 16.2.10.2. Products
- 16.2.10.3. SWOT Analysis
- 16.2.10.4. Recent Developments
- 16.2.10.5. Financials (Based on Availability)
- 16.2.1 Broptics Technology Inc
List of Figures
- Figure 1: Global FBG Industry Revenue Breakdown (Million, %) by Region 2024 & 2032
- Figure 2: North America FBG Industry Revenue (Million), by Country 2024 & 2032
- Figure 3: North America FBG Industry Revenue Share (%), by Country 2024 & 2032
- Figure 4: Europe FBG Industry Revenue (Million), by Country 2024 & 2032
- Figure 5: Europe FBG Industry Revenue Share (%), by Country 2024 & 2032
- Figure 6: Asia Pacific FBG Industry Revenue (Million), by Country 2024 & 2032
- Figure 7: Asia Pacific FBG Industry Revenue Share (%), by Country 2024 & 2032
- Figure 8: South America FBG Industry Revenue (Million), by Country 2024 & 2032
- Figure 9: South America FBG Industry Revenue Share (%), by Country 2024 & 2032
- Figure 10: North America FBG Industry Revenue (Million), by Country 2024 & 2032
- Figure 11: North America FBG Industry Revenue Share (%), by Country 2024 & 2032
- Figure 12: MEA FBG Industry Revenue (Million), by Country 2024 & 2032
- Figure 13: MEA FBG Industry Revenue Share (%), by Country 2024 & 2032
- Figure 14: North America FBG Industry Revenue (Million), by Type 2024 & 2032
- Figure 15: North America FBG Industry Revenue Share (%), by Type 2024 & 2032
- Figure 16: North America FBG Industry Revenue (Million), by End-user Industry 2024 & 2032
- Figure 17: North America FBG Industry Revenue Share (%), by End-user Industry 2024 & 2032
- Figure 18: North America FBG Industry Revenue (Million), by Country 2024 & 2032
- Figure 19: North America FBG Industry Revenue Share (%), by Country 2024 & 2032
- Figure 20: Europe FBG Industry Revenue (Million), by Type 2024 & 2032
- Figure 21: Europe FBG Industry Revenue Share (%), by Type 2024 & 2032
- Figure 22: Europe FBG Industry Revenue (Million), by End-user Industry 2024 & 2032
- Figure 23: Europe FBG Industry Revenue Share (%), by End-user Industry 2024 & 2032
- Figure 24: Europe FBG Industry Revenue (Million), by Country 2024 & 2032
- Figure 25: Europe FBG Industry Revenue Share (%), by Country 2024 & 2032
- Figure 26: Asia Pacific FBG Industry Revenue (Million), by Type 2024 & 2032
- Figure 27: Asia Pacific FBG Industry Revenue Share (%), by Type 2024 & 2032
- Figure 28: Asia Pacific FBG Industry Revenue (Million), by End-user Industry 2024 & 2032
- Figure 29: Asia Pacific FBG Industry Revenue Share (%), by End-user Industry 2024 & 2032
- Figure 30: Asia Pacific FBG Industry Revenue (Million), by Country 2024 & 2032
- Figure 31: Asia Pacific FBG Industry Revenue Share (%), by Country 2024 & 2032
- Figure 32: Rest of the World FBG Industry Revenue (Million), by Type 2024 & 2032
- Figure 33: Rest of the World FBG Industry Revenue Share (%), by Type 2024 & 2032
- Figure 34: Rest of the World FBG Industry Revenue (Million), by End-user Industry 2024 & 2032
- Figure 35: Rest of the World FBG Industry Revenue Share (%), by End-user Industry 2024 & 2032
- Figure 36: Rest of the World FBG Industry Revenue (Million), by Country 2024 & 2032
- Figure 37: Rest of the World FBG Industry Revenue Share (%), by Country 2024 & 2032
List of Tables
- Table 1: Global FBG Industry Revenue Million Forecast, by Region 2019 & 2032
- Table 2: Global FBG Industry Revenue Million Forecast, by Type 2019 & 2032
- Table 3: Global FBG Industry Revenue Million Forecast, by End-user Industry 2019 & 2032
- Table 4: Global FBG Industry Revenue Million Forecast, by Region 2019 & 2032
- Table 5: Global FBG Industry Revenue Million Forecast, by Country 2019 & 2032
- Table 6: United States FBG Industry Revenue (Million) Forecast, by Application 2019 & 2032
- Table 7: Canada FBG Industry Revenue (Million) Forecast, by Application 2019 & 2032
- Table 8: Mexico FBG Industry Revenue (Million) Forecast, by Application 2019 & 2032
- Table 9: Global FBG Industry Revenue Million Forecast, by Country 2019 & 2032
- Table 10: Germany FBG Industry Revenue (Million) Forecast, by Application 2019 & 2032
- Table 11: United Kingdom FBG Industry Revenue (Million) Forecast, by Application 2019 & 2032
- Table 12: France FBG Industry Revenue (Million) Forecast, by Application 2019 & 2032
- Table 13: Spain FBG Industry Revenue (Million) Forecast, by Application 2019 & 2032
- Table 14: Italy FBG Industry Revenue (Million) Forecast, by Application 2019 & 2032
- Table 15: Spain FBG Industry Revenue (Million) Forecast, by Application 2019 & 2032
- Table 16: Belgium FBG Industry Revenue (Million) Forecast, by Application 2019 & 2032
- Table 17: Netherland FBG Industry Revenue (Million) Forecast, by Application 2019 & 2032
- Table 18: Nordics FBG Industry Revenue (Million) Forecast, by Application 2019 & 2032
- Table 19: Rest of Europe FBG Industry Revenue (Million) Forecast, by Application 2019 & 2032
- Table 20: Global FBG Industry Revenue Million Forecast, by Country 2019 & 2032
- Table 21: China FBG Industry Revenue (Million) Forecast, by Application 2019 & 2032
- Table 22: Japan FBG Industry Revenue (Million) Forecast, by Application 2019 & 2032
- Table 23: India FBG Industry Revenue (Million) Forecast, by Application 2019 & 2032
- Table 24: South Korea FBG Industry Revenue (Million) Forecast, by Application 2019 & 2032
- Table 25: Southeast Asia FBG Industry Revenue (Million) Forecast, by Application 2019 & 2032
- Table 26: Australia FBG Industry Revenue (Million) Forecast, by Application 2019 & 2032
- Table 27: Indonesia FBG Industry Revenue (Million) Forecast, by Application 2019 & 2032
- Table 28: Phillipes FBG Industry Revenue (Million) Forecast, by Application 2019 & 2032
- Table 29: Singapore FBG Industry Revenue (Million) Forecast, by Application 2019 & 2032
- Table 30: Thailandc FBG Industry Revenue (Million) Forecast, by Application 2019 & 2032
- Table 31: Rest of Asia Pacific FBG Industry Revenue (Million) Forecast, by Application 2019 & 2032
- Table 32: Global FBG Industry Revenue Million Forecast, by Country 2019 & 2032
- Table 33: Brazil FBG Industry Revenue (Million) Forecast, by Application 2019 & 2032
- Table 34: Argentina FBG Industry Revenue (Million) Forecast, by Application 2019 & 2032
- Table 35: Peru FBG Industry Revenue (Million) Forecast, by Application 2019 & 2032
- Table 36: Chile FBG Industry Revenue (Million) Forecast, by Application 2019 & 2032
- Table 37: Colombia FBG Industry Revenue (Million) Forecast, by Application 2019 & 2032
- Table 38: Ecuador FBG Industry Revenue (Million) Forecast, by Application 2019 & 2032
- Table 39: Venezuela FBG Industry Revenue (Million) Forecast, by Application 2019 & 2032
- Table 40: Rest of South America FBG Industry Revenue (Million) Forecast, by Application 2019 & 2032
- Table 41: Global FBG Industry Revenue Million Forecast, by Country 2019 & 2032
- Table 42: United States FBG Industry Revenue (Million) Forecast, by Application 2019 & 2032
- Table 43: Canada FBG Industry Revenue (Million) Forecast, by Application 2019 & 2032
- Table 44: Mexico FBG Industry Revenue (Million) Forecast, by Application 2019 & 2032
- Table 45: Global FBG Industry Revenue Million Forecast, by Country 2019 & 2032
- Table 46: United Arab Emirates FBG Industry Revenue (Million) Forecast, by Application 2019 & 2032
- Table 47: Saudi Arabia FBG Industry Revenue (Million) Forecast, by Application 2019 & 2032
- Table 48: South Africa FBG Industry Revenue (Million) Forecast, by Application 2019 & 2032
- Table 49: Rest of Middle East and Africa FBG Industry Revenue (Million) Forecast, by Application 2019 & 2032
- Table 50: Global FBG Industry Revenue Million Forecast, by Type 2019 & 2032
- Table 51: Global FBG Industry Revenue Million Forecast, by End-user Industry 2019 & 2032
- Table 52: Global FBG Industry Revenue Million Forecast, by Country 2019 & 2032
- Table 53: Global FBG Industry Revenue Million Forecast, by Type 2019 & 2032
- Table 54: Global FBG Industry Revenue Million Forecast, by End-user Industry 2019 & 2032
- Table 55: Global FBG Industry Revenue Million Forecast, by Country 2019 & 2032
- Table 56: Global FBG Industry Revenue Million Forecast, by Type 2019 & 2032
- Table 57: Global FBG Industry Revenue Million Forecast, by End-user Industry 2019 & 2032
- Table 58: Global FBG Industry Revenue Million Forecast, by Country 2019 & 2032
- Table 59: Global FBG Industry Revenue Million Forecast, by Type 2019 & 2032
- Table 60: Global FBG Industry Revenue Million Forecast, by End-user Industry 2019 & 2032
- Table 61: Global FBG Industry Revenue Million Forecast, by Country 2019 & 2032
Frequently Asked Questions
1. What is the projected Compound Annual Growth Rate (CAGR) of the FBG Industry?
The projected CAGR is approximately 8.83%.
2. Which companies are prominent players in the FBG Industry?
Key companies in the market include Broptics Technology Inc, Micron Optics (Luna Innovations), National Instruments Corporation, Smart Fibres Ltd, Timbercon Inc, ITF Technologies, HBM Inc (An HBK Company), FBGS International NV, Technica Optical Components LLC, Advanced Optics Solutions (AOS) GmbH.
3. What are the main segments of the FBG Industry?
The market segments include Type, End-user Industry.
4. Can you provide details about the market size?
The market size is estimated to be USD 0.76 Million as of 2022.
5. What are some drivers contributing to market growth?
Increasing Usage in the Aircraft; Built-in Calibration Artifacts and Longer Lifetime.
6. What are the notable trends driving market growth?
Aerospace to be Among the Fastest Growing End User for FBG Sensors.
7. Are there any restraints impacting market growth?
Thermal and Transverse Strain Sensitivity.
8. Can you provide examples of recent developments in the market?
October 2022: The French government unveiled its ambitious Energy Efficiency Plan, with the objective of achieving a 10% reduction in energy consumption by 2024. The government's comprehensive set of measures is expected to result in a substantial reduction of approximately 50 terawatt hours (TWh) annually. This initiative marks a crucial initial stride toward achieving carbon neutrality by 2050, necessitating a 40% decrease in energy consumption. As a result, the demand for Fiber Bragg Grating (FBG) sensors is set to rise, bolstering growth in the sensor market.
9. What pricing options are available for accessing the report?
Pricing options include single-user, multi-user, and enterprise licenses priced at USD 4750, USD 5250, and USD 8750 respectively.
10. Is the market size provided in terms of value or volume?
The market size is provided in terms of value, measured in Million.
11. Are there any specific market keywords associated with the report?
Yes, the market keyword associated with the report is "FBG Industry," which aids in identifying and referencing the specific market segment covered.
12. How do I determine which pricing option suits my needs best?
The pricing options vary based on user requirements and access needs. Individual users may opt for single-user licenses, while businesses requiring broader access may choose multi-user or enterprise licenses for cost-effective access to the report.
13. Are there any additional resources or data provided in the FBG Industry report?
While the report offers comprehensive insights, it's advisable to review the specific contents or supplementary materials provided to ascertain if additional resources or data are available.
14. How can I stay updated on further developments or reports in the FBG Industry?
To stay informed about further developments, trends, and reports in the FBG Industry, consider subscribing to industry newsletters, following relevant companies and organizations, or regularly checking reputable industry news sources and publications.
Methodology
Step 1 - Identification of Relevant Samples Size from Population Database


Step 2 - Approaches for Defining Global Market Size (Value, Volume* & Price*)

Note*: In applicable scenarios
Step 3 - Data Sources
Primary Research
- Web Analytics
- Survey Reports
- Research Institute
- Latest Research Reports
- Opinion Leaders
Secondary Research
- Annual Reports
- White Paper
- Latest Press Release
- Industry Association
- Paid Database
- Investor Presentations

Step 4 - Data Triangulation
Involves using different sources of information in order to increase the validity of a study
These sources are likely to be stakeholders in a program - participants, other researchers, program staff, other community members, and so on.
Then we put all data in single framework & apply various statistical tools to find out the dynamic on the market.
During the analysis stage, feedback from the stakeholder groups would be compared to determine areas of agreement as well as areas of divergence


