
Key Insights
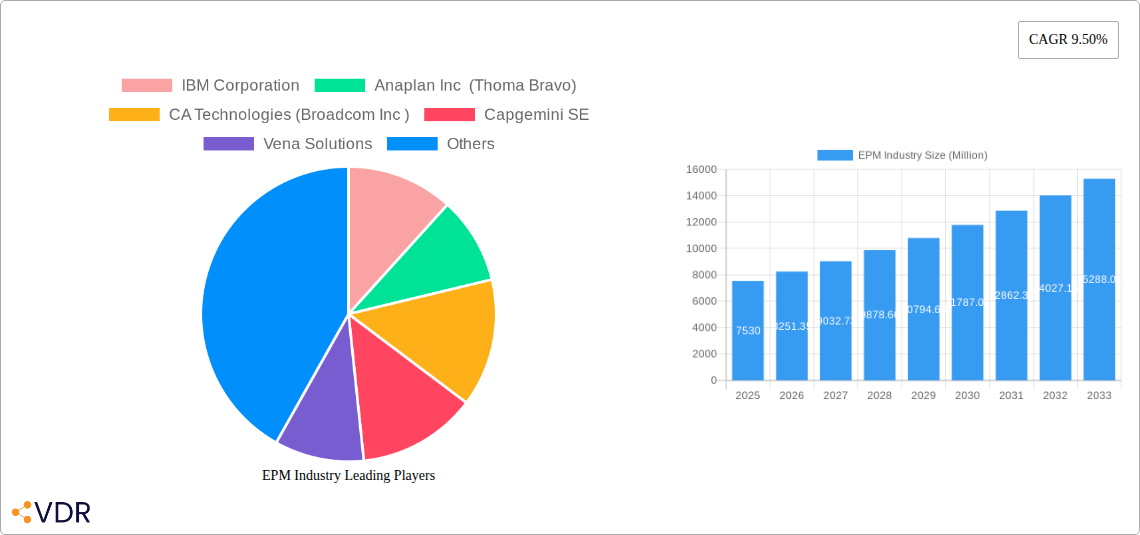
The Enterprise Performance Management (EPM) industry is experiencing robust growth, projected to reach a market size of $7.53 billion in 2025, exhibiting a Compound Annual Growth Rate (CAGR) of 9.50% from 2019 to 2033. This expansion is fueled by several key drivers. Increasing demand for real-time data analytics and improved decision-making capabilities across various industries is a primary catalyst. Businesses are increasingly adopting cloud-based EPM solutions for enhanced scalability, accessibility, and cost-effectiveness. Furthermore, the growing complexity of business operations, coupled with the need for better financial planning and analysis, is driving adoption. The BFSI (Banking, Financial Services, and Insurance) sector, along with telecommunications and healthcare, are major contributors to market growth due to their stringent regulatory compliance needs and the criticality of accurate financial reporting. The shift towards large enterprises adopting comprehensive EPM suites contributes to market expansion, while smaller and medium-sized businesses are increasingly adopting more focused solutions tailored to their specific needs. Competitive pressures are fostering innovation, with companies constantly enhancing their offerings with advanced functionalities like AI and machine learning integration.
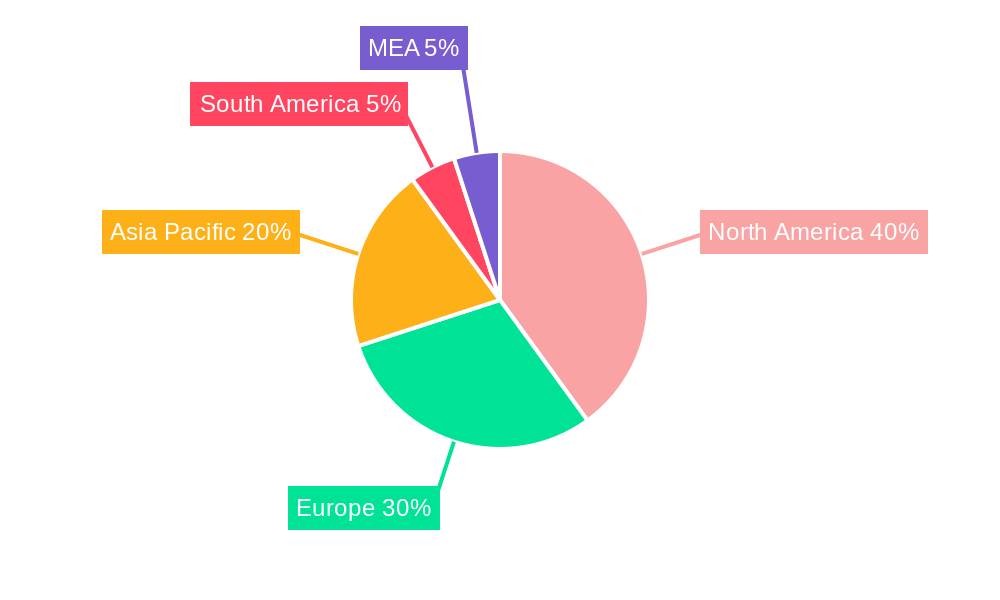
The EPM market is segmented by deployment (on-premise and cloud), enterprise size (small and medium, large), and end-user industry (BFSI, telecommunications, healthcare, manufacturing, and others). The cloud-based segment is expected to dominate owing to its inherent advantages. While North America currently holds a significant market share, the Asia-Pacific region is anticipated to witness substantial growth, driven by rapid digitalization and increasing adoption across various sectors. However, factors like high implementation costs, lack of skilled professionals, and data security concerns pose challenges to widespread adoption. To mitigate these, vendors are focusing on user-friendly interfaces, robust security features, and comprehensive training programs. The increasing adoption of integrated EPM solutions, combining financial planning, budgeting, forecasting, and reporting capabilities, is another noteworthy trend shaping the market’s future. Competition is intense among established players like IBM, Oracle, and SAP, alongside emerging players offering specialized solutions, resulting in continuous innovation and improved offerings for users.
EPM Industry Market Dynamics & Structure
This comprehensive report provides a deep dive into the Enterprise Performance Management (EPM) industry, encompassing the period 2019-2033. The study analyzes market dynamics, competitive landscapes, and future growth projections, offering crucial insights for industry professionals, investors, and strategic decision-makers. The market is characterized by a moderate level of concentration, with key players like IBM Corporation, Anaplan Inc (Thoma Bravo), CA Technologies (Broadcom Inc), Capgemini SE, Vena Solutions, Adaptive Insights Inc (Workday Inc), Oracle Corporation, Talentia Software, Workiva Inc, HCL Technologies Limited, and SAP SE vying for market share. However, the market also exhibits considerable fragmentation, particularly within the smaller and medium-sized enterprise segments.
- Market Concentration: The top 5 players hold an estimated xx% market share in 2025, indicating a moderately concentrated market with significant opportunities for smaller players.
- Technological Innovation: Cloud-based EPM solutions are driving significant innovation, fostering agility and real-time insights. However, legacy systems and integration challenges remain barriers to complete cloud adoption.
- Regulatory Frameworks: Compliance requirements, such as data privacy regulations (e.g., GDPR), influence EPM software selection and implementation strategies.
- Competitive Product Substitutes: General-purpose business intelligence tools and spreadsheets pose some competition, particularly in smaller organizations with less complex needs.
- End-User Demographics: The demand for EPM solutions is predominantly driven by large enterprises across diverse sectors, including BFSI, Telecommunications, Healthcare, and Manufacturing. However, SMB adoption is also increasing.
- M&A Trends: The EPM sector has witnessed several significant mergers and acquisitions (M&A) activities in recent years, signaling consolidation and strategic expansion by major players. An estimated xx M&A deals were recorded between 2019 and 2024, with a total value of xx million.
EPM Industry Growth Trends & Insights
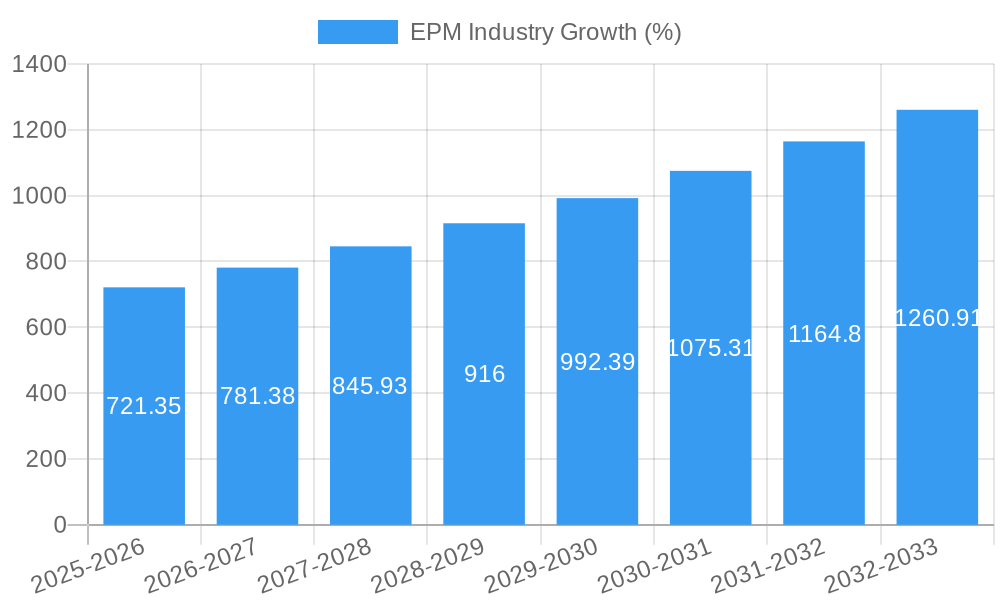
The global EPM market is poised for robust growth throughout the forecast period (2025-2033). Driven by increasing demand for data-driven decision-making, enhanced operational efficiency, and the rise of cloud-based solutions, the market is projected to experience a Compound Annual Growth Rate (CAGR) of xx% from 2025 to 2033, reaching a market size of xx million by 2033. The shift towards cloud deployment models is a key driver, offering scalability, cost-effectiveness, and accessibility. Moreover, the increasing adoption of advanced analytics and artificial intelligence (AI) within EPM platforms is revolutionizing business planning and forecasting processes. Consumer behavior shifts towards real-time data visibility and predictive analytics are further accelerating market growth. Market penetration in key sectors, particularly BFSI and manufacturing, is expected to increase significantly, reaching xx% by 2033. The historical period (2019-2024) showcased a CAGR of xx%, laying a solid foundation for future expansion.
Dominant Regions, Countries, or Segments in EPM Industry
North America currently holds the largest market share in the EPM industry, driven by high technological adoption rates, established business infrastructure, and a strong presence of major EPM vendors. However, the Asia-Pacific region is expected to witness the fastest growth during the forecast period, fueled by increasing digitalization initiatives, expanding economies, and rising demand from emerging markets in countries like India and China.
- Dominant Deployment Model: Cloud-based deployments are rapidly gaining traction, surpassing on-premise solutions in market share by 2025, driven by their scalability, cost-efficiency, and accessibility.
- Dominant Enterprise Size: Large enterprises currently dominate the EPM market due to their complex operational requirements and higher budgets. However, the SMB segment is showing significant growth potential.
- Dominant End-user Industry: The BFSI sector remains a major driver of market growth, followed closely by the manufacturing and telecommunications sectors.
Key drivers for regional dominance include supportive government policies promoting digital transformation, robust technological infrastructure, and a growing pool of skilled professionals. The growth potential in other regions, particularly in emerging economies, is significant, primarily driven by increasing investments in digital infrastructure and rising awareness of EPM's benefits.
EPM Industry Product Landscape
The EPM product landscape is evolving rapidly, with vendors continually introducing innovative features and functionalities to meet evolving business needs. Current offerings range from on-premise solutions to cloud-based platforms, catering to various enterprise sizes and industries. Key product innovations include advanced analytics capabilities, AI-powered forecasting, integrated business intelligence dashboards, and enhanced mobile accessibility. These advancements provide users with real-time insights, improved decision-making capabilities, and streamlined operational processes. The focus is shifting towards comprehensive, integrated platforms that offer a unified view of an organization's financial and operational performance. Unique selling propositions include ease of use, robust data visualization, strong security features, and seamless integration with existing enterprise systems.
Key Drivers, Barriers & Challenges in EPM Industry
Key Drivers: The increasing need for data-driven decision-making, the growing adoption of cloud computing, the rise of advanced analytics and AI, and government initiatives promoting digital transformation are significant drivers of market growth. The need for improved operational efficiency and better financial planning and forecasting also contribute substantially.
Key Challenges & Restraints: High initial investment costs, integration complexities with legacy systems, the lack of skilled professionals, data security and privacy concerns, and the presence of competitive substitute solutions represent major challenges. These factors can hinder market adoption, particularly among smaller enterprises. Furthermore, supply chain disruptions and evolving regulatory frameworks add further complexity. The estimated impact of these restraints on market growth is a reduction of xx million in revenue by 2033.
Emerging Opportunities in EPM Industry
Emerging opportunities lie in untapped markets such as small and medium-sized enterprises (SMEs) and specific industry verticals like healthcare and education. The integration of EPM solutions with other enterprise software applications (such as CRM and supply chain management systems) will create new growth opportunities. Moreover, advancements in areas such as predictive analytics, prescriptive analytics, and AI-driven decision support will further enhance the value proposition of EPM platforms. The increasing adoption of IoT devices and the growth of big data analytics also present significant opportunities.
Growth Accelerators in the EPM Industry Industry
Strategic partnerships between EPM vendors and technology providers, coupled with the development of innovative EPM solutions tailored to specific industry needs, are key growth accelerators. The expansion of cloud-based platforms and enhanced mobile accessibility is broadening market reach and improving user engagement. Furthermore, advancements in artificial intelligence and machine learning are driving improved automation and predictive capabilities within EPM systems.
Key Players Shaping the EPM Industry Market
- IBM Corporation
- Anaplan Inc (Thoma Bravo)
- CA Technologies (Broadcom Inc)
- Capgemini SE
- Vena Solutions
- Adaptive Insights Inc (Workday Inc)
- Oracle Corporation
- Talentia Software
- Workiva Inc
- HCL Technologies Limited
- SAP SE
Notable Milestones in EPM Industry Sector
- April 2022: Oracle Corporation extended support for Hyperion Enterprise Performance Management 11.2 until at least 2033, ensuring long-term stability for existing users.
- January 2022: PT Metrodata Electronics Tbk partnered with Anaplan Inc., expanding the reach of Anaplan's Connected Planning platform in Indonesia.
In-Depth EPM Industry Market Outlook
The EPM industry is poised for sustained growth, driven by technological advancements, increasing demand for data-driven insights, and the expansion of cloud-based solutions. Strategic partnerships and the development of innovative solutions tailored to specific industry needs will further fuel market expansion. The focus on improving operational efficiency, enhancing financial planning and forecasting, and embracing the potential of AI and machine learning will define the future of the EPM industry, opening up substantial opportunities for both established players and new entrants. The market is expected to continue its trajectory of growth and transformation, driven by the persistent need for efficient and insightful business management solutions.
EPM Industry Segmentation
-
1. Deployment
- 1.1. On-premise
- 1.2. Cloud
-
2. Size of Enterprise
- 2.1. Small and Medium
- 2.2. Large
-
3. End-user Industry
- 3.1. BFSI
- 3.2. Telecommunication
- 3.3. Healthcare
- 3.4. Manufacturing
- 3.5. Other End -user Industries
EPM Industry Segmentation By Geography
- 1. North America
- 2. Europe
- 3. Asia Pacific
- 4. Rest of World
EPM Industry REPORT HIGHLIGHTS
| Aspects | Details |
|---|---|
| Study Period | 2019-2033 |
| Base Year | 2024 |
| Estimated Year | 2025 |
| Forecast Period | 2025-2033 |
| Historical Period | 2019-2024 |
| Growth Rate | CAGR of 9.50% from 2019-2033 |
| Segmentation |
|
Table of Contents
- 1. Introduction
- 1.1. Research Scope
- 1.2. Market Segmentation
- 1.3. Research Methodology
- 1.4. Definitions and Assumptions
- 2. Executive Summary
- 2.1. Introduction
- 3. Market Dynamics
- 3.1. Introduction
- 3.2. Market Drivers
- 3.2.1. Need for Minimizing Operational Expenses; Proliferation of Data Driven Decision Making
- 3.3. Market Restrains
- 3.3.1. Lack of Awareness and Knowledge Among Enterprises
- 3.4. Market Trends
- 3.4.1. BFSI Sector is Expected to Account for Major Market Share
- 4. Market Factor Analysis
- 4.1. Porters Five Forces
- 4.2. Supply/Value Chain
- 4.3. PESTEL analysis
- 4.4. Market Entropy
- 4.5. Patent/Trademark Analysis
- 5. Global EPM Industry Analysis, Insights and Forecast, 2019-2031
- 5.1. Market Analysis, Insights and Forecast - by Deployment
- 5.1.1. On-premise
- 5.1.2. Cloud
- 5.2. Market Analysis, Insights and Forecast - by Size of Enterprise
- 5.2.1. Small and Medium
- 5.2.2. Large
- 5.3. Market Analysis, Insights and Forecast - by End-user Industry
- 5.3.1. BFSI
- 5.3.2. Telecommunication
- 5.3.3. Healthcare
- 5.3.4. Manufacturing
- 5.3.5. Other End -user Industries
- 5.4. Market Analysis, Insights and Forecast - by Region
- 5.4.1. North America
- 5.4.2. Europe
- 5.4.3. Asia Pacific
- 5.4.4. Rest of World
- 5.1. Market Analysis, Insights and Forecast - by Deployment
- 6. North America EPM Industry Analysis, Insights and Forecast, 2019-2031
- 6.1. Market Analysis, Insights and Forecast - by Deployment
- 6.1.1. On-premise
- 6.1.2. Cloud
- 6.2. Market Analysis, Insights and Forecast - by Size of Enterprise
- 6.2.1. Small and Medium
- 6.2.2. Large
- 6.3. Market Analysis, Insights and Forecast - by End-user Industry
- 6.3.1. BFSI
- 6.3.2. Telecommunication
- 6.3.3. Healthcare
- 6.3.4. Manufacturing
- 6.3.5. Other End -user Industries
- 6.1. Market Analysis, Insights and Forecast - by Deployment
- 7. Europe EPM Industry Analysis, Insights and Forecast, 2019-2031
- 7.1. Market Analysis, Insights and Forecast - by Deployment
- 7.1.1. On-premise
- 7.1.2. Cloud
- 7.2. Market Analysis, Insights and Forecast - by Size of Enterprise
- 7.2.1. Small and Medium
- 7.2.2. Large
- 7.3. Market Analysis, Insights and Forecast - by End-user Industry
- 7.3.1. BFSI
- 7.3.2. Telecommunication
- 7.3.3. Healthcare
- 7.3.4. Manufacturing
- 7.3.5. Other End -user Industries
- 7.1. Market Analysis, Insights and Forecast - by Deployment
- 8. Asia Pacific EPM Industry Analysis, Insights and Forecast, 2019-2031
- 8.1. Market Analysis, Insights and Forecast - by Deployment
- 8.1.1. On-premise
- 8.1.2. Cloud
- 8.2. Market Analysis, Insights and Forecast - by Size of Enterprise
- 8.2.1. Small and Medium
- 8.2.2. Large
- 8.3. Market Analysis, Insights and Forecast - by End-user Industry
- 8.3.1. BFSI
- 8.3.2. Telecommunication
- 8.3.3. Healthcare
- 8.3.4. Manufacturing
- 8.3.5. Other End -user Industries
- 8.1. Market Analysis, Insights and Forecast - by Deployment
- 9. Rest of World EPM Industry Analysis, Insights and Forecast, 2019-2031
- 9.1. Market Analysis, Insights and Forecast - by Deployment
- 9.1.1. On-premise
- 9.1.2. Cloud
- 9.2. Market Analysis, Insights and Forecast - by Size of Enterprise
- 9.2.1. Small and Medium
- 9.2.2. Large
- 9.3. Market Analysis, Insights and Forecast - by End-user Industry
- 9.3.1. BFSI
- 9.3.2. Telecommunication
- 9.3.3. Healthcare
- 9.3.4. Manufacturing
- 9.3.5. Other End -user Industries
- 9.1. Market Analysis, Insights and Forecast - by Deployment
- 10. North America EPM Industry Analysis, Insights and Forecast, 2019-2031
- 10.1. Market Analysis, Insights and Forecast - By Country/Sub-region
- 10.1.1 United States
- 10.1.2 Canada
- 10.1.3 Mexico
- 11. Europe EPM Industry Analysis, Insights and Forecast, 2019-2031
- 11.1. Market Analysis, Insights and Forecast - By Country/Sub-region
- 11.1.1 Germany
- 11.1.2 United Kingdom
- 11.1.3 France
- 11.1.4 Spain
- 11.1.5 Italy
- 11.1.6 Spain
- 11.1.7 Belgium
- 11.1.8 Netherland
- 11.1.9 Nordics
- 11.1.10 Rest of Europe
- 12. Asia Pacific EPM Industry Analysis, Insights and Forecast, 2019-2031
- 12.1. Market Analysis, Insights and Forecast - By Country/Sub-region
- 12.1.1 China
- 12.1.2 Japan
- 12.1.3 India
- 12.1.4 South Korea
- 12.1.5 Southeast Asia
- 12.1.6 Australia
- 12.1.7 Indonesia
- 12.1.8 Phillipes
- 12.1.9 Singapore
- 12.1.10 Thailandc
- 12.1.11 Rest of Asia Pacific
- 13. South America EPM Industry Analysis, Insights and Forecast, 2019-2031
- 13.1. Market Analysis, Insights and Forecast - By Country/Sub-region
- 13.1.1 Brazil
- 13.1.2 Argentina
- 13.1.3 Peru
- 13.1.4 Chile
- 13.1.5 Colombia
- 13.1.6 Ecuador
- 13.1.7 Venezuela
- 13.1.8 Rest of South America
- 14. North America EPM Industry Analysis, Insights and Forecast, 2019-2031
- 14.1. Market Analysis, Insights and Forecast - By Country/Sub-region
- 14.1.1 United States
- 14.1.2 Canada
- 14.1.3 Mexico
- 15. MEA EPM Industry Analysis, Insights and Forecast, 2019-2031
- 15.1. Market Analysis, Insights and Forecast - By Country/Sub-region
- 15.1.1 United Arab Emirates
- 15.1.2 Saudi Arabia
- 15.1.3 South Africa
- 15.1.4 Rest of Middle East and Africa
- 16. Competitive Analysis
- 16.1. Global Market Share Analysis 2024
- 16.2. Company Profiles
- 16.2.1 IBM Corporation
- 16.2.1.1. Overview
- 16.2.1.2. Products
- 16.2.1.3. SWOT Analysis
- 16.2.1.4. Recent Developments
- 16.2.1.5. Financials (Based on Availability)
- 16.2.2 Anaplan Inc (Thoma Bravo)
- 16.2.2.1. Overview
- 16.2.2.2. Products
- 16.2.2.3. SWOT Analysis
- 16.2.2.4. Recent Developments
- 16.2.2.5. Financials (Based on Availability)
- 16.2.3 CA Technologies (Broadcom Inc )
- 16.2.3.1. Overview
- 16.2.3.2. Products
- 16.2.3.3. SWOT Analysis
- 16.2.3.4. Recent Developments
- 16.2.3.5. Financials (Based on Availability)
- 16.2.4 Capgemini SE
- 16.2.4.1. Overview
- 16.2.4.2. Products
- 16.2.4.3. SWOT Analysis
- 16.2.4.4. Recent Developments
- 16.2.4.5. Financials (Based on Availability)
- 16.2.5 Vena Solutions
- 16.2.5.1. Overview
- 16.2.5.2. Products
- 16.2.5.3. SWOT Analysis
- 16.2.5.4. Recent Developments
- 16.2.5.5. Financials (Based on Availability)
- 16.2.6 Adaptive Insights Inc (Workday Inc )
- 16.2.6.1. Overview
- 16.2.6.2. Products
- 16.2.6.3. SWOT Analysis
- 16.2.6.4. Recent Developments
- 16.2.6.5. Financials (Based on Availability)
- 16.2.7 Oracle Corporation
- 16.2.7.1. Overview
- 16.2.7.2. Products
- 16.2.7.3. SWOT Analysis
- 16.2.7.4. Recent Developments
- 16.2.7.5. Financials (Based on Availability)
- 16.2.8 Talentia Software*List Not Exhaustive
- 16.2.8.1. Overview
- 16.2.8.2. Products
- 16.2.8.3. SWOT Analysis
- 16.2.8.4. Recent Developments
- 16.2.8.5. Financials (Based on Availability)
- 16.2.9 Workiva Inc
- 16.2.9.1. Overview
- 16.2.9.2. Products
- 16.2.9.3. SWOT Analysis
- 16.2.9.4. Recent Developments
- 16.2.9.5. Financials (Based on Availability)
- 16.2.10 HCL Technologies Limited
- 16.2.10.1. Overview
- 16.2.10.2. Products
- 16.2.10.3. SWOT Analysis
- 16.2.10.4. Recent Developments
- 16.2.10.5. Financials (Based on Availability)
- 16.2.11 SAP SE
- 16.2.11.1. Overview
- 16.2.11.2. Products
- 16.2.11.3. SWOT Analysis
- 16.2.11.4. Recent Developments
- 16.2.11.5. Financials (Based on Availability)
- 16.2.1 IBM Corporation
List of Figures
- Figure 1: Global EPM Industry Revenue Breakdown (Million, %) by Region 2024 & 2032
- Figure 2: North America EPM Industry Revenue (Million), by Country 2024 & 2032
- Figure 3: North America EPM Industry Revenue Share (%), by Country 2024 & 2032
- Figure 4: Europe EPM Industry Revenue (Million), by Country 2024 & 2032
- Figure 5: Europe EPM Industry Revenue Share (%), by Country 2024 & 2032
- Figure 6: Asia Pacific EPM Industry Revenue (Million), by Country 2024 & 2032
- Figure 7: Asia Pacific EPM Industry Revenue Share (%), by Country 2024 & 2032
- Figure 8: South America EPM Industry Revenue (Million), by Country 2024 & 2032
- Figure 9: South America EPM Industry Revenue Share (%), by Country 2024 & 2032
- Figure 10: North America EPM Industry Revenue (Million), by Country 2024 & 2032
- Figure 11: North America EPM Industry Revenue Share (%), by Country 2024 & 2032
- Figure 12: MEA EPM Industry Revenue (Million), by Country 2024 & 2032
- Figure 13: MEA EPM Industry Revenue Share (%), by Country 2024 & 2032
- Figure 14: North America EPM Industry Revenue (Million), by Deployment 2024 & 2032
- Figure 15: North America EPM Industry Revenue Share (%), by Deployment 2024 & 2032
- Figure 16: North America EPM Industry Revenue (Million), by Size of Enterprise 2024 & 2032
- Figure 17: North America EPM Industry Revenue Share (%), by Size of Enterprise 2024 & 2032
- Figure 18: North America EPM Industry Revenue (Million), by End-user Industry 2024 & 2032
- Figure 19: North America EPM Industry Revenue Share (%), by End-user Industry 2024 & 2032
- Figure 20: North America EPM Industry Revenue (Million), by Country 2024 & 2032
- Figure 21: North America EPM Industry Revenue Share (%), by Country 2024 & 2032
- Figure 22: Europe EPM Industry Revenue (Million), by Deployment 2024 & 2032
- Figure 23: Europe EPM Industry Revenue Share (%), by Deployment 2024 & 2032
- Figure 24: Europe EPM Industry Revenue (Million), by Size of Enterprise 2024 & 2032
- Figure 25: Europe EPM Industry Revenue Share (%), by Size of Enterprise 2024 & 2032
- Figure 26: Europe EPM Industry Revenue (Million), by End-user Industry 2024 & 2032
- Figure 27: Europe EPM Industry Revenue Share (%), by End-user Industry 2024 & 2032
- Figure 28: Europe EPM Industry Revenue (Million), by Country 2024 & 2032
- Figure 29: Europe EPM Industry Revenue Share (%), by Country 2024 & 2032
- Figure 30: Asia Pacific EPM Industry Revenue (Million), by Deployment 2024 & 2032
- Figure 31: Asia Pacific EPM Industry Revenue Share (%), by Deployment 2024 & 2032
- Figure 32: Asia Pacific EPM Industry Revenue (Million), by Size of Enterprise 2024 & 2032
- Figure 33: Asia Pacific EPM Industry Revenue Share (%), by Size of Enterprise 2024 & 2032
- Figure 34: Asia Pacific EPM Industry Revenue (Million), by End-user Industry 2024 & 2032
- Figure 35: Asia Pacific EPM Industry Revenue Share (%), by End-user Industry 2024 & 2032
- Figure 36: Asia Pacific EPM Industry Revenue (Million), by Country 2024 & 2032
- Figure 37: Asia Pacific EPM Industry Revenue Share (%), by Country 2024 & 2032
- Figure 38: Rest of World EPM Industry Revenue (Million), by Deployment 2024 & 2032
- Figure 39: Rest of World EPM Industry Revenue Share (%), by Deployment 2024 & 2032
- Figure 40: Rest of World EPM Industry Revenue (Million), by Size of Enterprise 2024 & 2032
- Figure 41: Rest of World EPM Industry Revenue Share (%), by Size of Enterprise 2024 & 2032
- Figure 42: Rest of World EPM Industry Revenue (Million), by End-user Industry 2024 & 2032
- Figure 43: Rest of World EPM Industry Revenue Share (%), by End-user Industry 2024 & 2032
- Figure 44: Rest of World EPM Industry Revenue (Million), by Country 2024 & 2032
- Figure 45: Rest of World EPM Industry Revenue Share (%), by Country 2024 & 2032
List of Tables
- Table 1: Global EPM Industry Revenue Million Forecast, by Region 2019 & 2032
- Table 2: Global EPM Industry Revenue Million Forecast, by Deployment 2019 & 2032
- Table 3: Global EPM Industry Revenue Million Forecast, by Size of Enterprise 2019 & 2032
- Table 4: Global EPM Industry Revenue Million Forecast, by End-user Industry 2019 & 2032
- Table 5: Global EPM Industry Revenue Million Forecast, by Region 2019 & 2032
- Table 6: Global EPM Industry Revenue Million Forecast, by Country 2019 & 2032
- Table 7: United States EPM Industry Revenue (Million) Forecast, by Application 2019 & 2032
- Table 8: Canada EPM Industry Revenue (Million) Forecast, by Application 2019 & 2032
- Table 9: Mexico EPM Industry Revenue (Million) Forecast, by Application 2019 & 2032
- Table 10: Global EPM Industry Revenue Million Forecast, by Country 2019 & 2032
- Table 11: Germany EPM Industry Revenue (Million) Forecast, by Application 2019 & 2032
- Table 12: United Kingdom EPM Industry Revenue (Million) Forecast, by Application 2019 & 2032
- Table 13: France EPM Industry Revenue (Million) Forecast, by Application 2019 & 2032
- Table 14: Spain EPM Industry Revenue (Million) Forecast, by Application 2019 & 2032
- Table 15: Italy EPM Industry Revenue (Million) Forecast, by Application 2019 & 2032
- Table 16: Spain EPM Industry Revenue (Million) Forecast, by Application 2019 & 2032
- Table 17: Belgium EPM Industry Revenue (Million) Forecast, by Application 2019 & 2032
- Table 18: Netherland EPM Industry Revenue (Million) Forecast, by Application 2019 & 2032
- Table 19: Nordics EPM Industry Revenue (Million) Forecast, by Application 2019 & 2032
- Table 20: Rest of Europe EPM Industry Revenue (Million) Forecast, by Application 2019 & 2032
- Table 21: Global EPM Industry Revenue Million Forecast, by Country 2019 & 2032
- Table 22: China EPM Industry Revenue (Million) Forecast, by Application 2019 & 2032
- Table 23: Japan EPM Industry Revenue (Million) Forecast, by Application 2019 & 2032
- Table 24: India EPM Industry Revenue (Million) Forecast, by Application 2019 & 2032
- Table 25: South Korea EPM Industry Revenue (Million) Forecast, by Application 2019 & 2032
- Table 26: Southeast Asia EPM Industry Revenue (Million) Forecast, by Application 2019 & 2032
- Table 27: Australia EPM Industry Revenue (Million) Forecast, by Application 2019 & 2032
- Table 28: Indonesia EPM Industry Revenue (Million) Forecast, by Application 2019 & 2032
- Table 29: Phillipes EPM Industry Revenue (Million) Forecast, by Application 2019 & 2032
- Table 30: Singapore EPM Industry Revenue (Million) Forecast, by Application 2019 & 2032
- Table 31: Thailandc EPM Industry Revenue (Million) Forecast, by Application 2019 & 2032
- Table 32: Rest of Asia Pacific EPM Industry Revenue (Million) Forecast, by Application 2019 & 2032
- Table 33: Global EPM Industry Revenue Million Forecast, by Country 2019 & 2032
- Table 34: Brazil EPM Industry Revenue (Million) Forecast, by Application 2019 & 2032
- Table 35: Argentina EPM Industry Revenue (Million) Forecast, by Application 2019 & 2032
- Table 36: Peru EPM Industry Revenue (Million) Forecast, by Application 2019 & 2032
- Table 37: Chile EPM Industry Revenue (Million) Forecast, by Application 2019 & 2032
- Table 38: Colombia EPM Industry Revenue (Million) Forecast, by Application 2019 & 2032
- Table 39: Ecuador EPM Industry Revenue (Million) Forecast, by Application 2019 & 2032
- Table 40: Venezuela EPM Industry Revenue (Million) Forecast, by Application 2019 & 2032
- Table 41: Rest of South America EPM Industry Revenue (Million) Forecast, by Application 2019 & 2032
- Table 42: Global EPM Industry Revenue Million Forecast, by Country 2019 & 2032
- Table 43: United States EPM Industry Revenue (Million) Forecast, by Application 2019 & 2032
- Table 44: Canada EPM Industry Revenue (Million) Forecast, by Application 2019 & 2032
- Table 45: Mexico EPM Industry Revenue (Million) Forecast, by Application 2019 & 2032
- Table 46: Global EPM Industry Revenue Million Forecast, by Country 2019 & 2032
- Table 47: United Arab Emirates EPM Industry Revenue (Million) Forecast, by Application 2019 & 2032
- Table 48: Saudi Arabia EPM Industry Revenue (Million) Forecast, by Application 2019 & 2032
- Table 49: South Africa EPM Industry Revenue (Million) Forecast, by Application 2019 & 2032
- Table 50: Rest of Middle East and Africa EPM Industry Revenue (Million) Forecast, by Application 2019 & 2032
- Table 51: Global EPM Industry Revenue Million Forecast, by Deployment 2019 & 2032
- Table 52: Global EPM Industry Revenue Million Forecast, by Size of Enterprise 2019 & 2032
- Table 53: Global EPM Industry Revenue Million Forecast, by End-user Industry 2019 & 2032
- Table 54: Global EPM Industry Revenue Million Forecast, by Country 2019 & 2032
- Table 55: Global EPM Industry Revenue Million Forecast, by Deployment 2019 & 2032
- Table 56: Global EPM Industry Revenue Million Forecast, by Size of Enterprise 2019 & 2032
- Table 57: Global EPM Industry Revenue Million Forecast, by End-user Industry 2019 & 2032
- Table 58: Global EPM Industry Revenue Million Forecast, by Country 2019 & 2032
- Table 59: Global EPM Industry Revenue Million Forecast, by Deployment 2019 & 2032
- Table 60: Global EPM Industry Revenue Million Forecast, by Size of Enterprise 2019 & 2032
- Table 61: Global EPM Industry Revenue Million Forecast, by End-user Industry 2019 & 2032
- Table 62: Global EPM Industry Revenue Million Forecast, by Country 2019 & 2032
- Table 63: Global EPM Industry Revenue Million Forecast, by Deployment 2019 & 2032
- Table 64: Global EPM Industry Revenue Million Forecast, by Size of Enterprise 2019 & 2032
- Table 65: Global EPM Industry Revenue Million Forecast, by End-user Industry 2019 & 2032
- Table 66: Global EPM Industry Revenue Million Forecast, by Country 2019 & 2032
Frequently Asked Questions
1. What is the projected Compound Annual Growth Rate (CAGR) of the EPM Industry?
The projected CAGR is approximately 9.50%.
2. Which companies are prominent players in the EPM Industry?
Key companies in the market include IBM Corporation, Anaplan Inc (Thoma Bravo), CA Technologies (Broadcom Inc ), Capgemini SE, Vena Solutions, Adaptive Insights Inc (Workday Inc ), Oracle Corporation, Talentia Software*List Not Exhaustive, Workiva Inc, HCL Technologies Limited, SAP SE.
3. What are the main segments of the EPM Industry?
The market segments include Deployment, Size of Enterprise, End-user Industry.
4. Can you provide details about the market size?
The market size is estimated to be USD 7.53 Million as of 2022.
5. What are some drivers contributing to market growth?
Need for Minimizing Operational Expenses; Proliferation of Data Driven Decision Making.
6. What are the notable trends driving market growth?
BFSI Sector is Expected to Account for Major Market Share.
7. Are there any restraints impacting market growth?
Lack of Awareness and Knowledge Among Enterprises.
8. Can you provide examples of recent developments in the market?
April 2022 - Oracle Corporation extended support for the Hyperion Enterprise Performance Management 11.2, including Oracle Applications Unlimited, through at least 2033. The Oracle Applications covered under the extension include Hyperion, PeopleSoft, Siebel CRM, Oracle E-Business Suite, and others.
9. What pricing options are available for accessing the report?
Pricing options include single-user, multi-user, and enterprise licenses priced at USD 4750, USD 5250, and USD 8750 respectively.
10. Is the market size provided in terms of value or volume?
The market size is provided in terms of value, measured in Million.
11. Are there any specific market keywords associated with the report?
Yes, the market keyword associated with the report is "EPM Industry," which aids in identifying and referencing the specific market segment covered.
12. How do I determine which pricing option suits my needs best?
The pricing options vary based on user requirements and access needs. Individual users may opt for single-user licenses, while businesses requiring broader access may choose multi-user or enterprise licenses for cost-effective access to the report.
13. Are there any additional resources or data provided in the EPM Industry report?
While the report offers comprehensive insights, it's advisable to review the specific contents or supplementary materials provided to ascertain if additional resources or data are available.
14. How can I stay updated on further developments or reports in the EPM Industry?
To stay informed about further developments, trends, and reports in the EPM Industry, consider subscribing to industry newsletters, following relevant companies and organizations, or regularly checking reputable industry news sources and publications.
Methodology
Step 1 - Identification of Relevant Samples Size from Population Database


Step 2 - Approaches for Defining Global Market Size (Value, Volume* & Price*)

Note*: In applicable scenarios
Step 3 - Data Sources
Primary Research
- Web Analytics
- Survey Reports
- Research Institute
- Latest Research Reports
- Opinion Leaders
Secondary Research
- Annual Reports
- White Paper
- Latest Press Release
- Industry Association
- Paid Database
- Investor Presentations

Step 4 - Data Triangulation
Involves using different sources of information in order to increase the validity of a study
These sources are likely to be stakeholders in a program - participants, other researchers, program staff, other community members, and so on.
Then we put all data in single framework & apply various statistical tools to find out the dynamic on the market.
During the analysis stage, feedback from the stakeholder groups would be compared to determine areas of agreement as well as areas of divergence


