
Key Insights
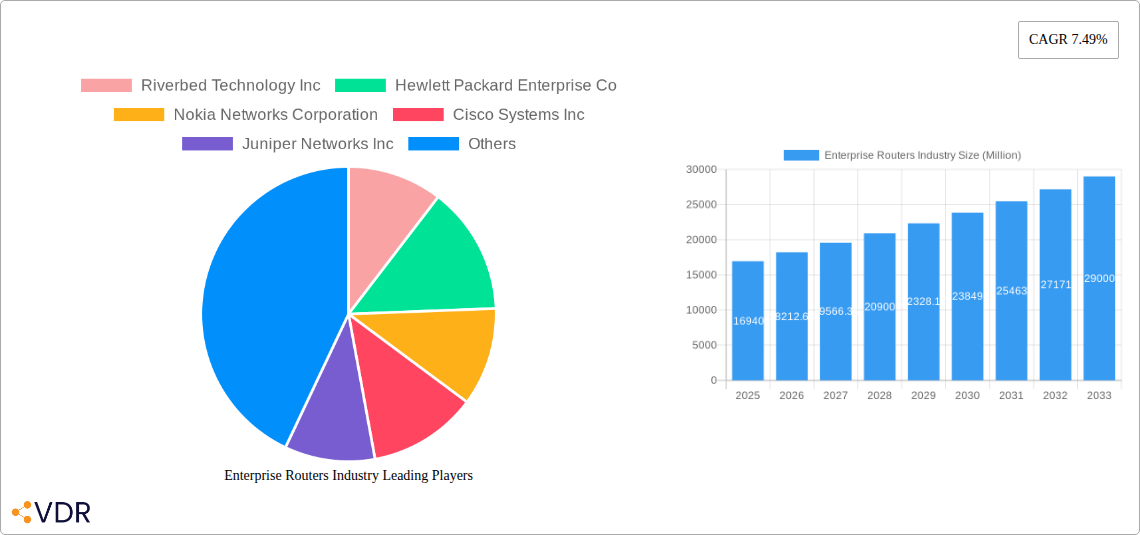
The Enterprise Router market, valued at $16.94 billion in 2025, is projected to experience robust growth, driven by the increasing adoption of cloud computing, the expansion of 5G networks, and the rising demand for secure and reliable network infrastructure across various sectors. The compound annual growth rate (CAGR) of 7.49% from 2025 to 2033 indicates a significant market expansion. Key growth drivers include the need for high-bandwidth connectivity to support data-intensive applications, the rising adoption of Software-Defined Networking (SDN) and Network Function Virtualization (NFV) technologies for greater network agility and efficiency, and the increasing importance of cybersecurity in the face of evolving threats. The BFSI, IT & Telecom, and Healthcare sectors are major contributors to market growth, fueled by their need for robust and secure network solutions to manage sensitive data and critical operations. Wireless connectivity is anticipated to show faster growth than wired connectivity due to the increasing adoption of mobile devices and remote work strategies. Modular port types are gaining traction due to their flexibility and scalability, while core routers and multi-service edge routers are the dominant types within the market, catering to diverse network requirements.
The market's growth is also influenced by several trends. The increasing adoption of the Internet of Things (IoT) is generating a significant demand for enterprise routers capable of managing large volumes of data from connected devices. Furthermore, the rising focus on edge computing is shifting network traffic closer to the data source, driving the demand for edge routers with enhanced processing capabilities. While the market exhibits promising growth prospects, certain restraints exist, including high initial investment costs associated with deploying advanced networking solutions, potential security vulnerabilities, and the complexity of integrating new technologies into existing infrastructure. However, the long-term benefits of improved network performance, enhanced security, and increased operational efficiency are expected to outweigh these challenges, driving sustained market growth throughout the forecast period. Competition among established players like Cisco, Juniper, and Huawei, alongside emerging vendors, will further shape the market landscape.
Enterprise Routers Industry Market Report: 2019-2033
This comprehensive report provides a detailed analysis of the Enterprise Routers market, encompassing historical data (2019-2024), current estimates (2025), and future forecasts (2025-2033). The study covers key market segments, including end-user verticals (BFSI, IT & Telecom, Healthcare, Retail, Manufacturing, and Others), connectivity types (Wired, Wireless), port types (Fixed Port, Modular), and router types (Core Routers, Multi-Services Edge, Access Router, and Others). We examine market dynamics, growth trends, regional dominance, leading players (including Riverbed Technology Inc, Hewlett Packard Enterprise Co, Nokia Networks Corporation, Cisco Systems Inc, Juniper Networks Inc, Avaya Inc, Dell Inc, Alcatel-Lucent S A, Huawei Technologies Co Ltd, and ZTE Corporation), and emerging opportunities within this multi-billion dollar industry. The report is invaluable for industry professionals, investors, and strategic decision-makers seeking in-depth insights into this rapidly evolving landscape.
Enterprise Routers Industry Market Dynamics & Structure
The enterprise router market is characterized by a moderately consolidated structure, with a few major players holding significant market share. Market concentration is influenced by factors such as technological innovation, regulatory landscapes, and the presence of competitive substitutes (e.g., software-defined networking solutions). The market exhibits robust growth driven by increasing digital transformation initiatives across diverse end-user verticals. Mergers and acquisitions (M&A) activity is moderately active, with larger players consolidating their positions and acquiring smaller niche players to expand their product portfolios and geographic reach.
- Market Concentration: The top 5 players hold approximately xx% of the market share in 2025 (estimated).
- Technological Innovation: Key drivers include advancements in 5G, software-defined networking (SDN), and network function virtualization (NFV).
- Regulatory Frameworks: Government regulations related to data security and network infrastructure impact market growth and adoption.
- Competitive Product Substitutes: Software-defined WAN (SD-WAN) solutions and cloud-based networking services pose a competitive threat.
- End-User Demographics: The increasing adoption of cloud computing and IoT devices fuels demand across various sectors.
- M&A Trends: xx M&A deals were recorded in the industry between 2019 and 2024. Deal volumes are expected to increase slightly in the forecast period.
Enterprise Routers Industry Growth Trends & Insights
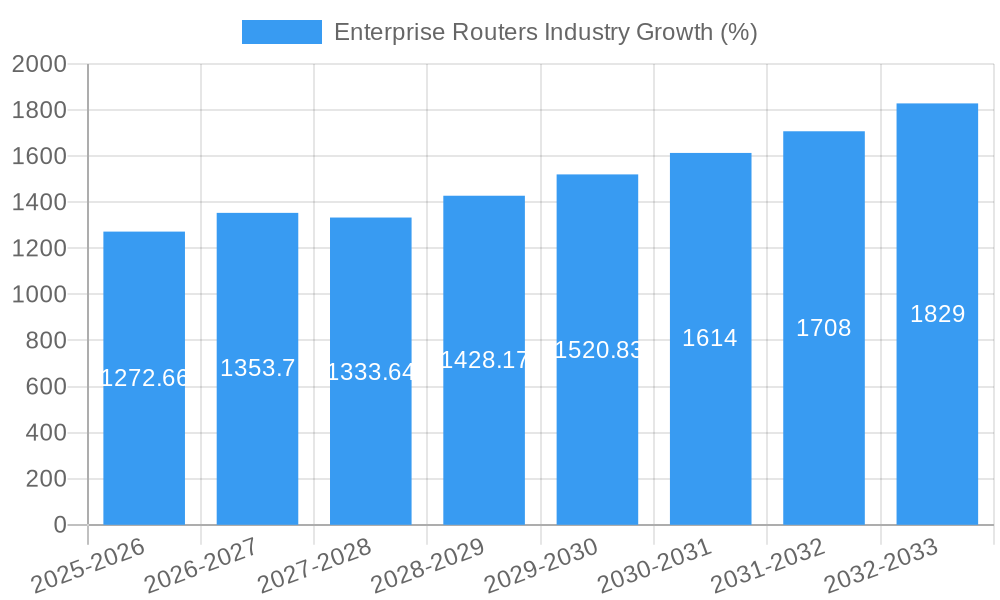
The global enterprise router market experienced significant growth during the historical period (2019-2024), with a CAGR of xx%. This growth is primarily attributed to the expanding adoption of cloud computing, the proliferation of IoT devices, and the increasing demand for high-bandwidth and low-latency networks across various industries. The market size in 2025 is estimated at xx million units. Technological disruptions, such as the rise of SDN and NFV, are transforming the industry, leading to more flexible, scalable, and cost-effective networking solutions. Consumer behavior shifts towards higher network security and reliability are further driving demand for advanced enterprise routers. The forecast period (2025-2033) anticipates continued market expansion, driven by the ongoing digital transformation and the emergence of new technologies like 5G and edge computing. The market is expected to reach xx million units by 2033, with a projected CAGR of xx%. Market penetration is expected to increase from xx% in 2025 to xx% by 2033.
Dominant Regions, Countries, or Segments in Enterprise Routers Industry
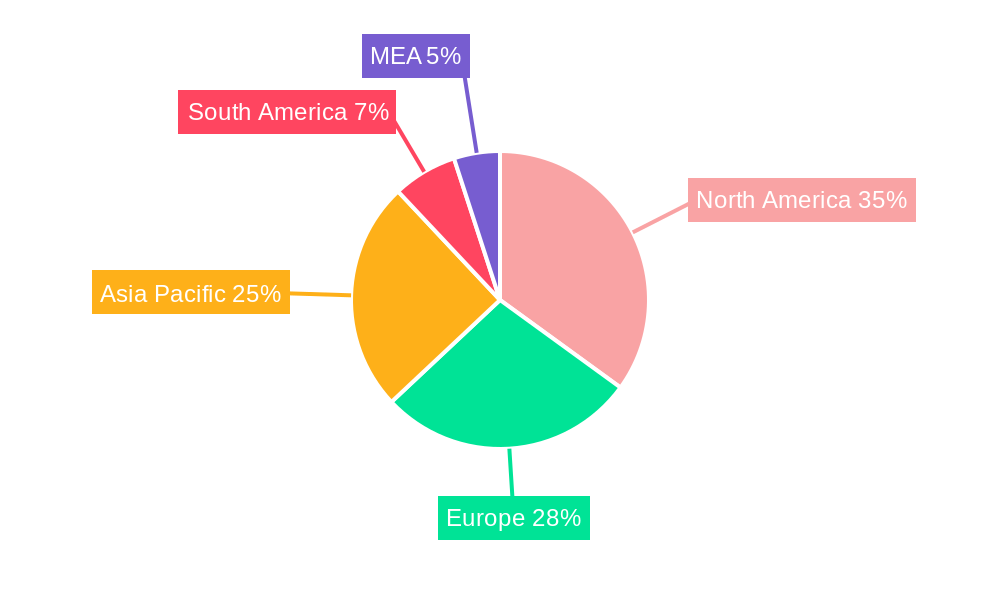
North America and Europe currently dominate the enterprise router market, driven by high technological advancements, robust digital infrastructure, and significant investments in IT and telecommunications. However, the Asia-Pacific region is projected to witness the fastest growth in the forecast period, fueled by increasing investments in infrastructure development and the rising adoption of cloud computing and IoT devices in developing economies. Within segments, the IT & Telecom and BFSI sectors constitute the largest end-user verticals, while Wired connectivity holds a significant majority of the market share, owing to the reliability and security it offers.
- Key Drivers (North America & Europe): Strong IT infrastructure, high digital adoption rates, and supportive government policies.
- Key Drivers (Asia-Pacific): Rapid economic growth, expanding digitalization initiatives, and large-scale infrastructure projects.
- Dominant Segments: IT & Telecom (xx% Market Share), Wired Connectivity (xx% Market Share), Fixed Port Routers (xx% Market Share), Core Routers (xx% Market Share).
- Growth Potential: The Asia-Pacific region shows high growth potential due to increasing digitalization and infrastructural development.
Enterprise Routers Industry Product Landscape
The enterprise router market offers a wide range of products, each catering to specific needs and performance requirements. Recent innovations focus on increased bandwidth capabilities, enhanced security features (e.g., advanced firewall capabilities and intrusion detection systems), improved scalability, and support for emerging technologies like 5G and SDN. Manufacturers are increasingly incorporating intelligent management tools for simplified network configuration and maintenance. Unique selling propositions often involve sophisticated features like Quality of Service (QoS) management, integrated security features, and advanced traffic management capabilities.
Key Drivers, Barriers & Challenges in Enterprise Routers Industry
Key Drivers: The primary drivers include the escalating demand for high-speed internet access, the increasing adoption of cloud computing and IoT, and stringent data security requirements. Government initiatives promoting digital transformation further contribute to market growth.
Key Challenges: Supply chain disruptions, particularly concerning semiconductor components, pose significant challenges. Stringent regulatory compliance requirements, coupled with intense competition from both established and emerging players, add pressure on margins and innovation. The global economic slowdown also negatively impacts market growth. These challenges can result in reduced profit margins (estimated decrease of xx% by 2028) and slower market expansion.
Emerging Opportunities in Enterprise Routers Industry
Emerging opportunities lie in the expansion of 5G networks and the adoption of edge computing. The growing demand for secure and reliable network solutions in critical sectors like healthcare and finance presents significant potential. The development of innovative applications and services built on the enterprise router infrastructure, such as IoT device management platforms and network security solutions, is another key growth area.
Growth Accelerators in the Enterprise Routers Industry
Long-term growth will be fueled by technological advancements, strategic partnerships between router manufacturers and software providers, and expansion into untapped markets, especially in developing economies. Continued investments in research and development are crucial for delivering cutting-edge products and services.
Key Players Shaping the Enterprise Routers Industry Market
- Riverbed Technology Inc
- Hewlett Packard Enterprise Co
- Nokia Networks Corporation
- Cisco Systems Inc
- Juniper Networks Inc
- Avaya Inc
- Dell Inc
- Alcatel-Lucent S A
- Huawei Technologies Co Ltd
- ZTE Corporation
Notable Milestones in Enterprise Routers Industry Sector
- March 2023: Cisco announced patches for a high-severity denial-of-service vulnerability (CVE-2023-20049) affecting its IOS XR software for ASR 9000 routers.
- January 2023: ZTE Corporation launched its 5G flagship CPE MC888 PRO.
In-Depth Enterprise Routers Industry Market Outlook
The future of the enterprise router market is bright, driven by ongoing technological advancements and increased digital transformation across all industries. Strategic opportunities abound in expanding into emerging markets, developing innovative products tailored to specific needs, and forging strong partnerships to enhance product offerings and reach broader customer bases. The long-term outlook suggests robust growth, particularly in regions with underdeveloped digital infrastructure and rapidly expanding economies.
Enterprise Routers Industry Segmentation
-
1. Type of Connectivity
- 1.1. Wired
- 1.2. Wireless
-
2. Type of Port
- 2.1. Fixed Port
- 2.2. Modular
-
3. Type
- 3.1. Core Routers
- 3.2. Multi-Services Edge
- 3.3. Access Router
- 3.4. Other Types
-
4. End-user Vertical
- 4.1. BFSI
- 4.2. IT & Telecom
- 4.3. Healthcare
- 4.4. Retail
- 4.5. Manufacturing
- 4.6. Other End-user Verticals
Enterprise Routers Industry Segmentation By Geography
- 1. North America
- 2. Europe
- 3. Asia
- 4. Australia and New Zealand
- 5. Latin America
Enterprise Routers Industry REPORT HIGHLIGHTS
| Aspects | Details |
|---|---|
| Study Period | 2019-2033 |
| Base Year | 2024 |
| Estimated Year | 2025 |
| Forecast Period | 2025-2033 |
| Historical Period | 2019-2024 |
| Growth Rate | CAGR of 7.49% from 2019-2033 |
| Segmentation |
|
Table of Contents
- 1. Introduction
- 1.1. Research Scope
- 1.2. Market Segmentation
- 1.3. Research Methodology
- 1.4. Definitions and Assumptions
- 2. Executive Summary
- 2.1. Introduction
- 3. Market Dynamics
- 3.1. Introduction
- 3.2. Market Drivers
- 3.2.1. Increasing Network Virtualization; Rapid Growth in IP Traffic Enterprise
- 3.3. Market Restrains
- 3.3.1. Security and Privacy Concerns
- 3.4. Market Trends
- 3.4.1. Wireless Connectivity is Expected to Hold Major Share
- 4. Market Factor Analysis
- 4.1. Porters Five Forces
- 4.2. Supply/Value Chain
- 4.3. PESTEL analysis
- 4.4. Market Entropy
- 4.5. Patent/Trademark Analysis
- 5. Global Enterprise Routers Industry Analysis, Insights and Forecast, 2019-2031
- 5.1. Market Analysis, Insights and Forecast - by Type of Connectivity
- 5.1.1. Wired
- 5.1.2. Wireless
- 5.2. Market Analysis, Insights and Forecast - by Type of Port
- 5.2.1. Fixed Port
- 5.2.2. Modular
- 5.3. Market Analysis, Insights and Forecast - by Type
- 5.3.1. Core Routers
- 5.3.2. Multi-Services Edge
- 5.3.3. Access Router
- 5.3.4. Other Types
- 5.4. Market Analysis, Insights and Forecast - by End-user Vertical
- 5.4.1. BFSI
- 5.4.2. IT & Telecom
- 5.4.3. Healthcare
- 5.4.4. Retail
- 5.4.5. Manufacturing
- 5.4.6. Other End-user Verticals
- 5.5. Market Analysis, Insights and Forecast - by Region
- 5.5.1. North America
- 5.5.2. Europe
- 5.5.3. Asia
- 5.5.4. Australia and New Zealand
- 5.5.5. Latin America
- 5.1. Market Analysis, Insights and Forecast - by Type of Connectivity
- 6. North America Enterprise Routers Industry Analysis, Insights and Forecast, 2019-2031
- 6.1. Market Analysis, Insights and Forecast - by Type of Connectivity
- 6.1.1. Wired
- 6.1.2. Wireless
- 6.2. Market Analysis, Insights and Forecast - by Type of Port
- 6.2.1. Fixed Port
- 6.2.2. Modular
- 6.3. Market Analysis, Insights and Forecast - by Type
- 6.3.1. Core Routers
- 6.3.2. Multi-Services Edge
- 6.3.3. Access Router
- 6.3.4. Other Types
- 6.4. Market Analysis, Insights and Forecast - by End-user Vertical
- 6.4.1. BFSI
- 6.4.2. IT & Telecom
- 6.4.3. Healthcare
- 6.4.4. Retail
- 6.4.5. Manufacturing
- 6.4.6. Other End-user Verticals
- 6.1. Market Analysis, Insights and Forecast - by Type of Connectivity
- 7. Europe Enterprise Routers Industry Analysis, Insights and Forecast, 2019-2031
- 7.1. Market Analysis, Insights and Forecast - by Type of Connectivity
- 7.1.1. Wired
- 7.1.2. Wireless
- 7.2. Market Analysis, Insights and Forecast - by Type of Port
- 7.2.1. Fixed Port
- 7.2.2. Modular
- 7.3. Market Analysis, Insights and Forecast - by Type
- 7.3.1. Core Routers
- 7.3.2. Multi-Services Edge
- 7.3.3. Access Router
- 7.3.4. Other Types
- 7.4. Market Analysis, Insights and Forecast - by End-user Vertical
- 7.4.1. BFSI
- 7.4.2. IT & Telecom
- 7.4.3. Healthcare
- 7.4.4. Retail
- 7.4.5. Manufacturing
- 7.4.6. Other End-user Verticals
- 7.1. Market Analysis, Insights and Forecast - by Type of Connectivity
- 8. Asia Enterprise Routers Industry Analysis, Insights and Forecast, 2019-2031
- 8.1. Market Analysis, Insights and Forecast - by Type of Connectivity
- 8.1.1. Wired
- 8.1.2. Wireless
- 8.2. Market Analysis, Insights and Forecast - by Type of Port
- 8.2.1. Fixed Port
- 8.2.2. Modular
- 8.3. Market Analysis, Insights and Forecast - by Type
- 8.3.1. Core Routers
- 8.3.2. Multi-Services Edge
- 8.3.3. Access Router
- 8.3.4. Other Types
- 8.4. Market Analysis, Insights and Forecast - by End-user Vertical
- 8.4.1. BFSI
- 8.4.2. IT & Telecom
- 8.4.3. Healthcare
- 8.4.4. Retail
- 8.4.5. Manufacturing
- 8.4.6. Other End-user Verticals
- 8.1. Market Analysis, Insights and Forecast - by Type of Connectivity
- 9. Australia and New Zealand Enterprise Routers Industry Analysis, Insights and Forecast, 2019-2031
- 9.1. Market Analysis, Insights and Forecast - by Type of Connectivity
- 9.1.1. Wired
- 9.1.2. Wireless
- 9.2. Market Analysis, Insights and Forecast - by Type of Port
- 9.2.1. Fixed Port
- 9.2.2. Modular
- 9.3. Market Analysis, Insights and Forecast - by Type
- 9.3.1. Core Routers
- 9.3.2. Multi-Services Edge
- 9.3.3. Access Router
- 9.3.4. Other Types
- 9.4. Market Analysis, Insights and Forecast - by End-user Vertical
- 9.4.1. BFSI
- 9.4.2. IT & Telecom
- 9.4.3. Healthcare
- 9.4.4. Retail
- 9.4.5. Manufacturing
- 9.4.6. Other End-user Verticals
- 9.1. Market Analysis, Insights and Forecast - by Type of Connectivity
- 10. Latin America Enterprise Routers Industry Analysis, Insights and Forecast, 2019-2031
- 10.1. Market Analysis, Insights and Forecast - by Type of Connectivity
- 10.1.1. Wired
- 10.1.2. Wireless
- 10.2. Market Analysis, Insights and Forecast - by Type of Port
- 10.2.1. Fixed Port
- 10.2.2. Modular
- 10.3. Market Analysis, Insights and Forecast - by Type
- 10.3.1. Core Routers
- 10.3.2. Multi-Services Edge
- 10.3.3. Access Router
- 10.3.4. Other Types
- 10.4. Market Analysis, Insights and Forecast - by End-user Vertical
- 10.4.1. BFSI
- 10.4.2. IT & Telecom
- 10.4.3. Healthcare
- 10.4.4. Retail
- 10.4.5. Manufacturing
- 10.4.6. Other End-user Verticals
- 10.1. Market Analysis, Insights and Forecast - by Type of Connectivity
- 11. North America Enterprise Routers Industry Analysis, Insights and Forecast, 2019-2031
- 11.1. Market Analysis, Insights and Forecast - By Country/Sub-region
- 11.1.1 United States
- 11.1.2 Canada
- 11.1.3 Mexico
- 12. Europe Enterprise Routers Industry Analysis, Insights and Forecast, 2019-2031
- 12.1. Market Analysis, Insights and Forecast - By Country/Sub-region
- 12.1.1 Germany
- 12.1.2 United Kingdom
- 12.1.3 France
- 12.1.4 Spain
- 12.1.5 Italy
- 12.1.6 Spain
- 12.1.7 Belgium
- 12.1.8 Netherland
- 12.1.9 Nordics
- 12.1.10 Rest of Europe
- 13. Asia Pacific Enterprise Routers Industry Analysis, Insights and Forecast, 2019-2031
- 13.1. Market Analysis, Insights and Forecast - By Country/Sub-region
- 13.1.1 China
- 13.1.2 Japan
- 13.1.3 India
- 13.1.4 South Korea
- 13.1.5 Southeast Asia
- 13.1.6 Australia
- 13.1.7 Indonesia
- 13.1.8 Phillipes
- 13.1.9 Singapore
- 13.1.10 Thailandc
- 13.1.11 Rest of Asia Pacific
- 14. South America Enterprise Routers Industry Analysis, Insights and Forecast, 2019-2031
- 14.1. Market Analysis, Insights and Forecast - By Country/Sub-region
- 14.1.1 Brazil
- 14.1.2 Argentina
- 14.1.3 Peru
- 14.1.4 Chile
- 14.1.5 Colombia
- 14.1.6 Ecuador
- 14.1.7 Venezuela
- 14.1.8 Rest of South America
- 15. North America Enterprise Routers Industry Analysis, Insights and Forecast, 2019-2031
- 15.1. Market Analysis, Insights and Forecast - By Country/Sub-region
- 15.1.1 United States
- 15.1.2 Canada
- 15.1.3 Mexico
- 16. MEA Enterprise Routers Industry Analysis, Insights and Forecast, 2019-2031
- 16.1. Market Analysis, Insights and Forecast - By Country/Sub-region
- 16.1.1 United Arab Emirates
- 16.1.2 Saudi Arabia
- 16.1.3 South Africa
- 16.1.4 Rest of Middle East and Africa
- 17. Competitive Analysis
- 17.1. Global Market Share Analysis 2024
- 17.2. Company Profiles
- 17.2.1 Riverbed Technology Inc
- 17.2.1.1. Overview
- 17.2.1.2. Products
- 17.2.1.3. SWOT Analysis
- 17.2.1.4. Recent Developments
- 17.2.1.5. Financials (Based on Availability)
- 17.2.2 Hewlett Packard Enterprise Co
- 17.2.2.1. Overview
- 17.2.2.2. Products
- 17.2.2.3. SWOT Analysis
- 17.2.2.4. Recent Developments
- 17.2.2.5. Financials (Based on Availability)
- 17.2.3 Nokia Networks Corporation
- 17.2.3.1. Overview
- 17.2.3.2. Products
- 17.2.3.3. SWOT Analysis
- 17.2.3.4. Recent Developments
- 17.2.3.5. Financials (Based on Availability)
- 17.2.4 Cisco Systems Inc
- 17.2.4.1. Overview
- 17.2.4.2. Products
- 17.2.4.3. SWOT Analysis
- 17.2.4.4. Recent Developments
- 17.2.4.5. Financials (Based on Availability)
- 17.2.5 Juniper Networks Inc
- 17.2.5.1. Overview
- 17.2.5.2. Products
- 17.2.5.3. SWOT Analysis
- 17.2.5.4. Recent Developments
- 17.2.5.5. Financials (Based on Availability)
- 17.2.6 Avaya Inc
- 17.2.6.1. Overview
- 17.2.6.2. Products
- 17.2.6.3. SWOT Analysis
- 17.2.6.4. Recent Developments
- 17.2.6.5. Financials (Based on Availability)
- 17.2.7 Dell Inc
- 17.2.7.1. Overview
- 17.2.7.2. Products
- 17.2.7.3. SWOT Analysis
- 17.2.7.4. Recent Developments
- 17.2.7.5. Financials (Based on Availability)
- 17.2.8 Alcatel-Lucent S A
- 17.2.8.1. Overview
- 17.2.8.2. Products
- 17.2.8.3. SWOT Analysis
- 17.2.8.4. Recent Developments
- 17.2.8.5. Financials (Based on Availability)
- 17.2.9 Huawei Technologies Co Ltd
- 17.2.9.1. Overview
- 17.2.9.2. Products
- 17.2.9.3. SWOT Analysis
- 17.2.9.4. Recent Developments
- 17.2.9.5. Financials (Based on Availability)
- 17.2.10 ZTE Corporation
- 17.2.10.1. Overview
- 17.2.10.2. Products
- 17.2.10.3. SWOT Analysis
- 17.2.10.4. Recent Developments
- 17.2.10.5. Financials (Based on Availability)
- 17.2.1 Riverbed Technology Inc
List of Figures
- Figure 1: Global Enterprise Routers Industry Revenue Breakdown (Million, %) by Region 2024 & 2032
- Figure 2: Global Enterprise Routers Industry Volume Breakdown (K Unit, %) by Region 2024 & 2032
- Figure 3: North America Enterprise Routers Industry Revenue (Million), by Country 2024 & 2032
- Figure 4: North America Enterprise Routers Industry Volume (K Unit), by Country 2024 & 2032
- Figure 5: North America Enterprise Routers Industry Revenue Share (%), by Country 2024 & 2032
- Figure 6: North America Enterprise Routers Industry Volume Share (%), by Country 2024 & 2032
- Figure 7: Europe Enterprise Routers Industry Revenue (Million), by Country 2024 & 2032
- Figure 8: Europe Enterprise Routers Industry Volume (K Unit), by Country 2024 & 2032
- Figure 9: Europe Enterprise Routers Industry Revenue Share (%), by Country 2024 & 2032
- Figure 10: Europe Enterprise Routers Industry Volume Share (%), by Country 2024 & 2032
- Figure 11: Asia Pacific Enterprise Routers Industry Revenue (Million), by Country 2024 & 2032
- Figure 12: Asia Pacific Enterprise Routers Industry Volume (K Unit), by Country 2024 & 2032
- Figure 13: Asia Pacific Enterprise Routers Industry Revenue Share (%), by Country 2024 & 2032
- Figure 14: Asia Pacific Enterprise Routers Industry Volume Share (%), by Country 2024 & 2032
- Figure 15: South America Enterprise Routers Industry Revenue (Million), by Country 2024 & 2032
- Figure 16: South America Enterprise Routers Industry Volume (K Unit), by Country 2024 & 2032
- Figure 17: South America Enterprise Routers Industry Revenue Share (%), by Country 2024 & 2032
- Figure 18: South America Enterprise Routers Industry Volume Share (%), by Country 2024 & 2032
- Figure 19: North America Enterprise Routers Industry Revenue (Million), by Country 2024 & 2032
- Figure 20: North America Enterprise Routers Industry Volume (K Unit), by Country 2024 & 2032
- Figure 21: North America Enterprise Routers Industry Revenue Share (%), by Country 2024 & 2032
- Figure 22: North America Enterprise Routers Industry Volume Share (%), by Country 2024 & 2032
- Figure 23: MEA Enterprise Routers Industry Revenue (Million), by Country 2024 & 2032
- Figure 24: MEA Enterprise Routers Industry Volume (K Unit), by Country 2024 & 2032
- Figure 25: MEA Enterprise Routers Industry Revenue Share (%), by Country 2024 & 2032
- Figure 26: MEA Enterprise Routers Industry Volume Share (%), by Country 2024 & 2032
- Figure 27: North America Enterprise Routers Industry Revenue (Million), by Type of Connectivity 2024 & 2032
- Figure 28: North America Enterprise Routers Industry Volume (K Unit), by Type of Connectivity 2024 & 2032
- Figure 29: North America Enterprise Routers Industry Revenue Share (%), by Type of Connectivity 2024 & 2032
- Figure 30: North America Enterprise Routers Industry Volume Share (%), by Type of Connectivity 2024 & 2032
- Figure 31: North America Enterprise Routers Industry Revenue (Million), by Type of Port 2024 & 2032
- Figure 32: North America Enterprise Routers Industry Volume (K Unit), by Type of Port 2024 & 2032
- Figure 33: North America Enterprise Routers Industry Revenue Share (%), by Type of Port 2024 & 2032
- Figure 34: North America Enterprise Routers Industry Volume Share (%), by Type of Port 2024 & 2032
- Figure 35: North America Enterprise Routers Industry Revenue (Million), by Type 2024 & 2032
- Figure 36: North America Enterprise Routers Industry Volume (K Unit), by Type 2024 & 2032
- Figure 37: North America Enterprise Routers Industry Revenue Share (%), by Type 2024 & 2032
- Figure 38: North America Enterprise Routers Industry Volume Share (%), by Type 2024 & 2032
- Figure 39: North America Enterprise Routers Industry Revenue (Million), by End-user Vertical 2024 & 2032
- Figure 40: North America Enterprise Routers Industry Volume (K Unit), by End-user Vertical 2024 & 2032
- Figure 41: North America Enterprise Routers Industry Revenue Share (%), by End-user Vertical 2024 & 2032
- Figure 42: North America Enterprise Routers Industry Volume Share (%), by End-user Vertical 2024 & 2032
- Figure 43: North America Enterprise Routers Industry Revenue (Million), by Country 2024 & 2032
- Figure 44: North America Enterprise Routers Industry Volume (K Unit), by Country 2024 & 2032
- Figure 45: North America Enterprise Routers Industry Revenue Share (%), by Country 2024 & 2032
- Figure 46: North America Enterprise Routers Industry Volume Share (%), by Country 2024 & 2032
- Figure 47: Europe Enterprise Routers Industry Revenue (Million), by Type of Connectivity 2024 & 2032
- Figure 48: Europe Enterprise Routers Industry Volume (K Unit), by Type of Connectivity 2024 & 2032
- Figure 49: Europe Enterprise Routers Industry Revenue Share (%), by Type of Connectivity 2024 & 2032
- Figure 50: Europe Enterprise Routers Industry Volume Share (%), by Type of Connectivity 2024 & 2032
- Figure 51: Europe Enterprise Routers Industry Revenue (Million), by Type of Port 2024 & 2032
- Figure 52: Europe Enterprise Routers Industry Volume (K Unit), by Type of Port 2024 & 2032
- Figure 53: Europe Enterprise Routers Industry Revenue Share (%), by Type of Port 2024 & 2032
- Figure 54: Europe Enterprise Routers Industry Volume Share (%), by Type of Port 2024 & 2032
- Figure 55: Europe Enterprise Routers Industry Revenue (Million), by Type 2024 & 2032
- Figure 56: Europe Enterprise Routers Industry Volume (K Unit), by Type 2024 & 2032
- Figure 57: Europe Enterprise Routers Industry Revenue Share (%), by Type 2024 & 2032
- Figure 58: Europe Enterprise Routers Industry Volume Share (%), by Type 2024 & 2032
- Figure 59: Europe Enterprise Routers Industry Revenue (Million), by End-user Vertical 2024 & 2032
- Figure 60: Europe Enterprise Routers Industry Volume (K Unit), by End-user Vertical 2024 & 2032
- Figure 61: Europe Enterprise Routers Industry Revenue Share (%), by End-user Vertical 2024 & 2032
- Figure 62: Europe Enterprise Routers Industry Volume Share (%), by End-user Vertical 2024 & 2032
- Figure 63: Europe Enterprise Routers Industry Revenue (Million), by Country 2024 & 2032
- Figure 64: Europe Enterprise Routers Industry Volume (K Unit), by Country 2024 & 2032
- Figure 65: Europe Enterprise Routers Industry Revenue Share (%), by Country 2024 & 2032
- Figure 66: Europe Enterprise Routers Industry Volume Share (%), by Country 2024 & 2032
- Figure 67: Asia Enterprise Routers Industry Revenue (Million), by Type of Connectivity 2024 & 2032
- Figure 68: Asia Enterprise Routers Industry Volume (K Unit), by Type of Connectivity 2024 & 2032
- Figure 69: Asia Enterprise Routers Industry Revenue Share (%), by Type of Connectivity 2024 & 2032
- Figure 70: Asia Enterprise Routers Industry Volume Share (%), by Type of Connectivity 2024 & 2032
- Figure 71: Asia Enterprise Routers Industry Revenue (Million), by Type of Port 2024 & 2032
- Figure 72: Asia Enterprise Routers Industry Volume (K Unit), by Type of Port 2024 & 2032
- Figure 73: Asia Enterprise Routers Industry Revenue Share (%), by Type of Port 2024 & 2032
- Figure 74: Asia Enterprise Routers Industry Volume Share (%), by Type of Port 2024 & 2032
- Figure 75: Asia Enterprise Routers Industry Revenue (Million), by Type 2024 & 2032
- Figure 76: Asia Enterprise Routers Industry Volume (K Unit), by Type 2024 & 2032
- Figure 77: Asia Enterprise Routers Industry Revenue Share (%), by Type 2024 & 2032
- Figure 78: Asia Enterprise Routers Industry Volume Share (%), by Type 2024 & 2032
- Figure 79: Asia Enterprise Routers Industry Revenue (Million), by End-user Vertical 2024 & 2032
- Figure 80: Asia Enterprise Routers Industry Volume (K Unit), by End-user Vertical 2024 & 2032
- Figure 81: Asia Enterprise Routers Industry Revenue Share (%), by End-user Vertical 2024 & 2032
- Figure 82: Asia Enterprise Routers Industry Volume Share (%), by End-user Vertical 2024 & 2032
- Figure 83: Asia Enterprise Routers Industry Revenue (Million), by Country 2024 & 2032
- Figure 84: Asia Enterprise Routers Industry Volume (K Unit), by Country 2024 & 2032
- Figure 85: Asia Enterprise Routers Industry Revenue Share (%), by Country 2024 & 2032
- Figure 86: Asia Enterprise Routers Industry Volume Share (%), by Country 2024 & 2032
- Figure 87: Australia and New Zealand Enterprise Routers Industry Revenue (Million), by Type of Connectivity 2024 & 2032
- Figure 88: Australia and New Zealand Enterprise Routers Industry Volume (K Unit), by Type of Connectivity 2024 & 2032
- Figure 89: Australia and New Zealand Enterprise Routers Industry Revenue Share (%), by Type of Connectivity 2024 & 2032
- Figure 90: Australia and New Zealand Enterprise Routers Industry Volume Share (%), by Type of Connectivity 2024 & 2032
- Figure 91: Australia and New Zealand Enterprise Routers Industry Revenue (Million), by Type of Port 2024 & 2032
- Figure 92: Australia and New Zealand Enterprise Routers Industry Volume (K Unit), by Type of Port 2024 & 2032
- Figure 93: Australia and New Zealand Enterprise Routers Industry Revenue Share (%), by Type of Port 2024 & 2032
- Figure 94: Australia and New Zealand Enterprise Routers Industry Volume Share (%), by Type of Port 2024 & 2032
- Figure 95: Australia and New Zealand Enterprise Routers Industry Revenue (Million), by Type 2024 & 2032
- Figure 96: Australia and New Zealand Enterprise Routers Industry Volume (K Unit), by Type 2024 & 2032
- Figure 97: Australia and New Zealand Enterprise Routers Industry Revenue Share (%), by Type 2024 & 2032
- Figure 98: Australia and New Zealand Enterprise Routers Industry Volume Share (%), by Type 2024 & 2032
- Figure 99: Australia and New Zealand Enterprise Routers Industry Revenue (Million), by End-user Vertical 2024 & 2032
- Figure 100: Australia and New Zealand Enterprise Routers Industry Volume (K Unit), by End-user Vertical 2024 & 2032
- Figure 101: Australia and New Zealand Enterprise Routers Industry Revenue Share (%), by End-user Vertical 2024 & 2032
- Figure 102: Australia and New Zealand Enterprise Routers Industry Volume Share (%), by End-user Vertical 2024 & 2032
- Figure 103: Australia and New Zealand Enterprise Routers Industry Revenue (Million), by Country 2024 & 2032
- Figure 104: Australia and New Zealand Enterprise Routers Industry Volume (K Unit), by Country 2024 & 2032
- Figure 105: Australia and New Zealand Enterprise Routers Industry Revenue Share (%), by Country 2024 & 2032
- Figure 106: Australia and New Zealand Enterprise Routers Industry Volume Share (%), by Country 2024 & 2032
- Figure 107: Latin America Enterprise Routers Industry Revenue (Million), by Type of Connectivity 2024 & 2032
- Figure 108: Latin America Enterprise Routers Industry Volume (K Unit), by Type of Connectivity 2024 & 2032
- Figure 109: Latin America Enterprise Routers Industry Revenue Share (%), by Type of Connectivity 2024 & 2032
- Figure 110: Latin America Enterprise Routers Industry Volume Share (%), by Type of Connectivity 2024 & 2032
- Figure 111: Latin America Enterprise Routers Industry Revenue (Million), by Type of Port 2024 & 2032
- Figure 112: Latin America Enterprise Routers Industry Volume (K Unit), by Type of Port 2024 & 2032
- Figure 113: Latin America Enterprise Routers Industry Revenue Share (%), by Type of Port 2024 & 2032
- Figure 114: Latin America Enterprise Routers Industry Volume Share (%), by Type of Port 2024 & 2032
- Figure 115: Latin America Enterprise Routers Industry Revenue (Million), by Type 2024 & 2032
- Figure 116: Latin America Enterprise Routers Industry Volume (K Unit), by Type 2024 & 2032
- Figure 117: Latin America Enterprise Routers Industry Revenue Share (%), by Type 2024 & 2032
- Figure 118: Latin America Enterprise Routers Industry Volume Share (%), by Type 2024 & 2032
- Figure 119: Latin America Enterprise Routers Industry Revenue (Million), by End-user Vertical 2024 & 2032
- Figure 120: Latin America Enterprise Routers Industry Volume (K Unit), by End-user Vertical 2024 & 2032
- Figure 121: Latin America Enterprise Routers Industry Revenue Share (%), by End-user Vertical 2024 & 2032
- Figure 122: Latin America Enterprise Routers Industry Volume Share (%), by End-user Vertical 2024 & 2032
- Figure 123: Latin America Enterprise Routers Industry Revenue (Million), by Country 2024 & 2032
- Figure 124: Latin America Enterprise Routers Industry Volume (K Unit), by Country 2024 & 2032
- Figure 125: Latin America Enterprise Routers Industry Revenue Share (%), by Country 2024 & 2032
- Figure 126: Latin America Enterprise Routers Industry Volume Share (%), by Country 2024 & 2032
List of Tables
- Table 1: Global Enterprise Routers Industry Revenue Million Forecast, by Region 2019 & 2032
- Table 2: Global Enterprise Routers Industry Volume K Unit Forecast, by Region 2019 & 2032
- Table 3: Global Enterprise Routers Industry Revenue Million Forecast, by Type of Connectivity 2019 & 2032
- Table 4: Global Enterprise Routers Industry Volume K Unit Forecast, by Type of Connectivity 2019 & 2032
- Table 5: Global Enterprise Routers Industry Revenue Million Forecast, by Type of Port 2019 & 2032
- Table 6: Global Enterprise Routers Industry Volume K Unit Forecast, by Type of Port 2019 & 2032
- Table 7: Global Enterprise Routers Industry Revenue Million Forecast, by Type 2019 & 2032
- Table 8: Global Enterprise Routers Industry Volume K Unit Forecast, by Type 2019 & 2032
- Table 9: Global Enterprise Routers Industry Revenue Million Forecast, by End-user Vertical 2019 & 2032
- Table 10: Global Enterprise Routers Industry Volume K Unit Forecast, by End-user Vertical 2019 & 2032
- Table 11: Global Enterprise Routers Industry Revenue Million Forecast, by Region 2019 & 2032
- Table 12: Global Enterprise Routers Industry Volume K Unit Forecast, by Region 2019 & 2032
- Table 13: Global Enterprise Routers Industry Revenue Million Forecast, by Country 2019 & 2032
- Table 14: Global Enterprise Routers Industry Volume K Unit Forecast, by Country 2019 & 2032
- Table 15: United States Enterprise Routers Industry Revenue (Million) Forecast, by Application 2019 & 2032
- Table 16: United States Enterprise Routers Industry Volume (K Unit) Forecast, by Application 2019 & 2032
- Table 17: Canada Enterprise Routers Industry Revenue (Million) Forecast, by Application 2019 & 2032
- Table 18: Canada Enterprise Routers Industry Volume (K Unit) Forecast, by Application 2019 & 2032
- Table 19: Mexico Enterprise Routers Industry Revenue (Million) Forecast, by Application 2019 & 2032
- Table 20: Mexico Enterprise Routers Industry Volume (K Unit) Forecast, by Application 2019 & 2032
- Table 21: Global Enterprise Routers Industry Revenue Million Forecast, by Country 2019 & 2032
- Table 22: Global Enterprise Routers Industry Volume K Unit Forecast, by Country 2019 & 2032
- Table 23: Germany Enterprise Routers Industry Revenue (Million) Forecast, by Application 2019 & 2032
- Table 24: Germany Enterprise Routers Industry Volume (K Unit) Forecast, by Application 2019 & 2032
- Table 25: United Kingdom Enterprise Routers Industry Revenue (Million) Forecast, by Application 2019 & 2032
- Table 26: United Kingdom Enterprise Routers Industry Volume (K Unit) Forecast, by Application 2019 & 2032
- Table 27: France Enterprise Routers Industry Revenue (Million) Forecast, by Application 2019 & 2032
- Table 28: France Enterprise Routers Industry Volume (K Unit) Forecast, by Application 2019 & 2032
- Table 29: Spain Enterprise Routers Industry Revenue (Million) Forecast, by Application 2019 & 2032
- Table 30: Spain Enterprise Routers Industry Volume (K Unit) Forecast, by Application 2019 & 2032
- Table 31: Italy Enterprise Routers Industry Revenue (Million) Forecast, by Application 2019 & 2032
- Table 32: Italy Enterprise Routers Industry Volume (K Unit) Forecast, by Application 2019 & 2032
- Table 33: Spain Enterprise Routers Industry Revenue (Million) Forecast, by Application 2019 & 2032
- Table 34: Spain Enterprise Routers Industry Volume (K Unit) Forecast, by Application 2019 & 2032
- Table 35: Belgium Enterprise Routers Industry Revenue (Million) Forecast, by Application 2019 & 2032
- Table 36: Belgium Enterprise Routers Industry Volume (K Unit) Forecast, by Application 2019 & 2032
- Table 37: Netherland Enterprise Routers Industry Revenue (Million) Forecast, by Application 2019 & 2032
- Table 38: Netherland Enterprise Routers Industry Volume (K Unit) Forecast, by Application 2019 & 2032
- Table 39: Nordics Enterprise Routers Industry Revenue (Million) Forecast, by Application 2019 & 2032
- Table 40: Nordics Enterprise Routers Industry Volume (K Unit) Forecast, by Application 2019 & 2032
- Table 41: Rest of Europe Enterprise Routers Industry Revenue (Million) Forecast, by Application 2019 & 2032
- Table 42: Rest of Europe Enterprise Routers Industry Volume (K Unit) Forecast, by Application 2019 & 2032
- Table 43: Global Enterprise Routers Industry Revenue Million Forecast, by Country 2019 & 2032
- Table 44: Global Enterprise Routers Industry Volume K Unit Forecast, by Country 2019 & 2032
- Table 45: China Enterprise Routers Industry Revenue (Million) Forecast, by Application 2019 & 2032
- Table 46: China Enterprise Routers Industry Volume (K Unit) Forecast, by Application 2019 & 2032
- Table 47: Japan Enterprise Routers Industry Revenue (Million) Forecast, by Application 2019 & 2032
- Table 48: Japan Enterprise Routers Industry Volume (K Unit) Forecast, by Application 2019 & 2032
- Table 49: India Enterprise Routers Industry Revenue (Million) Forecast, by Application 2019 & 2032
- Table 50: India Enterprise Routers Industry Volume (K Unit) Forecast, by Application 2019 & 2032
- Table 51: South Korea Enterprise Routers Industry Revenue (Million) Forecast, by Application 2019 & 2032
- Table 52: South Korea Enterprise Routers Industry Volume (K Unit) Forecast, by Application 2019 & 2032
- Table 53: Southeast Asia Enterprise Routers Industry Revenue (Million) Forecast, by Application 2019 & 2032
- Table 54: Southeast Asia Enterprise Routers Industry Volume (K Unit) Forecast, by Application 2019 & 2032
- Table 55: Australia Enterprise Routers Industry Revenue (Million) Forecast, by Application 2019 & 2032
- Table 56: Australia Enterprise Routers Industry Volume (K Unit) Forecast, by Application 2019 & 2032
- Table 57: Indonesia Enterprise Routers Industry Revenue (Million) Forecast, by Application 2019 & 2032
- Table 58: Indonesia Enterprise Routers Industry Volume (K Unit) Forecast, by Application 2019 & 2032
- Table 59: Phillipes Enterprise Routers Industry Revenue (Million) Forecast, by Application 2019 & 2032
- Table 60: Phillipes Enterprise Routers Industry Volume (K Unit) Forecast, by Application 2019 & 2032
- Table 61: Singapore Enterprise Routers Industry Revenue (Million) Forecast, by Application 2019 & 2032
- Table 62: Singapore Enterprise Routers Industry Volume (K Unit) Forecast, by Application 2019 & 2032
- Table 63: Thailandc Enterprise Routers Industry Revenue (Million) Forecast, by Application 2019 & 2032
- Table 64: Thailandc Enterprise Routers Industry Volume (K Unit) Forecast, by Application 2019 & 2032
- Table 65: Rest of Asia Pacific Enterprise Routers Industry Revenue (Million) Forecast, by Application 2019 & 2032
- Table 66: Rest of Asia Pacific Enterprise Routers Industry Volume (K Unit) Forecast, by Application 2019 & 2032
- Table 67: Global Enterprise Routers Industry Revenue Million Forecast, by Country 2019 & 2032
- Table 68: Global Enterprise Routers Industry Volume K Unit Forecast, by Country 2019 & 2032
- Table 69: Brazil Enterprise Routers Industry Revenue (Million) Forecast, by Application 2019 & 2032
- Table 70: Brazil Enterprise Routers Industry Volume (K Unit) Forecast, by Application 2019 & 2032
- Table 71: Argentina Enterprise Routers Industry Revenue (Million) Forecast, by Application 2019 & 2032
- Table 72: Argentina Enterprise Routers Industry Volume (K Unit) Forecast, by Application 2019 & 2032
- Table 73: Peru Enterprise Routers Industry Revenue (Million) Forecast, by Application 2019 & 2032
- Table 74: Peru Enterprise Routers Industry Volume (K Unit) Forecast, by Application 2019 & 2032
- Table 75: Chile Enterprise Routers Industry Revenue (Million) Forecast, by Application 2019 & 2032
- Table 76: Chile Enterprise Routers Industry Volume (K Unit) Forecast, by Application 2019 & 2032
- Table 77: Colombia Enterprise Routers Industry Revenue (Million) Forecast, by Application 2019 & 2032
- Table 78: Colombia Enterprise Routers Industry Volume (K Unit) Forecast, by Application 2019 & 2032
- Table 79: Ecuador Enterprise Routers Industry Revenue (Million) Forecast, by Application 2019 & 2032
- Table 80: Ecuador Enterprise Routers Industry Volume (K Unit) Forecast, by Application 2019 & 2032
- Table 81: Venezuela Enterprise Routers Industry Revenue (Million) Forecast, by Application 2019 & 2032
- Table 82: Venezuela Enterprise Routers Industry Volume (K Unit) Forecast, by Application 2019 & 2032
- Table 83: Rest of South America Enterprise Routers Industry Revenue (Million) Forecast, by Application 2019 & 2032
- Table 84: Rest of South America Enterprise Routers Industry Volume (K Unit) Forecast, by Application 2019 & 2032
- Table 85: Global Enterprise Routers Industry Revenue Million Forecast, by Country 2019 & 2032
- Table 86: Global Enterprise Routers Industry Volume K Unit Forecast, by Country 2019 & 2032
- Table 87: United States Enterprise Routers Industry Revenue (Million) Forecast, by Application 2019 & 2032
- Table 88: United States Enterprise Routers Industry Volume (K Unit) Forecast, by Application 2019 & 2032
- Table 89: Canada Enterprise Routers Industry Revenue (Million) Forecast, by Application 2019 & 2032
- Table 90: Canada Enterprise Routers Industry Volume (K Unit) Forecast, by Application 2019 & 2032
- Table 91: Mexico Enterprise Routers Industry Revenue (Million) Forecast, by Application 2019 & 2032
- Table 92: Mexico Enterprise Routers Industry Volume (K Unit) Forecast, by Application 2019 & 2032
- Table 93: Global Enterprise Routers Industry Revenue Million Forecast, by Country 2019 & 2032
- Table 94: Global Enterprise Routers Industry Volume K Unit Forecast, by Country 2019 & 2032
- Table 95: United Arab Emirates Enterprise Routers Industry Revenue (Million) Forecast, by Application 2019 & 2032
- Table 96: United Arab Emirates Enterprise Routers Industry Volume (K Unit) Forecast, by Application 2019 & 2032
- Table 97: Saudi Arabia Enterprise Routers Industry Revenue (Million) Forecast, by Application 2019 & 2032
- Table 98: Saudi Arabia Enterprise Routers Industry Volume (K Unit) Forecast, by Application 2019 & 2032
- Table 99: South Africa Enterprise Routers Industry Revenue (Million) Forecast, by Application 2019 & 2032
- Table 100: South Africa Enterprise Routers Industry Volume (K Unit) Forecast, by Application 2019 & 2032
- Table 101: Rest of Middle East and Africa Enterprise Routers Industry Revenue (Million) Forecast, by Application 2019 & 2032
- Table 102: Rest of Middle East and Africa Enterprise Routers Industry Volume (K Unit) Forecast, by Application 2019 & 2032
- Table 103: Global Enterprise Routers Industry Revenue Million Forecast, by Type of Connectivity 2019 & 2032
- Table 104: Global Enterprise Routers Industry Volume K Unit Forecast, by Type of Connectivity 2019 & 2032
- Table 105: Global Enterprise Routers Industry Revenue Million Forecast, by Type of Port 2019 & 2032
- Table 106: Global Enterprise Routers Industry Volume K Unit Forecast, by Type of Port 2019 & 2032
- Table 107: Global Enterprise Routers Industry Revenue Million Forecast, by Type 2019 & 2032
- Table 108: Global Enterprise Routers Industry Volume K Unit Forecast, by Type 2019 & 2032
- Table 109: Global Enterprise Routers Industry Revenue Million Forecast, by End-user Vertical 2019 & 2032
- Table 110: Global Enterprise Routers Industry Volume K Unit Forecast, by End-user Vertical 2019 & 2032
- Table 111: Global Enterprise Routers Industry Revenue Million Forecast, by Country 2019 & 2032
- Table 112: Global Enterprise Routers Industry Volume K Unit Forecast, by Country 2019 & 2032
- Table 113: Global Enterprise Routers Industry Revenue Million Forecast, by Type of Connectivity 2019 & 2032
- Table 114: Global Enterprise Routers Industry Volume K Unit Forecast, by Type of Connectivity 2019 & 2032
- Table 115: Global Enterprise Routers Industry Revenue Million Forecast, by Type of Port 2019 & 2032
- Table 116: Global Enterprise Routers Industry Volume K Unit Forecast, by Type of Port 2019 & 2032
- Table 117: Global Enterprise Routers Industry Revenue Million Forecast, by Type 2019 & 2032
- Table 118: Global Enterprise Routers Industry Volume K Unit Forecast, by Type 2019 & 2032
- Table 119: Global Enterprise Routers Industry Revenue Million Forecast, by End-user Vertical 2019 & 2032
- Table 120: Global Enterprise Routers Industry Volume K Unit Forecast, by End-user Vertical 2019 & 2032
- Table 121: Global Enterprise Routers Industry Revenue Million Forecast, by Country 2019 & 2032
- Table 122: Global Enterprise Routers Industry Volume K Unit Forecast, by Country 2019 & 2032
- Table 123: Global Enterprise Routers Industry Revenue Million Forecast, by Type of Connectivity 2019 & 2032
- Table 124: Global Enterprise Routers Industry Volume K Unit Forecast, by Type of Connectivity 2019 & 2032
- Table 125: Global Enterprise Routers Industry Revenue Million Forecast, by Type of Port 2019 & 2032
- Table 126: Global Enterprise Routers Industry Volume K Unit Forecast, by Type of Port 2019 & 2032
- Table 127: Global Enterprise Routers Industry Revenue Million Forecast, by Type 2019 & 2032
- Table 128: Global Enterprise Routers Industry Volume K Unit Forecast, by Type 2019 & 2032
- Table 129: Global Enterprise Routers Industry Revenue Million Forecast, by End-user Vertical 2019 & 2032
- Table 130: Global Enterprise Routers Industry Volume K Unit Forecast, by End-user Vertical 2019 & 2032
- Table 131: Global Enterprise Routers Industry Revenue Million Forecast, by Country 2019 & 2032
- Table 132: Global Enterprise Routers Industry Volume K Unit Forecast, by Country 2019 & 2032
- Table 133: Global Enterprise Routers Industry Revenue Million Forecast, by Type of Connectivity 2019 & 2032
- Table 134: Global Enterprise Routers Industry Volume K Unit Forecast, by Type of Connectivity 2019 & 2032
- Table 135: Global Enterprise Routers Industry Revenue Million Forecast, by Type of Port 2019 & 2032
- Table 136: Global Enterprise Routers Industry Volume K Unit Forecast, by Type of Port 2019 & 2032
- Table 137: Global Enterprise Routers Industry Revenue Million Forecast, by Type 2019 & 2032
- Table 138: Global Enterprise Routers Industry Volume K Unit Forecast, by Type 2019 & 2032
- Table 139: Global Enterprise Routers Industry Revenue Million Forecast, by End-user Vertical 2019 & 2032
- Table 140: Global Enterprise Routers Industry Volume K Unit Forecast, by End-user Vertical 2019 & 2032
- Table 141: Global Enterprise Routers Industry Revenue Million Forecast, by Country 2019 & 2032
- Table 142: Global Enterprise Routers Industry Volume K Unit Forecast, by Country 2019 & 2032
- Table 143: Global Enterprise Routers Industry Revenue Million Forecast, by Type of Connectivity 2019 & 2032
- Table 144: Global Enterprise Routers Industry Volume K Unit Forecast, by Type of Connectivity 2019 & 2032
- Table 145: Global Enterprise Routers Industry Revenue Million Forecast, by Type of Port 2019 & 2032
- Table 146: Global Enterprise Routers Industry Volume K Unit Forecast, by Type of Port 2019 & 2032
- Table 147: Global Enterprise Routers Industry Revenue Million Forecast, by Type 2019 & 2032
- Table 148: Global Enterprise Routers Industry Volume K Unit Forecast, by Type 2019 & 2032
- Table 149: Global Enterprise Routers Industry Revenue Million Forecast, by End-user Vertical 2019 & 2032
- Table 150: Global Enterprise Routers Industry Volume K Unit Forecast, by End-user Vertical 2019 & 2032
- Table 151: Global Enterprise Routers Industry Revenue Million Forecast, by Country 2019 & 2032
- Table 152: Global Enterprise Routers Industry Volume K Unit Forecast, by Country 2019 & 2032
Frequently Asked Questions
1. What is the projected Compound Annual Growth Rate (CAGR) of the Enterprise Routers Industry?
The projected CAGR is approximately 7.49%.
2. Which companies are prominent players in the Enterprise Routers Industry?
Key companies in the market include Riverbed Technology Inc, Hewlett Packard Enterprise Co, Nokia Networks Corporation, Cisco Systems Inc, Juniper Networks Inc, Avaya Inc, Dell Inc, Alcatel-Lucent S A, Huawei Technologies Co Ltd, ZTE Corporation.
3. What are the main segments of the Enterprise Routers Industry?
The market segments include Type of Connectivity, Type of Port, Type, End-user Vertical.
4. Can you provide details about the market size?
The market size is estimated to be USD 16.94 Million as of 2022.
5. What are some drivers contributing to market growth?
Increasing Network Virtualization; Rapid Growth in IP Traffic Enterprise.
6. What are the notable trends driving market growth?
Wireless Connectivity is Expected to Hold Major Share.
7. Are there any restraints impacting market growth?
Security and Privacy Concerns.
8. Can you provide examples of recent developments in the market?
March 2023 - Cisco announced patches for a high-severity denial-of-service The IOS XR software for ASR 9000 routers, ASR 9902 and ASR 9903 Enterprise is affected by this vulnerability. Tracked as CVE-2023-20049 and, the vulnerability impacts the platform's bidirectional forwarding detection (BFD) hardware offload feature and can be exploited remotely without authentication. malformed BFD packets are not handled correctly on vulnerable devices with the hardware offloading feature enabled, allowing attackers to send malicious IPv4BFDs for an IP address that has been configured and trigger this flaw.
9. What pricing options are available for accessing the report?
Pricing options include single-user, multi-user, and enterprise licenses priced at USD 4750, USD 5250, and USD 8750 respectively.
10. Is the market size provided in terms of value or volume?
The market size is provided in terms of value, measured in Million and volume, measured in K Unit.
11. Are there any specific market keywords associated with the report?
Yes, the market keyword associated with the report is "Enterprise Routers Industry," which aids in identifying and referencing the specific market segment covered.
12. How do I determine which pricing option suits my needs best?
The pricing options vary based on user requirements and access needs. Individual users may opt for single-user licenses, while businesses requiring broader access may choose multi-user or enterprise licenses for cost-effective access to the report.
13. Are there any additional resources or data provided in the Enterprise Routers Industry report?
While the report offers comprehensive insights, it's advisable to review the specific contents or supplementary materials provided to ascertain if additional resources or data are available.
14. How can I stay updated on further developments or reports in the Enterprise Routers Industry?
To stay informed about further developments, trends, and reports in the Enterprise Routers Industry, consider subscribing to industry newsletters, following relevant companies and organizations, or regularly checking reputable industry news sources and publications.
Methodology
Step 1 - Identification of Relevant Samples Size from Population Database


Step 2 - Approaches for Defining Global Market Size (Value, Volume* & Price*)

Note*: In applicable scenarios
Step 3 - Data Sources
Primary Research
- Web Analytics
- Survey Reports
- Research Institute
- Latest Research Reports
- Opinion Leaders
Secondary Research
- Annual Reports
- White Paper
- Latest Press Release
- Industry Association
- Paid Database
- Investor Presentations

Step 4 - Data Triangulation
Involves using different sources of information in order to increase the validity of a study
These sources are likely to be stakeholders in a program - participants, other researchers, program staff, other community members, and so on.
Then we put all data in single framework & apply various statistical tools to find out the dynamic on the market.
During the analysis stage, feedback from the stakeholder groups would be compared to determine areas of agreement as well as areas of divergence


