
Key Insights
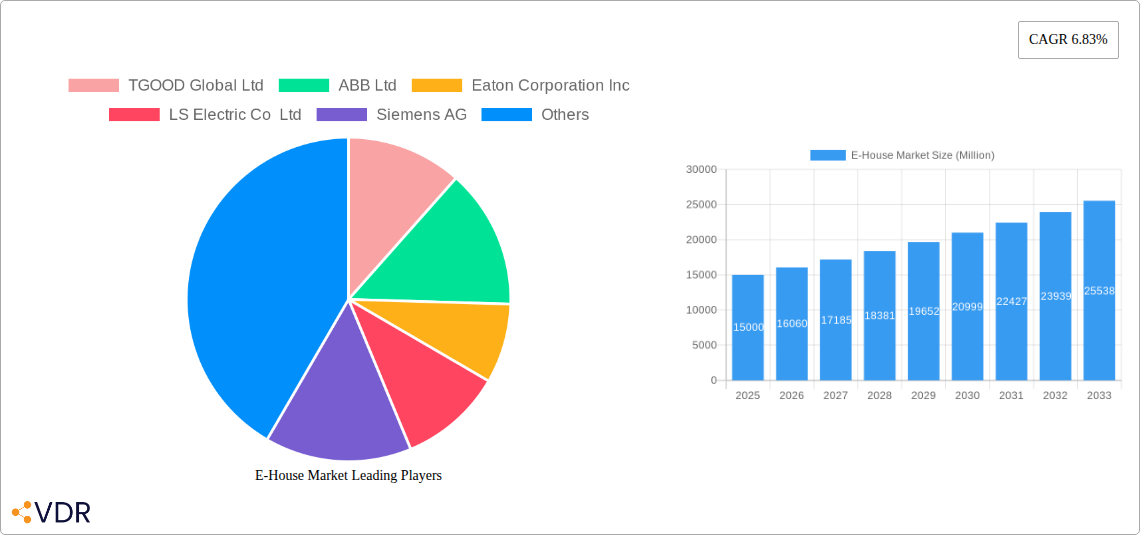
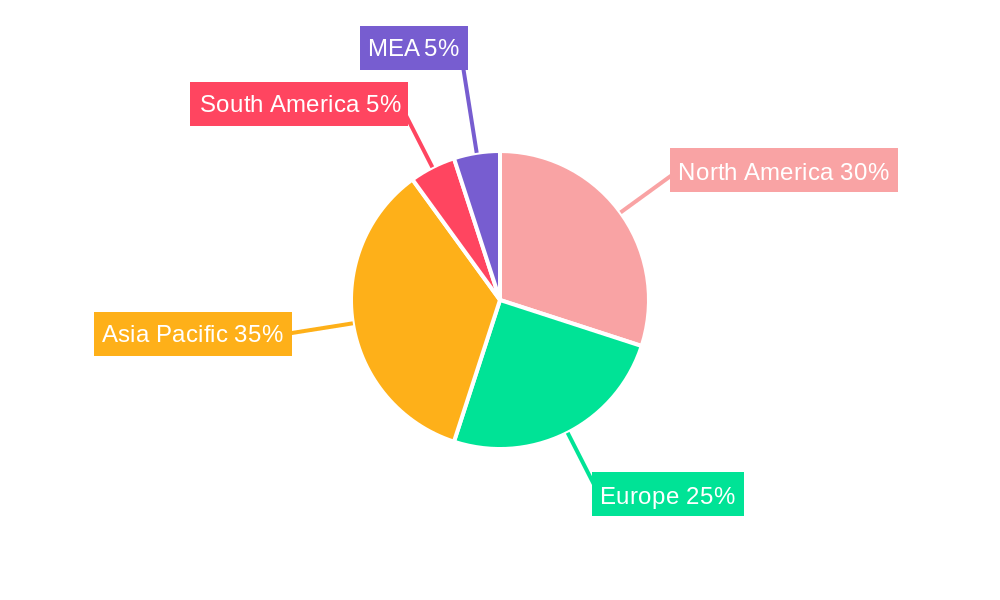
The global E-House market is experiencing robust growth, projected to reach a substantial size driven by increasing demand for reliable and efficient power distribution solutions across diverse sectors. The market's Compound Annual Growth Rate (CAGR) of 6.83% from 2019 to 2024 indicates a consistently expanding market, fueled by several key factors. The rising adoption of renewable energy sources necessitates efficient power management systems, increasing the demand for E-Houses in utility applications. Furthermore, the industrial sector's ongoing automation and expansion, particularly in manufacturing and data centers, contribute significantly to this growth. The preference for prefabricated and modular E-House solutions, offering faster deployment and reduced on-site construction time, is another significant driver. Technological advancements, such as smart grid integration and improved safety features, are also influencing market expansion. The market is segmented by application (utilities, industrial) and type (fixed E-House, mobile substation), with utilities and fixed E-Houses currently holding larger market shares. However, the increasing demand for flexible and portable solutions in temporary installations and disaster relief efforts is likely to propel the growth of mobile substations in the coming years. Major players like ABB, Eaton, Siemens, and Schneider Electric are actively shaping the market landscape through technological innovation and strategic partnerships. Geographical growth is anticipated across all regions, with North America and Asia Pacific expected to lead in terms of market share due to their advanced infrastructure and significant industrial investments. However, emerging economies in regions like the MEA and South America are poised for substantial growth as their infrastructure develops and energy demands increase.
The competitive landscape is marked by a mix of established players and specialized regional companies. The presence of global giants ensures technological advancements and competitive pricing, while smaller, specialized companies cater to niche market segments. Potential restraints on market growth include fluctuating raw material prices, stringent regulatory compliance requirements, and concerns regarding cybersecurity for smart E-Houses. Nevertheless, the overall market outlook remains positive, with continuous innovation and increasing demand across various sectors expected to sustain its growth trajectory well into the forecast period (2025-2033). Addressing challenges related to cost-effectiveness and safety standards will be critical for companies to maintain their market position and attract new customers.
E-House Market: A Comprehensive Report (2019-2033)
This in-depth report provides a comprehensive analysis of the E-House market, encompassing market dynamics, growth trends, regional dominance, product landscape, key players, and future outlook. The study period covers 2019-2033, with a base year of 2025 and a forecast period of 2025-2033. The report utilizes data from the historical period (2019-2024) and leverages extensive research to deliver actionable insights for industry professionals. The report covers both parent (power distribution systems) and child markets (E-House systems). Market values are presented in Million units.
E-House Market Market Dynamics & Structure
The E-House market is characterized by moderate concentration, with key players such as TGOOD Global Ltd, ABB Ltd, Eaton Corporation Inc, LS Electric Co Ltd, Siemens AG, Schneider Electric SE, Powell Industries Inc, Aktif Group, Electroinnova S L, and Unit Electrical Engineering Ltd holding significant market share. The market is driven by technological innovations in power electronics and automation, stringent regulatory frameworks promoting energy efficiency, and the increasing demand for reliable power solutions across various sectors. However, high initial investment costs and the availability of substitute technologies pose challenges. M&A activity has been moderate in the recent past, with approximately xx deals recorded between 2019 and 2024, leading to a consolidation of xx% market share amongst the top 5 players by 2025.
- Market Concentration: Moderately concentrated, with top 5 players holding xx% market share in 2025.
- Technological Innovation: Significant advancements in power electronics, smart grid technologies, and digitalization drive market growth.
- Regulatory Framework: Stringent environmental regulations and energy efficiency standards fuel demand.
- Competitive Substitutes: Traditional substation designs pose competitive pressure, albeit gradually diminishing.
- End-User Demographics: Utilities, industrial sectors, and data centers are key end-users.
- M&A Trends: Moderate M&A activity observed, leading to increased market consolidation.
E-House Market Growth Trends & Insights
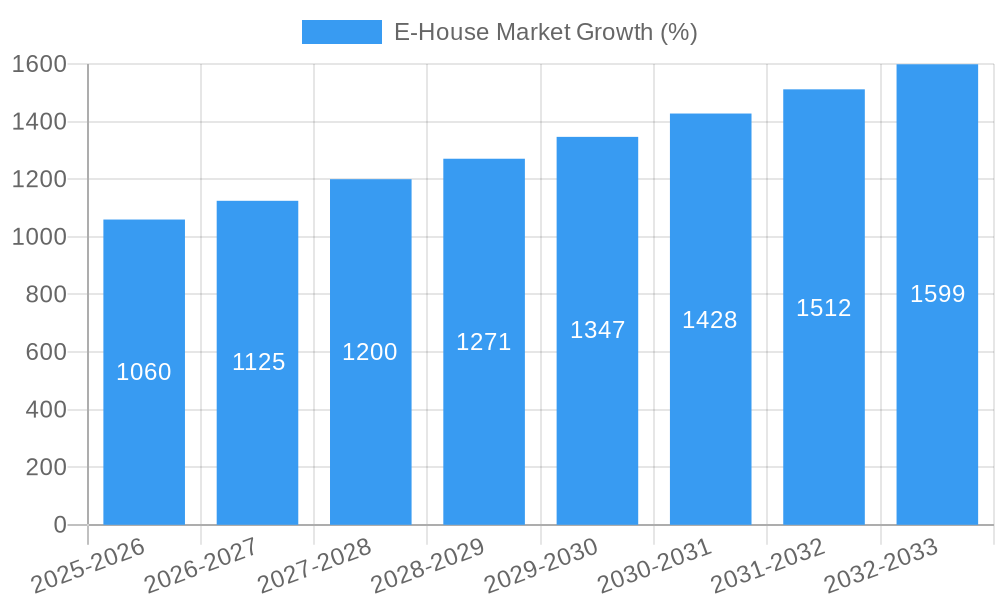
The E-House market is projected to witness robust growth during the forecast period (2025-2033), driven by rising energy demands across the globe. Market size is expected to reach xx Million units by 2033, exhibiting a CAGR of xx% from 2025 to 2033. This growth is attributed to the increasing adoption of E-Houses in diverse applications, including renewable energy integration and smart city initiatives. Technological disruptions, such as the integration of AI and IoT, further propel market expansion. Consumer behavior shifts toward increased reliance on reliable and efficient power solutions fuel market demand. The adoption rate is expected to reach xx% by 2033, with the industrial sector showing the highest penetration rate.
Dominant Regions, Countries, or Segments in E-House Market
The North American region is currently the leading market for E-Houses, driven by robust infrastructure development and increasing investments in renewable energy projects. Within this region, the United States holds the largest market share. The Industrial application segment exhibits the highest growth potential, fueled by the increasing automation and digitization of industrial processes. The Fixed E-House type dominates the market due to its stability and cost-effectiveness, but Mobile Substations are witnessing significant growth due to their flexibility and adaptability for diverse applications.
- Key Drivers:
- Strong infrastructure development and investment in renewable energy (North America).
- Industrial automation and digitization driving high demand (Industrial Segment).
- Ease of installation and cost-effectiveness (Fixed E-House).
- Flexibility and adaptability for various applications (Mobile Substations).
- Dominance Factors: High infrastructure investment, stringent regulatory norms, and a strong industrial base.
E-House Market Product Landscape
E-House systems are evolving from basic power distribution units to sophisticated, intelligent structures incorporating advanced monitoring and control systems. Key product innovations include compact designs, enhanced safety features, improved energy efficiency, and integrated renewable energy sources. These advancements offer superior performance metrics, such as reduced installation time, improved reliability, and lower operational costs. Unique selling propositions include remote monitoring capabilities, predictive maintenance functionality, and seamless integration with smart grid infrastructure.
Key Drivers, Barriers & Challenges in E-House Market
Key Drivers: The increasing demand for reliable power supply in diverse industries, stringent regulations for environmental compliance, and advancements in smart grid technologies are major growth drivers. Government initiatives promoting renewable energy integration and the rising adoption of industrial automation contribute to market expansion.
Key Challenges: High initial investment costs, complex installation processes, and the availability of substitute technologies pose challenges. Supply chain disruptions can lead to material shortages and increased production costs. Furthermore, stringent regulatory approvals and competitive pressures from established players can hinder market growth.
Emerging Opportunities in E-House Market
Untapped markets in developing economies, particularly in Asia and Africa, present significant growth opportunities. The integration of E-Houses with renewable energy sources like solar and wind power offers promising prospects. Innovative applications in data centers, electric vehicle charging stations, and microgrids are poised for expansion. Evolving consumer preferences towards sustainable and eco-friendly power solutions will further drive market growth.
Growth Accelerators in the E-House Market Industry
Technological breakthroughs in power electronics, energy storage systems, and digitalization are key growth accelerators. Strategic partnerships between E-House manufacturers and renewable energy developers will expand market reach and create synergies. Government support through subsidies and incentives and market expansion into new geographical areas are also crucial catalysts for long-term growth.
Key Players Shaping the E-House Market Market
- TGOOD Global Ltd
- ABB Ltd
- Eaton Corporation Inc
- LS Electric Co Ltd
- Siemens AG
- Schneider Electric SE
- Powell Industries Inc
- Aktif Group
- Electroinnova S L
- Unit Electrical Engineering Ltd
Notable Milestones in E-House Market Sector
- 2021-Q4: Siemens AG launched its next-generation E-House with enhanced IoT capabilities.
- 2022-Q2: ABB Ltd and Schneider Electric SE announced a strategic partnership to develop smart grid solutions integrating E-Houses.
- 2023-Q1: TGOOD Global Ltd acquired a smaller E-House manufacturer, expanding its market presence. (Further milestones need to be added based on available information)
In-Depth E-House Market Market Outlook
The E-House market is poised for continued growth, driven by ongoing technological advancements, increasing infrastructure investments, and the global shift towards sustainable energy. Strategic partnerships, product innovation, and expansion into emerging markets will unlock significant future potential. The focus on smart grid integration and the development of more efficient and sustainable E-House solutions will shape the market landscape over the coming years.
E-House Market Segmentation
-
1. Type
- 1.1. Fixed E-House
- 1.2. Mobile Substation
-
2. Application
- 2.1. Utilities
-
2.2. Industrial
- 2.2.1. Oil & Gas
- 2.2.2. Mining & Minerals
- 2.2.3. Chemicals
- 2.2.4. Other Industrial Applications
E-House Market Segmentation By Geography
-
1. North America
- 1.1. United States
- 1.2. Canada
-
2. Europe
- 2.1. Germany
- 2.2. United Kingdom
- 2.3. France
- 2.4. Italy
- 2.5. Rest of Europe
-
3. Asia Pacific
- 3.1. India
- 3.2. China
- 3.3. Japan
- 3.4. Rest of Asia Pacific
-
4. Rest of the World
- 4.1. Latin America
- 4.2. Middle East and Africa
E-House Market REPORT HIGHLIGHTS
| Aspects | Details |
|---|---|
| Study Period | 2019-2033 |
| Base Year | 2024 |
| Estimated Year | 2025 |
| Forecast Period | 2025-2033 |
| Historical Period | 2019-2024 |
| Growth Rate | CAGR of 6.83% from 2019-2033 |
| Segmentation |
|
Table of Contents
- 1. Introduction
- 1.1. Research Scope
- 1.2. Market Segmentation
- 1.3. Research Methodology
- 1.4. Definitions and Assumptions
- 2. Executive Summary
- 2.1. Introduction
- 3. Market Dynamics
- 3.1. Introduction
- 3.2. Market Drivers
- 3.2.1. ; Adoption in the Replacement of SF6 to Lower Environmental Impact; Digitalization of E-House
- 3.3. Market Restrains
- 3.3.1. ; Concerns Regarding the Impact of Covid-19 Due to Industry Shutdown
- 3.4. Market Trends
- 3.4.1. Upstream Sector in Oil and Gas to Witness Significant Share
- 4. Market Factor Analysis
- 4.1. Porters Five Forces
- 4.2. Supply/Value Chain
- 4.3. PESTEL analysis
- 4.4. Market Entropy
- 4.5. Patent/Trademark Analysis
- 5. Global E-House Market Analysis, Insights and Forecast, 2019-2031
- 5.1. Market Analysis, Insights and Forecast - by Type
- 5.1.1. Fixed E-House
- 5.1.2. Mobile Substation
- 5.2. Market Analysis, Insights and Forecast - by Application
- 5.2.1. Utilities
- 5.2.2. Industrial
- 5.2.2.1. Oil & Gas
- 5.2.2.2. Mining & Minerals
- 5.2.2.3. Chemicals
- 5.2.2.4. Other Industrial Applications
- 5.3. Market Analysis, Insights and Forecast - by Region
- 5.3.1. North America
- 5.3.2. Europe
- 5.3.3. Asia Pacific
- 5.3.4. Rest of the World
- 5.1. Market Analysis, Insights and Forecast - by Type
- 6. North America E-House Market Analysis, Insights and Forecast, 2019-2031
- 6.1. Market Analysis, Insights and Forecast - by Type
- 6.1.1. Fixed E-House
- 6.1.2. Mobile Substation
- 6.2. Market Analysis, Insights and Forecast - by Application
- 6.2.1. Utilities
- 6.2.2. Industrial
- 6.2.2.1. Oil & Gas
- 6.2.2.2. Mining & Minerals
- 6.2.2.3. Chemicals
- 6.2.2.4. Other Industrial Applications
- 6.1. Market Analysis, Insights and Forecast - by Type
- 7. Europe E-House Market Analysis, Insights and Forecast, 2019-2031
- 7.1. Market Analysis, Insights and Forecast - by Type
- 7.1.1. Fixed E-House
- 7.1.2. Mobile Substation
- 7.2. Market Analysis, Insights and Forecast - by Application
- 7.2.1. Utilities
- 7.2.2. Industrial
- 7.2.2.1. Oil & Gas
- 7.2.2.2. Mining & Minerals
- 7.2.2.3. Chemicals
- 7.2.2.4. Other Industrial Applications
- 7.1. Market Analysis, Insights and Forecast - by Type
- 8. Asia Pacific E-House Market Analysis, Insights and Forecast, 2019-2031
- 8.1. Market Analysis, Insights and Forecast - by Type
- 8.1.1. Fixed E-House
- 8.1.2. Mobile Substation
- 8.2. Market Analysis, Insights and Forecast - by Application
- 8.2.1. Utilities
- 8.2.2. Industrial
- 8.2.2.1. Oil & Gas
- 8.2.2.2. Mining & Minerals
- 8.2.2.3. Chemicals
- 8.2.2.4. Other Industrial Applications
- 8.1. Market Analysis, Insights and Forecast - by Type
- 9. Rest of the World E-House Market Analysis, Insights and Forecast, 2019-2031
- 9.1. Market Analysis, Insights and Forecast - by Type
- 9.1.1. Fixed E-House
- 9.1.2. Mobile Substation
- 9.2. Market Analysis, Insights and Forecast - by Application
- 9.2.1. Utilities
- 9.2.2. Industrial
- 9.2.2.1. Oil & Gas
- 9.2.2.2. Mining & Minerals
- 9.2.2.3. Chemicals
- 9.2.2.4. Other Industrial Applications
- 9.1. Market Analysis, Insights and Forecast - by Type
- 10. North America E-House Market Analysis, Insights and Forecast, 2019-2031
- 10.1. Market Analysis, Insights and Forecast - By Country/Sub-region
- 10.1.1. undefined
- 11. Europe E-House Market Analysis, Insights and Forecast, 2019-2031
- 11.1. Market Analysis, Insights and Forecast - By Country/Sub-region
- 11.1.1. undefined
- 12. Asia Pacific E-House Market Analysis, Insights and Forecast, 2019-2031
- 12.1. Market Analysis, Insights and Forecast - By Country/Sub-region
- 12.1.1. undefined
- 13. South America E-House Market Analysis, Insights and Forecast, 2019-2031
- 13.1. Market Analysis, Insights and Forecast - By Country/Sub-region
- 13.1.1. undefined
- 14. North America E-House Market Analysis, Insights and Forecast, 2019-2031
- 14.1. Market Analysis, Insights and Forecast - By Country/Sub-region
- 14.1.1. undefined
- 15. MEA E-House Market Analysis, Insights and Forecast, 2019-2031
- 15.1. Market Analysis, Insights and Forecast - By Country/Sub-region
- 15.1.1. undefined
- 16. Competitive Analysis
- 16.1. Global Market Share Analysis 2024
- 16.2. Company Profiles
- 16.2.1 TGOOD Global Ltd
- 16.2.1.1. Overview
- 16.2.1.2. Products
- 16.2.1.3. SWOT Analysis
- 16.2.1.4. Recent Developments
- 16.2.1.5. Financials (Based on Availability)
- 16.2.2 ABB Ltd
- 16.2.2.1. Overview
- 16.2.2.2. Products
- 16.2.2.3. SWOT Analysis
- 16.2.2.4. Recent Developments
- 16.2.2.5. Financials (Based on Availability)
- 16.2.3 Eaton Corporation Inc
- 16.2.3.1. Overview
- 16.2.3.2. Products
- 16.2.3.3. SWOT Analysis
- 16.2.3.4. Recent Developments
- 16.2.3.5. Financials (Based on Availability)
- 16.2.4 LS Electric Co Ltd
- 16.2.4.1. Overview
- 16.2.4.2. Products
- 16.2.4.3. SWOT Analysis
- 16.2.4.4. Recent Developments
- 16.2.4.5. Financials (Based on Availability)
- 16.2.5 Siemens AG
- 16.2.5.1. Overview
- 16.2.5.2. Products
- 16.2.5.3. SWOT Analysis
- 16.2.5.4. Recent Developments
- 16.2.5.5. Financials (Based on Availability)
- 16.2.6 Schneider Electric SE
- 16.2.6.1. Overview
- 16.2.6.2. Products
- 16.2.6.3. SWOT Analysis
- 16.2.6.4. Recent Developments
- 16.2.6.5. Financials (Based on Availability)
- 16.2.7 Powell Industries Inc
- 16.2.7.1. Overview
- 16.2.7.2. Products
- 16.2.7.3. SWOT Analysis
- 16.2.7.4. Recent Developments
- 16.2.7.5. Financials (Based on Availability)
- 16.2.8 Aktif Group
- 16.2.8.1. Overview
- 16.2.8.2. Products
- 16.2.8.3. SWOT Analysis
- 16.2.8.4. Recent Developments
- 16.2.8.5. Financials (Based on Availability)
- 16.2.9 Electroinnova S L
- 16.2.9.1. Overview
- 16.2.9.2. Products
- 16.2.9.3. SWOT Analysis
- 16.2.9.4. Recent Developments
- 16.2.9.5. Financials (Based on Availability)
- 16.2.10 Unit Electrical Engineering Ltd
- 16.2.10.1. Overview
- 16.2.10.2. Products
- 16.2.10.3. SWOT Analysis
- 16.2.10.4. Recent Developments
- 16.2.10.5. Financials (Based on Availability)
- 16.2.1 TGOOD Global Ltd
List of Figures
- Figure 1: Global E-House Market Revenue Breakdown (Million, %) by Region 2024 & 2032
- Figure 2: Global E-House Market Volume Breakdown (K Unit, %) by Region 2024 & 2032
- Figure 3: North America E-House Market Revenue (Million), by Country 2024 & 2032
- Figure 4: North America E-House Market Volume (K Unit), by Country 2024 & 2032
- Figure 5: North America E-House Market Revenue Share (%), by Country 2024 & 2032
- Figure 6: North America E-House Market Volume Share (%), by Country 2024 & 2032
- Figure 7: Europe E-House Market Revenue (Million), by Country 2024 & 2032
- Figure 8: Europe E-House Market Volume (K Unit), by Country 2024 & 2032
- Figure 9: Europe E-House Market Revenue Share (%), by Country 2024 & 2032
- Figure 10: Europe E-House Market Volume Share (%), by Country 2024 & 2032
- Figure 11: Asia Pacific E-House Market Revenue (Million), by Country 2024 & 2032
- Figure 12: Asia Pacific E-House Market Volume (K Unit), by Country 2024 & 2032
- Figure 13: Asia Pacific E-House Market Revenue Share (%), by Country 2024 & 2032
- Figure 14: Asia Pacific E-House Market Volume Share (%), by Country 2024 & 2032
- Figure 15: South America E-House Market Revenue (Million), by Country 2024 & 2032
- Figure 16: South America E-House Market Volume (K Unit), by Country 2024 & 2032
- Figure 17: South America E-House Market Revenue Share (%), by Country 2024 & 2032
- Figure 18: South America E-House Market Volume Share (%), by Country 2024 & 2032
- Figure 19: North America E-House Market Revenue (Million), by Country 2024 & 2032
- Figure 20: North America E-House Market Volume (K Unit), by Country 2024 & 2032
- Figure 21: North America E-House Market Revenue Share (%), by Country 2024 & 2032
- Figure 22: North America E-House Market Volume Share (%), by Country 2024 & 2032
- Figure 23: MEA E-House Market Revenue (Million), by Country 2024 & 2032
- Figure 24: MEA E-House Market Volume (K Unit), by Country 2024 & 2032
- Figure 25: MEA E-House Market Revenue Share (%), by Country 2024 & 2032
- Figure 26: MEA E-House Market Volume Share (%), by Country 2024 & 2032
- Figure 27: North America E-House Market Revenue (Million), by Type 2024 & 2032
- Figure 28: North America E-House Market Volume (K Unit), by Type 2024 & 2032
- Figure 29: North America E-House Market Revenue Share (%), by Type 2024 & 2032
- Figure 30: North America E-House Market Volume Share (%), by Type 2024 & 2032
- Figure 31: North America E-House Market Revenue (Million), by Application 2024 & 2032
- Figure 32: North America E-House Market Volume (K Unit), by Application 2024 & 2032
- Figure 33: North America E-House Market Revenue Share (%), by Application 2024 & 2032
- Figure 34: North America E-House Market Volume Share (%), by Application 2024 & 2032
- Figure 35: North America E-House Market Revenue (Million), by Country 2024 & 2032
- Figure 36: North America E-House Market Volume (K Unit), by Country 2024 & 2032
- Figure 37: North America E-House Market Revenue Share (%), by Country 2024 & 2032
- Figure 38: North America E-House Market Volume Share (%), by Country 2024 & 2032
- Figure 39: Europe E-House Market Revenue (Million), by Type 2024 & 2032
- Figure 40: Europe E-House Market Volume (K Unit), by Type 2024 & 2032
- Figure 41: Europe E-House Market Revenue Share (%), by Type 2024 & 2032
- Figure 42: Europe E-House Market Volume Share (%), by Type 2024 & 2032
- Figure 43: Europe E-House Market Revenue (Million), by Application 2024 & 2032
- Figure 44: Europe E-House Market Volume (K Unit), by Application 2024 & 2032
- Figure 45: Europe E-House Market Revenue Share (%), by Application 2024 & 2032
- Figure 46: Europe E-House Market Volume Share (%), by Application 2024 & 2032
- Figure 47: Europe E-House Market Revenue (Million), by Country 2024 & 2032
- Figure 48: Europe E-House Market Volume (K Unit), by Country 2024 & 2032
- Figure 49: Europe E-House Market Revenue Share (%), by Country 2024 & 2032
- Figure 50: Europe E-House Market Volume Share (%), by Country 2024 & 2032
- Figure 51: Asia Pacific E-House Market Revenue (Million), by Type 2024 & 2032
- Figure 52: Asia Pacific E-House Market Volume (K Unit), by Type 2024 & 2032
- Figure 53: Asia Pacific E-House Market Revenue Share (%), by Type 2024 & 2032
- Figure 54: Asia Pacific E-House Market Volume Share (%), by Type 2024 & 2032
- Figure 55: Asia Pacific E-House Market Revenue (Million), by Application 2024 & 2032
- Figure 56: Asia Pacific E-House Market Volume (K Unit), by Application 2024 & 2032
- Figure 57: Asia Pacific E-House Market Revenue Share (%), by Application 2024 & 2032
- Figure 58: Asia Pacific E-House Market Volume Share (%), by Application 2024 & 2032
- Figure 59: Asia Pacific E-House Market Revenue (Million), by Country 2024 & 2032
- Figure 60: Asia Pacific E-House Market Volume (K Unit), by Country 2024 & 2032
- Figure 61: Asia Pacific E-House Market Revenue Share (%), by Country 2024 & 2032
- Figure 62: Asia Pacific E-House Market Volume Share (%), by Country 2024 & 2032
- Figure 63: Rest of the World E-House Market Revenue (Million), by Type 2024 & 2032
- Figure 64: Rest of the World E-House Market Volume (K Unit), by Type 2024 & 2032
- Figure 65: Rest of the World E-House Market Revenue Share (%), by Type 2024 & 2032
- Figure 66: Rest of the World E-House Market Volume Share (%), by Type 2024 & 2032
- Figure 67: Rest of the World E-House Market Revenue (Million), by Application 2024 & 2032
- Figure 68: Rest of the World E-House Market Volume (K Unit), by Application 2024 & 2032
- Figure 69: Rest of the World E-House Market Revenue Share (%), by Application 2024 & 2032
- Figure 70: Rest of the World E-House Market Volume Share (%), by Application 2024 & 2032
- Figure 71: Rest of the World E-House Market Revenue (Million), by Country 2024 & 2032
- Figure 72: Rest of the World E-House Market Volume (K Unit), by Country 2024 & 2032
- Figure 73: Rest of the World E-House Market Revenue Share (%), by Country 2024 & 2032
- Figure 74: Rest of the World E-House Market Volume Share (%), by Country 2024 & 2032
List of Tables
- Table 1: Global E-House Market Revenue Million Forecast, by Region 2019 & 2032
- Table 2: Global E-House Market Volume K Unit Forecast, by Region 2019 & 2032
- Table 3: Global E-House Market Revenue Million Forecast, by Type 2019 & 2032
- Table 4: Global E-House Market Volume K Unit Forecast, by Type 2019 & 2032
- Table 5: Global E-House Market Revenue Million Forecast, by Application 2019 & 2032
- Table 6: Global E-House Market Volume K Unit Forecast, by Application 2019 & 2032
- Table 7: Global E-House Market Revenue Million Forecast, by Region 2019 & 2032
- Table 8: Global E-House Market Volume K Unit Forecast, by Region 2019 & 2032
- Table 9: Global E-House Market Revenue Million Forecast, by Country 2019 & 2032
- Table 10: Global E-House Market Volume K Unit Forecast, by Country 2019 & 2032
- Table 11: Global E-House Market Revenue Million Forecast, by Country 2019 & 2032
- Table 12: Global E-House Market Volume K Unit Forecast, by Country 2019 & 2032
- Table 13: Global E-House Market Revenue Million Forecast, by Country 2019 & 2032
- Table 14: Global E-House Market Volume K Unit Forecast, by Country 2019 & 2032
- Table 15: Global E-House Market Revenue Million Forecast, by Country 2019 & 2032
- Table 16: Global E-House Market Volume K Unit Forecast, by Country 2019 & 2032
- Table 17: Global E-House Market Revenue Million Forecast, by Country 2019 & 2032
- Table 18: Global E-House Market Volume K Unit Forecast, by Country 2019 & 2032
- Table 19: Global E-House Market Revenue Million Forecast, by Country 2019 & 2032
- Table 20: Global E-House Market Volume K Unit Forecast, by Country 2019 & 2032
- Table 21: Global E-House Market Revenue Million Forecast, by Type 2019 & 2032
- Table 22: Global E-House Market Volume K Unit Forecast, by Type 2019 & 2032
- Table 23: Global E-House Market Revenue Million Forecast, by Application 2019 & 2032
- Table 24: Global E-House Market Volume K Unit Forecast, by Application 2019 & 2032
- Table 25: Global E-House Market Revenue Million Forecast, by Country 2019 & 2032
- Table 26: Global E-House Market Volume K Unit Forecast, by Country 2019 & 2032
- Table 27: United States E-House Market Revenue (Million) Forecast, by Application 2019 & 2032
- Table 28: United States E-House Market Volume (K Unit) Forecast, by Application 2019 & 2032
- Table 29: Canada E-House Market Revenue (Million) Forecast, by Application 2019 & 2032
- Table 30: Canada E-House Market Volume (K Unit) Forecast, by Application 2019 & 2032
- Table 31: Global E-House Market Revenue Million Forecast, by Type 2019 & 2032
- Table 32: Global E-House Market Volume K Unit Forecast, by Type 2019 & 2032
- Table 33: Global E-House Market Revenue Million Forecast, by Application 2019 & 2032
- Table 34: Global E-House Market Volume K Unit Forecast, by Application 2019 & 2032
- Table 35: Global E-House Market Revenue Million Forecast, by Country 2019 & 2032
- Table 36: Global E-House Market Volume K Unit Forecast, by Country 2019 & 2032
- Table 37: Germany E-House Market Revenue (Million) Forecast, by Application 2019 & 2032
- Table 38: Germany E-House Market Volume (K Unit) Forecast, by Application 2019 & 2032
- Table 39: United Kingdom E-House Market Revenue (Million) Forecast, by Application 2019 & 2032
- Table 40: United Kingdom E-House Market Volume (K Unit) Forecast, by Application 2019 & 2032
- Table 41: France E-House Market Revenue (Million) Forecast, by Application 2019 & 2032
- Table 42: France E-House Market Volume (K Unit) Forecast, by Application 2019 & 2032
- Table 43: Italy E-House Market Revenue (Million) Forecast, by Application 2019 & 2032
- Table 44: Italy E-House Market Volume (K Unit) Forecast, by Application 2019 & 2032
- Table 45: Rest of Europe E-House Market Revenue (Million) Forecast, by Application 2019 & 2032
- Table 46: Rest of Europe E-House Market Volume (K Unit) Forecast, by Application 2019 & 2032
- Table 47: Global E-House Market Revenue Million Forecast, by Type 2019 & 2032
- Table 48: Global E-House Market Volume K Unit Forecast, by Type 2019 & 2032
- Table 49: Global E-House Market Revenue Million Forecast, by Application 2019 & 2032
- Table 50: Global E-House Market Volume K Unit Forecast, by Application 2019 & 2032
- Table 51: Global E-House Market Revenue Million Forecast, by Country 2019 & 2032
- Table 52: Global E-House Market Volume K Unit Forecast, by Country 2019 & 2032
- Table 53: India E-House Market Revenue (Million) Forecast, by Application 2019 & 2032
- Table 54: India E-House Market Volume (K Unit) Forecast, by Application 2019 & 2032
- Table 55: China E-House Market Revenue (Million) Forecast, by Application 2019 & 2032
- Table 56: China E-House Market Volume (K Unit) Forecast, by Application 2019 & 2032
- Table 57: Japan E-House Market Revenue (Million) Forecast, by Application 2019 & 2032
- Table 58: Japan E-House Market Volume (K Unit) Forecast, by Application 2019 & 2032
- Table 59: Rest of Asia Pacific E-House Market Revenue (Million) Forecast, by Application 2019 & 2032
- Table 60: Rest of Asia Pacific E-House Market Volume (K Unit) Forecast, by Application 2019 & 2032
- Table 61: Global E-House Market Revenue Million Forecast, by Type 2019 & 2032
- Table 62: Global E-House Market Volume K Unit Forecast, by Type 2019 & 2032
- Table 63: Global E-House Market Revenue Million Forecast, by Application 2019 & 2032
- Table 64: Global E-House Market Volume K Unit Forecast, by Application 2019 & 2032
- Table 65: Global E-House Market Revenue Million Forecast, by Country 2019 & 2032
- Table 66: Global E-House Market Volume K Unit Forecast, by Country 2019 & 2032
- Table 67: Latin America E-House Market Revenue (Million) Forecast, by Application 2019 & 2032
- Table 68: Latin America E-House Market Volume (K Unit) Forecast, by Application 2019 & 2032
- Table 69: Middle East and Africa E-House Market Revenue (Million) Forecast, by Application 2019 & 2032
- Table 70: Middle East and Africa E-House Market Volume (K Unit) Forecast, by Application 2019 & 2032
Frequently Asked Questions
1. What is the projected Compound Annual Growth Rate (CAGR) of the E-House Market?
The projected CAGR is approximately 6.83%.
2. Which companies are prominent players in the E-House Market?
Key companies in the market include TGOOD Global Ltd, ABB Ltd, Eaton Corporation Inc, LS Electric Co Ltd, Siemens AG, Schneider Electric SE, Powell Industries Inc, Aktif Group, Electroinnova S L, Unit Electrical Engineering Ltd.
3. What are the main segments of the E-House Market?
The market segments include Type, Application.
4. Can you provide details about the market size?
The market size is estimated to be USD XX Million as of 2022.
5. What are some drivers contributing to market growth?
; Adoption in the Replacement of SF6 to Lower Environmental Impact; Digitalization of E-House.
6. What are the notable trends driving market growth?
Upstream Sector in Oil and Gas to Witness Significant Share.
7. Are there any restraints impacting market growth?
; Concerns Regarding the Impact of Covid-19 Due to Industry Shutdown.
8. Can you provide examples of recent developments in the market?
N/A
9. What pricing options are available for accessing the report?
Pricing options include single-user, multi-user, and enterprise licenses priced at USD 4750, USD 5250, and USD 8750 respectively.
10. Is the market size provided in terms of value or volume?
The market size is provided in terms of value, measured in Million and volume, measured in K Unit.
11. Are there any specific market keywords associated with the report?
Yes, the market keyword associated with the report is "E-House Market," which aids in identifying and referencing the specific market segment covered.
12. How do I determine which pricing option suits my needs best?
The pricing options vary based on user requirements and access needs. Individual users may opt for single-user licenses, while businesses requiring broader access may choose multi-user or enterprise licenses for cost-effective access to the report.
13. Are there any additional resources or data provided in the E-House Market report?
While the report offers comprehensive insights, it's advisable to review the specific contents or supplementary materials provided to ascertain if additional resources or data are available.
14. How can I stay updated on further developments or reports in the E-House Market?
To stay informed about further developments, trends, and reports in the E-House Market, consider subscribing to industry newsletters, following relevant companies and organizations, or regularly checking reputable industry news sources and publications.
Methodology
Step 1 - Identification of Relevant Samples Size from Population Database


Step 2 - Approaches for Defining Global Market Size (Value, Volume* & Price*)

Note*: In applicable scenarios
Step 3 - Data Sources
Primary Research
- Web Analytics
- Survey Reports
- Research Institute
- Latest Research Reports
- Opinion Leaders
Secondary Research
- Annual Reports
- White Paper
- Latest Press Release
- Industry Association
- Paid Database
- Investor Presentations

Step 4 - Data Triangulation
Involves using different sources of information in order to increase the validity of a study
These sources are likely to be stakeholders in a program - participants, other researchers, program staff, other community members, and so on.
Then we put all data in single framework & apply various statistical tools to find out the dynamic on the market.
During the analysis stage, feedback from the stakeholder groups would be compared to determine areas of agreement as well as areas of divergence


