
Key Insights
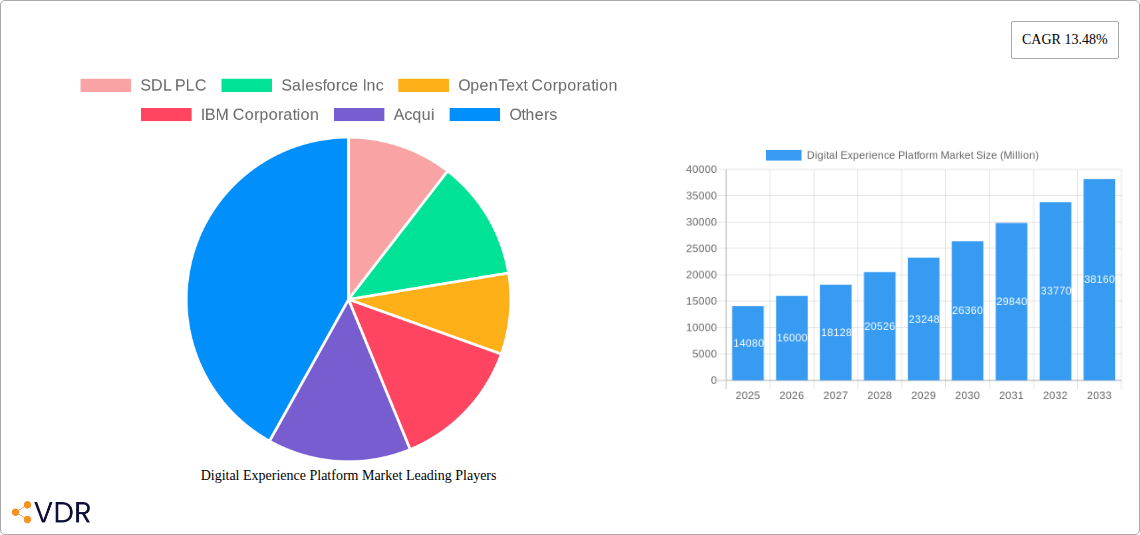
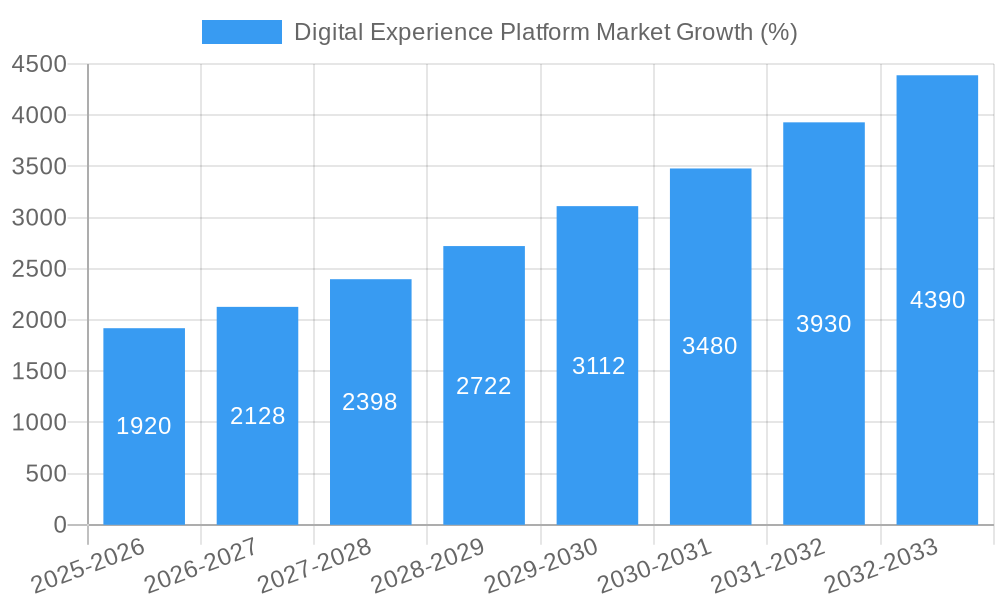
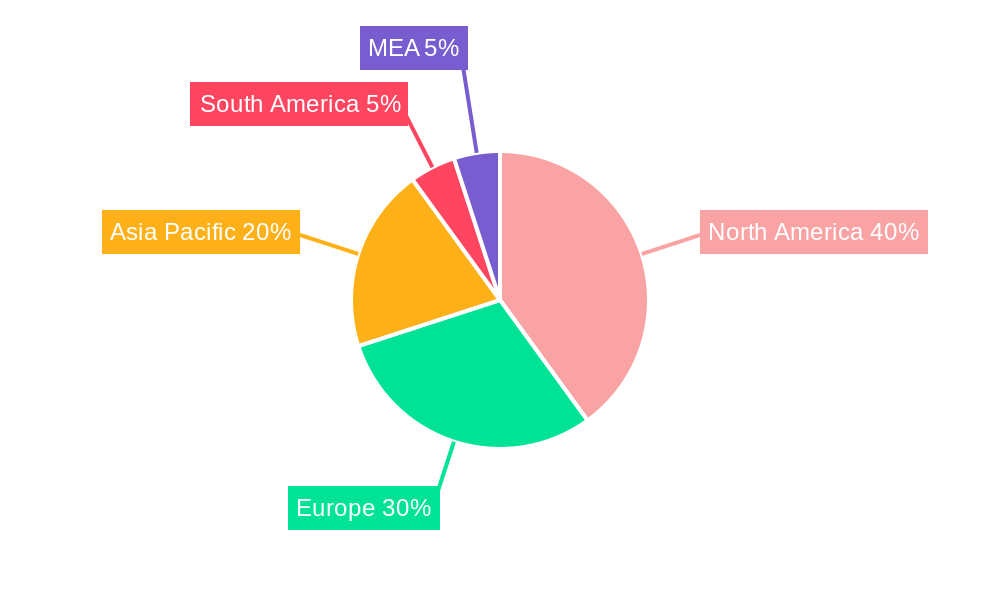
The Digital Experience Platform (DXP) market is experiencing robust growth, projected to reach \$14.08 billion in 2025 and maintain a Compound Annual Growth Rate (CAGR) of 13.48% from 2025 to 2033. This expansion is fueled by several key drivers. Increasing digital transformation initiatives across industries are pushing businesses to adopt comprehensive platforms that unify customer experiences across all touchpoints. The rising demand for personalized and omnichannel experiences, coupled with the need for improved content management and efficient data analytics, is further driving market growth. Furthermore, the increasing adoption of cloud-based DXPs offers scalability, flexibility, and cost-effectiveness, contributing significantly to the market's expansion. Competition is fierce, with established players like Adobe, Salesforce, and IBM vying for market share alongside emerging niche players offering specialized functionalities. The market segmentation, encompassing various components (Platform, Services), deployment types (On-Premise, Cloud), and end-user industries (Retail, IT & Telecom, BFSI, Healthcare), presents various opportunities for growth and specialized solutions. North America currently holds a significant market share, but Asia-Pacific is projected to witness rapid growth driven by increasing digital adoption and rising investments in technological infrastructure.
Growth within specific segments, such as cloud-based deployments and the healthcare sector, is outpacing the overall market average. The ongoing need to deliver seamless and personalized experiences across diverse channels will continue to propel DXP adoption across industries. While challenges exist, such as the complexity of integration with existing systems and the need for skilled professionals, these are being mitigated by ongoing technological advancements and the growing availability of vendor-provided support and training. The market's future trajectory points towards a continued rise in demand for sophisticated DXP solutions, particularly those incorporating AI and machine learning capabilities for advanced personalization and customer insights. This will further enhance the market's value proposition and drive even higher adoption rates in the coming years.
Digital Experience Platform (DXP) Market: A Comprehensive Report (2019-2033)
This in-depth report provides a comprehensive analysis of the Digital Experience Platform (DXP) market, encompassing market dynamics, growth trends, regional dominance, product landscape, key players, and future outlook. The study period covers 2019-2033, with a focus on 2025 as the base and estimated year. The report utilizes a robust methodology incorporating primary and secondary research, providing invaluable insights for industry professionals, investors, and strategic decision-makers. The DXP market is segmented by component (Platform, Services), deployment type (On-Premise, Cloud), and end-user (Retail, IT and Telecom, BFSI, Healthcare, Other End Users). The market is projected to reach xx Million by 2033.
Digital Experience Platform Market Dynamics & Structure
The DXP market is characterized by a moderately concentrated landscape, with key players such as SDL PLC, Salesforce Inc, OpenText Corporation, IBM Corporation, Acqui, Microsoft Corporation, Adobe Inc, Oracle Corporation, Sitecore, and SAP SE holding significant market share. The market’s structure is influenced by continuous technological innovation, primarily driven by advancements in AI, cloud computing, and personalization technologies. Stringent regulatory frameworks regarding data privacy and security are also shaping market dynamics. While there are limited direct substitutes, competitors offering integrated solutions pose a significant challenge.
- Market Concentration: Moderately concentrated, with the top 5 players holding approximately xx% market share in 2024.
- Technological Innovation: AI-powered personalization, headless CMS, and serverless architecture are key innovation drivers.
- Regulatory Landscape: GDPR, CCPA, and other data privacy regulations significantly influence DXP adoption and vendor strategies.
- Competitive Substitutes: Limited direct substitutes, but increasing competition from integrated CRM and marketing automation platforms.
- M&A Activity: A moderate number of M&A deals (xx deals in 2024) aimed at expanding capabilities and market reach. xx% of these deals involved cloud-based DXP companies.
- End-User Demographics: BFSI and Retail sectors are major adopters, while Healthcare and other sectors are showing increasing adoption rates.
Digital Experience Platform Market Growth Trends & Insights
The DXP market witnessed robust growth during the historical period (2019-2024), with a CAGR of xx%. This growth is attributed to the increasing demand for enhanced customer experiences, digital transformation initiatives across various industries, and the rising adoption of cloud-based solutions. The market is expected to maintain a healthy growth trajectory during the forecast period (2025-2033), driven by factors such as the growing adoption of omnichannel strategies, the rise of headless commerce, and the increasing use of AI-powered personalization features. Market penetration currently stands at xx%, projected to reach xx% by 2033. Technological disruptions, particularly in the areas of AI, IoT, and 5G, are expected to further accelerate market growth. Shifting consumer behavior towards personalized and seamless digital experiences is a significant catalyst.
Dominant Regions, Countries, or Segments in Digital Experience Platform Market
North America currently holds the largest market share in the DXP market, followed by Europe and Asia Pacific. This dominance is largely driven by high digital adoption rates, established IT infrastructure, and significant investments in digital transformation initiatives. Within the segments, the Cloud deployment type is witnessing the highest growth, driven by its scalability, flexibility, and cost-effectiveness. The Platform component dominates the market due to its core functionalities, while the BFSI sector leads in end-user adoption due to its high dependence on seamless customer interaction and efficient operations.
Key Drivers:
- North America: High digital maturity, strong IT infrastructure, and substantial investments in DXPs.
- Europe: Growing adoption of cloud-based solutions and increasing focus on digital transformation.
- Asia Pacific: Rapid economic growth, rising internet penetration, and expanding digitalization efforts.
- Cloud Deployment: Scalability, cost-effectiveness, and ease of access.
- BFSI Sector: Need for personalized customer experiences and efficient operations.
Dominance Factors: Market share, growth potential, technological maturity, and regulatory environment.
Digital Experience Platform Market Product Landscape
DXP solutions are increasingly incorporating AI-driven personalization, headless architectures for enhanced content decoupling, and omnichannel capabilities for unified customer engagement. Key performance metrics for DXP solutions include customer satisfaction scores (CSAT), conversion rates, website traffic, and return on investment (ROI). The unique selling propositions center around improved user experiences, enhanced operational efficiency, and increased customer engagement.
Key Drivers, Barriers & Challenges in Digital Experience Platform Market
Key Drivers:
- Increasing demand for enhanced customer experience
- Growing adoption of omnichannel strategies
- Rise of headless commerce
- Investments in digital transformation initiatives across various industries.
Challenges and Restraints:
- High initial investment costs for DXP implementation
- Complexity of integration with existing systems
- Lack of skilled professionals to manage and maintain DXPs
- Security concerns related to data privacy and protection
Emerging Opportunities in Digital Experience Platform Market
- Untapped markets in developing economies, particularly in the APAC region.
- Development of DXPs tailored for specific industry verticals (e.g., healthcare, education).
- Growing demand for AI-powered personalization and customer journey optimization features.
Growth Accelerators in the Digital Experience Platform Market Industry
Technological advancements in AI, machine learning, and cloud computing are driving significant growth in the DXP market. Strategic partnerships between DXP providers and technology companies will fuel innovation and market expansion. Furthermore, the increasing focus on customer experience management and digital transformation across industries creates a fertile ground for long-term growth.
Key Players Shaping the Digital Experience Platform Market Market
- SDL PLC
- Salesforce Inc
- OpenText Corporation
- IBM Corporation
- Acqui
- Microsoft Corporation
- Adobe Inc
- Oracle Corporation
- Sitecore
- SAP SE
Notable Milestones in Digital Experience Platform Market Sector
- September 2022: KeyBank partners with Oracle to modernize its consumer lending process, showcasing the growing DXP adoption in the BFSI sector.
- December 2022: The Bank of Thailand selects Oracle Fusion Cloud HCM, highlighting the role of DXPs in optimizing HR functions.
- December 2022: Oracle launches a new cloud region in Chicago, expanding its cloud infrastructure and enhancing DXP accessibility.
In-Depth Digital Experience Platform Market Market Outlook
The future of the DXP market looks promising, with sustained growth driven by technological innovation, increasing digital adoption, and the rising demand for personalized customer experiences. Strategic partnerships and acquisitions will further shape the market landscape, leading to consolidation and the emergence of comprehensive DXP solutions. Opportunities exist in niche sectors and developing economies, presenting significant potential for growth and expansion.
Digital Experience Platform Market Segmentation
-
1. Component
- 1.1. Platform
- 1.2. Services
-
2. Deployment Type
- 2.1. On-Premise
- 2.2. Cloud
-
3. End Users
- 3.1. Retail
- 3.2. IT and Telecom
- 3.3. BFSI
- 3.4. Healthcare
- 3.5. Other End Users
Digital Experience Platform Market Segmentation By Geography
- 1. North America
- 2. Europe
- 3. Asia
- 4. Australia and New Zealand
- 5. Latin America
- 6. Middle East and Africa
Digital Experience Platform Market REPORT HIGHLIGHTS
| Aspects | Details |
|---|---|
| Study Period | 2019-2033 |
| Base Year | 2024 |
| Estimated Year | 2025 |
| Forecast Period | 2025-2033 |
| Historical Period | 2019-2024 |
| Growth Rate | CAGR of 13.48% from 2019-2033 |
| Segmentation |
|
Table of Contents
- 1. Introduction
- 1.1. Research Scope
- 1.2. Market Segmentation
- 1.3. Research Methodology
- 1.4. Definitions and Assumptions
- 2. Executive Summary
- 2.1. Introduction
- 3. Market Dynamics
- 3.1. Introduction
- 3.2. Market Drivers
- 3.2.1. Growing Deployment of Cloud-Based Solutions; Rising Demand for big Data Analytics
- 3.3. Market Restrains
- 3.3.1. Privacy and Data Security Issues
- 3.4. Market Trends
- 3.4.1. On Cloud Deployment to Drive the Market Growth
- 4. Market Factor Analysis
- 4.1. Porters Five Forces
- 4.2. Supply/Value Chain
- 4.3. PESTEL analysis
- 4.4. Market Entropy
- 4.5. Patent/Trademark Analysis
- 5. Global Digital Experience Platform Market Analysis, Insights and Forecast, 2019-2031
- 5.1. Market Analysis, Insights and Forecast - by Component
- 5.1.1. Platform
- 5.1.2. Services
- 5.2. Market Analysis, Insights and Forecast - by Deployment Type
- 5.2.1. On-Premise
- 5.2.2. Cloud
- 5.3. Market Analysis, Insights and Forecast - by End Users
- 5.3.1. Retail
- 5.3.2. IT and Telecom
- 5.3.3. BFSI
- 5.3.4. Healthcare
- 5.3.5. Other End Users
- 5.4. Market Analysis, Insights and Forecast - by Region
- 5.4.1. North America
- 5.4.2. Europe
- 5.4.3. Asia
- 5.4.4. Australia and New Zealand
- 5.4.5. Latin America
- 5.4.6. Middle East and Africa
- 5.1. Market Analysis, Insights and Forecast - by Component
- 6. North America Digital Experience Platform Market Analysis, Insights and Forecast, 2019-2031
- 6.1. Market Analysis, Insights and Forecast - by Component
- 6.1.1. Platform
- 6.1.2. Services
- 6.2. Market Analysis, Insights and Forecast - by Deployment Type
- 6.2.1. On-Premise
- 6.2.2. Cloud
- 6.3. Market Analysis, Insights and Forecast - by End Users
- 6.3.1. Retail
- 6.3.2. IT and Telecom
- 6.3.3. BFSI
- 6.3.4. Healthcare
- 6.3.5. Other End Users
- 6.1. Market Analysis, Insights and Forecast - by Component
- 7. Europe Digital Experience Platform Market Analysis, Insights and Forecast, 2019-2031
- 7.1. Market Analysis, Insights and Forecast - by Component
- 7.1.1. Platform
- 7.1.2. Services
- 7.2. Market Analysis, Insights and Forecast - by Deployment Type
- 7.2.1. On-Premise
- 7.2.2. Cloud
- 7.3. Market Analysis, Insights and Forecast - by End Users
- 7.3.1. Retail
- 7.3.2. IT and Telecom
- 7.3.3. BFSI
- 7.3.4. Healthcare
- 7.3.5. Other End Users
- 7.1. Market Analysis, Insights and Forecast - by Component
- 8. Asia Digital Experience Platform Market Analysis, Insights and Forecast, 2019-2031
- 8.1. Market Analysis, Insights and Forecast - by Component
- 8.1.1. Platform
- 8.1.2. Services
- 8.2. Market Analysis, Insights and Forecast - by Deployment Type
- 8.2.1. On-Premise
- 8.2.2. Cloud
- 8.3. Market Analysis, Insights and Forecast - by End Users
- 8.3.1. Retail
- 8.3.2. IT and Telecom
- 8.3.3. BFSI
- 8.3.4. Healthcare
- 8.3.5. Other End Users
- 8.1. Market Analysis, Insights and Forecast - by Component
- 9. Australia and New Zealand Digital Experience Platform Market Analysis, Insights and Forecast, 2019-2031
- 9.1. Market Analysis, Insights and Forecast - by Component
- 9.1.1. Platform
- 9.1.2. Services
- 9.2. Market Analysis, Insights and Forecast - by Deployment Type
- 9.2.1. On-Premise
- 9.2.2. Cloud
- 9.3. Market Analysis, Insights and Forecast - by End Users
- 9.3.1. Retail
- 9.3.2. IT and Telecom
- 9.3.3. BFSI
- 9.3.4. Healthcare
- 9.3.5. Other End Users
- 9.1. Market Analysis, Insights and Forecast - by Component
- 10. Latin America Digital Experience Platform Market Analysis, Insights and Forecast, 2019-2031
- 10.1. Market Analysis, Insights and Forecast - by Component
- 10.1.1. Platform
- 10.1.2. Services
- 10.2. Market Analysis, Insights and Forecast - by Deployment Type
- 10.2.1. On-Premise
- 10.2.2. Cloud
- 10.3. Market Analysis, Insights and Forecast - by End Users
- 10.3.1. Retail
- 10.3.2. IT and Telecom
- 10.3.3. BFSI
- 10.3.4. Healthcare
- 10.3.5. Other End Users
- 10.1. Market Analysis, Insights and Forecast - by Component
- 11. Middle East and Africa Digital Experience Platform Market Analysis, Insights and Forecast, 2019-2031
- 11.1. Market Analysis, Insights and Forecast - by Component
- 11.1.1. Platform
- 11.1.2. Services
- 11.2. Market Analysis, Insights and Forecast - by Deployment Type
- 11.2.1. On-Premise
- 11.2.2. Cloud
- 11.3. Market Analysis, Insights and Forecast - by End Users
- 11.3.1. Retail
- 11.3.2. IT and Telecom
- 11.3.3. BFSI
- 11.3.4. Healthcare
- 11.3.5. Other End Users
- 11.1. Market Analysis, Insights and Forecast - by Component
- 12. North America Digital Experience Platform Market Analysis, Insights and Forecast, 2019-2031
- 12.1. Market Analysis, Insights and Forecast - By Country/Sub-region
- 12.1.1 United States
- 12.1.2 Canada
- 12.1.3 Mexico
- 13. Europe Digital Experience Platform Market Analysis, Insights and Forecast, 2019-2031
- 13.1. Market Analysis, Insights and Forecast - By Country/Sub-region
- 13.1.1 Germany
- 13.1.2 United Kingdom
- 13.1.3 France
- 13.1.4 Spain
- 13.1.5 Italy
- 13.1.6 Spain
- 13.1.7 Belgium
- 13.1.8 Netherland
- 13.1.9 Nordics
- 13.1.10 Rest of Europe
- 14. Asia Pacific Digital Experience Platform Market Analysis, Insights and Forecast, 2019-2031
- 14.1. Market Analysis, Insights and Forecast - By Country/Sub-region
- 14.1.1 China
- 14.1.2 Japan
- 14.1.3 India
- 14.1.4 South Korea
- 14.1.5 Southeast Asia
- 14.1.6 Australia
- 14.1.7 Indonesia
- 14.1.8 Phillipes
- 14.1.9 Singapore
- 14.1.10 Thailandc
- 14.1.11 Rest of Asia Pacific
- 15. South America Digital Experience Platform Market Analysis, Insights and Forecast, 2019-2031
- 15.1. Market Analysis, Insights and Forecast - By Country/Sub-region
- 15.1.1 Brazil
- 15.1.2 Argentina
- 15.1.3 Peru
- 15.1.4 Chile
- 15.1.5 Colombia
- 15.1.6 Ecuador
- 15.1.7 Venezuela
- 15.1.8 Rest of South America
- 16. North America Digital Experience Platform Market Analysis, Insights and Forecast, 2019-2031
- 16.1. Market Analysis, Insights and Forecast - By Country/Sub-region
- 16.1.1 United States
- 16.1.2 Canada
- 16.1.3 Mexico
- 17. MEA Digital Experience Platform Market Analysis, Insights and Forecast, 2019-2031
- 17.1. Market Analysis, Insights and Forecast - By Country/Sub-region
- 17.1.1 United Arab Emirates
- 17.1.2 Saudi Arabia
- 17.1.3 South Africa
- 17.1.4 Rest of Middle East and Africa
- 18. Competitive Analysis
- 18.1. Global Market Share Analysis 2024
- 18.2. Company Profiles
- 18.2.1 SDL PLC
- 18.2.1.1. Overview
- 18.2.1.2. Products
- 18.2.1.3. SWOT Analysis
- 18.2.1.4. Recent Developments
- 18.2.1.5. Financials (Based on Availability)
- 18.2.2 Salesforce Inc
- 18.2.2.1. Overview
- 18.2.2.2. Products
- 18.2.2.3. SWOT Analysis
- 18.2.2.4. Recent Developments
- 18.2.2.5. Financials (Based on Availability)
- 18.2.3 OpenText Corporation
- 18.2.3.1. Overview
- 18.2.3.2. Products
- 18.2.3.3. SWOT Analysis
- 18.2.3.4. Recent Developments
- 18.2.3.5. Financials (Based on Availability)
- 18.2.4 IBM Corporation
- 18.2.4.1. Overview
- 18.2.4.2. Products
- 18.2.4.3. SWOT Analysis
- 18.2.4.4. Recent Developments
- 18.2.4.5. Financials (Based on Availability)
- 18.2.5 Acqui
- 18.2.5.1. Overview
- 18.2.5.2. Products
- 18.2.5.3. SWOT Analysis
- 18.2.5.4. Recent Developments
- 18.2.5.5. Financials (Based on Availability)
- 18.2.6 Microsoft Corporation
- 18.2.6.1. Overview
- 18.2.6.2. Products
- 18.2.6.3. SWOT Analysis
- 18.2.6.4. Recent Developments
- 18.2.6.5. Financials (Based on Availability)
- 18.2.7 Adobe Inc
- 18.2.7.1. Overview
- 18.2.7.2. Products
- 18.2.7.3. SWOT Analysis
- 18.2.7.4. Recent Developments
- 18.2.7.5. Financials (Based on Availability)
- 18.2.8 Oracle Corporation
- 18.2.8.1. Overview
- 18.2.8.2. Products
- 18.2.8.3. SWOT Analysis
- 18.2.8.4. Recent Developments
- 18.2.8.5. Financials (Based on Availability)
- 18.2.9 Sitecore
- 18.2.9.1. Overview
- 18.2.9.2. Products
- 18.2.9.3. SWOT Analysis
- 18.2.9.4. Recent Developments
- 18.2.9.5. Financials (Based on Availability)
- 18.2.10 SAP SE
- 18.2.10.1. Overview
- 18.2.10.2. Products
- 18.2.10.3. SWOT Analysis
- 18.2.10.4. Recent Developments
- 18.2.10.5. Financials (Based on Availability)
- 18.2.1 SDL PLC
List of Figures
- Figure 1: Global Digital Experience Platform Market Revenue Breakdown (Million, %) by Region 2024 & 2032
- Figure 2: Global Digital Experience Platform Market Volume Breakdown (K Unit, %) by Region 2024 & 2032
- Figure 3: North America Digital Experience Platform Market Revenue (Million), by Country 2024 & 2032
- Figure 4: North America Digital Experience Platform Market Volume (K Unit), by Country 2024 & 2032
- Figure 5: North America Digital Experience Platform Market Revenue Share (%), by Country 2024 & 2032
- Figure 6: North America Digital Experience Platform Market Volume Share (%), by Country 2024 & 2032
- Figure 7: Europe Digital Experience Platform Market Revenue (Million), by Country 2024 & 2032
- Figure 8: Europe Digital Experience Platform Market Volume (K Unit), by Country 2024 & 2032
- Figure 9: Europe Digital Experience Platform Market Revenue Share (%), by Country 2024 & 2032
- Figure 10: Europe Digital Experience Platform Market Volume Share (%), by Country 2024 & 2032
- Figure 11: Asia Pacific Digital Experience Platform Market Revenue (Million), by Country 2024 & 2032
- Figure 12: Asia Pacific Digital Experience Platform Market Volume (K Unit), by Country 2024 & 2032
- Figure 13: Asia Pacific Digital Experience Platform Market Revenue Share (%), by Country 2024 & 2032
- Figure 14: Asia Pacific Digital Experience Platform Market Volume Share (%), by Country 2024 & 2032
- Figure 15: South America Digital Experience Platform Market Revenue (Million), by Country 2024 & 2032
- Figure 16: South America Digital Experience Platform Market Volume (K Unit), by Country 2024 & 2032
- Figure 17: South America Digital Experience Platform Market Revenue Share (%), by Country 2024 & 2032
- Figure 18: South America Digital Experience Platform Market Volume Share (%), by Country 2024 & 2032
- Figure 19: North America Digital Experience Platform Market Revenue (Million), by Country 2024 & 2032
- Figure 20: North America Digital Experience Platform Market Volume (K Unit), by Country 2024 & 2032
- Figure 21: North America Digital Experience Platform Market Revenue Share (%), by Country 2024 & 2032
- Figure 22: North America Digital Experience Platform Market Volume Share (%), by Country 2024 & 2032
- Figure 23: MEA Digital Experience Platform Market Revenue (Million), by Country 2024 & 2032
- Figure 24: MEA Digital Experience Platform Market Volume (K Unit), by Country 2024 & 2032
- Figure 25: MEA Digital Experience Platform Market Revenue Share (%), by Country 2024 & 2032
- Figure 26: MEA Digital Experience Platform Market Volume Share (%), by Country 2024 & 2032
- Figure 27: North America Digital Experience Platform Market Revenue (Million), by Component 2024 & 2032
- Figure 28: North America Digital Experience Platform Market Volume (K Unit), by Component 2024 & 2032
- Figure 29: North America Digital Experience Platform Market Revenue Share (%), by Component 2024 & 2032
- Figure 30: North America Digital Experience Platform Market Volume Share (%), by Component 2024 & 2032
- Figure 31: North America Digital Experience Platform Market Revenue (Million), by Deployment Type 2024 & 2032
- Figure 32: North America Digital Experience Platform Market Volume (K Unit), by Deployment Type 2024 & 2032
- Figure 33: North America Digital Experience Platform Market Revenue Share (%), by Deployment Type 2024 & 2032
- Figure 34: North America Digital Experience Platform Market Volume Share (%), by Deployment Type 2024 & 2032
- Figure 35: North America Digital Experience Platform Market Revenue (Million), by End Users 2024 & 2032
- Figure 36: North America Digital Experience Platform Market Volume (K Unit), by End Users 2024 & 2032
- Figure 37: North America Digital Experience Platform Market Revenue Share (%), by End Users 2024 & 2032
- Figure 38: North America Digital Experience Platform Market Volume Share (%), by End Users 2024 & 2032
- Figure 39: North America Digital Experience Platform Market Revenue (Million), by Country 2024 & 2032
- Figure 40: North America Digital Experience Platform Market Volume (K Unit), by Country 2024 & 2032
- Figure 41: North America Digital Experience Platform Market Revenue Share (%), by Country 2024 & 2032
- Figure 42: North America Digital Experience Platform Market Volume Share (%), by Country 2024 & 2032
- Figure 43: Europe Digital Experience Platform Market Revenue (Million), by Component 2024 & 2032
- Figure 44: Europe Digital Experience Platform Market Volume (K Unit), by Component 2024 & 2032
- Figure 45: Europe Digital Experience Platform Market Revenue Share (%), by Component 2024 & 2032
- Figure 46: Europe Digital Experience Platform Market Volume Share (%), by Component 2024 & 2032
- Figure 47: Europe Digital Experience Platform Market Revenue (Million), by Deployment Type 2024 & 2032
- Figure 48: Europe Digital Experience Platform Market Volume (K Unit), by Deployment Type 2024 & 2032
- Figure 49: Europe Digital Experience Platform Market Revenue Share (%), by Deployment Type 2024 & 2032
- Figure 50: Europe Digital Experience Platform Market Volume Share (%), by Deployment Type 2024 & 2032
- Figure 51: Europe Digital Experience Platform Market Revenue (Million), by End Users 2024 & 2032
- Figure 52: Europe Digital Experience Platform Market Volume (K Unit), by End Users 2024 & 2032
- Figure 53: Europe Digital Experience Platform Market Revenue Share (%), by End Users 2024 & 2032
- Figure 54: Europe Digital Experience Platform Market Volume Share (%), by End Users 2024 & 2032
- Figure 55: Europe Digital Experience Platform Market Revenue (Million), by Country 2024 & 2032
- Figure 56: Europe Digital Experience Platform Market Volume (K Unit), by Country 2024 & 2032
- Figure 57: Europe Digital Experience Platform Market Revenue Share (%), by Country 2024 & 2032
- Figure 58: Europe Digital Experience Platform Market Volume Share (%), by Country 2024 & 2032
- Figure 59: Asia Digital Experience Platform Market Revenue (Million), by Component 2024 & 2032
- Figure 60: Asia Digital Experience Platform Market Volume (K Unit), by Component 2024 & 2032
- Figure 61: Asia Digital Experience Platform Market Revenue Share (%), by Component 2024 & 2032
- Figure 62: Asia Digital Experience Platform Market Volume Share (%), by Component 2024 & 2032
- Figure 63: Asia Digital Experience Platform Market Revenue (Million), by Deployment Type 2024 & 2032
- Figure 64: Asia Digital Experience Platform Market Volume (K Unit), by Deployment Type 2024 & 2032
- Figure 65: Asia Digital Experience Platform Market Revenue Share (%), by Deployment Type 2024 & 2032
- Figure 66: Asia Digital Experience Platform Market Volume Share (%), by Deployment Type 2024 & 2032
- Figure 67: Asia Digital Experience Platform Market Revenue (Million), by End Users 2024 & 2032
- Figure 68: Asia Digital Experience Platform Market Volume (K Unit), by End Users 2024 & 2032
- Figure 69: Asia Digital Experience Platform Market Revenue Share (%), by End Users 2024 & 2032
- Figure 70: Asia Digital Experience Platform Market Volume Share (%), by End Users 2024 & 2032
- Figure 71: Asia Digital Experience Platform Market Revenue (Million), by Country 2024 & 2032
- Figure 72: Asia Digital Experience Platform Market Volume (K Unit), by Country 2024 & 2032
- Figure 73: Asia Digital Experience Platform Market Revenue Share (%), by Country 2024 & 2032
- Figure 74: Asia Digital Experience Platform Market Volume Share (%), by Country 2024 & 2032
- Figure 75: Australia and New Zealand Digital Experience Platform Market Revenue (Million), by Component 2024 & 2032
- Figure 76: Australia and New Zealand Digital Experience Platform Market Volume (K Unit), by Component 2024 & 2032
- Figure 77: Australia and New Zealand Digital Experience Platform Market Revenue Share (%), by Component 2024 & 2032
- Figure 78: Australia and New Zealand Digital Experience Platform Market Volume Share (%), by Component 2024 & 2032
- Figure 79: Australia and New Zealand Digital Experience Platform Market Revenue (Million), by Deployment Type 2024 & 2032
- Figure 80: Australia and New Zealand Digital Experience Platform Market Volume (K Unit), by Deployment Type 2024 & 2032
- Figure 81: Australia and New Zealand Digital Experience Platform Market Revenue Share (%), by Deployment Type 2024 & 2032
- Figure 82: Australia and New Zealand Digital Experience Platform Market Volume Share (%), by Deployment Type 2024 & 2032
- Figure 83: Australia and New Zealand Digital Experience Platform Market Revenue (Million), by End Users 2024 & 2032
- Figure 84: Australia and New Zealand Digital Experience Platform Market Volume (K Unit), by End Users 2024 & 2032
- Figure 85: Australia and New Zealand Digital Experience Platform Market Revenue Share (%), by End Users 2024 & 2032
- Figure 86: Australia and New Zealand Digital Experience Platform Market Volume Share (%), by End Users 2024 & 2032
- Figure 87: Australia and New Zealand Digital Experience Platform Market Revenue (Million), by Country 2024 & 2032
- Figure 88: Australia and New Zealand Digital Experience Platform Market Volume (K Unit), by Country 2024 & 2032
- Figure 89: Australia and New Zealand Digital Experience Platform Market Revenue Share (%), by Country 2024 & 2032
- Figure 90: Australia and New Zealand Digital Experience Platform Market Volume Share (%), by Country 2024 & 2032
- Figure 91: Latin America Digital Experience Platform Market Revenue (Million), by Component 2024 & 2032
- Figure 92: Latin America Digital Experience Platform Market Volume (K Unit), by Component 2024 & 2032
- Figure 93: Latin America Digital Experience Platform Market Revenue Share (%), by Component 2024 & 2032
- Figure 94: Latin America Digital Experience Platform Market Volume Share (%), by Component 2024 & 2032
- Figure 95: Latin America Digital Experience Platform Market Revenue (Million), by Deployment Type 2024 & 2032
- Figure 96: Latin America Digital Experience Platform Market Volume (K Unit), by Deployment Type 2024 & 2032
- Figure 97: Latin America Digital Experience Platform Market Revenue Share (%), by Deployment Type 2024 & 2032
- Figure 98: Latin America Digital Experience Platform Market Volume Share (%), by Deployment Type 2024 & 2032
- Figure 99: Latin America Digital Experience Platform Market Revenue (Million), by End Users 2024 & 2032
- Figure 100: Latin America Digital Experience Platform Market Volume (K Unit), by End Users 2024 & 2032
- Figure 101: Latin America Digital Experience Platform Market Revenue Share (%), by End Users 2024 & 2032
- Figure 102: Latin America Digital Experience Platform Market Volume Share (%), by End Users 2024 & 2032
- Figure 103: Latin America Digital Experience Platform Market Revenue (Million), by Country 2024 & 2032
- Figure 104: Latin America Digital Experience Platform Market Volume (K Unit), by Country 2024 & 2032
- Figure 105: Latin America Digital Experience Platform Market Revenue Share (%), by Country 2024 & 2032
- Figure 106: Latin America Digital Experience Platform Market Volume Share (%), by Country 2024 & 2032
- Figure 107: Middle East and Africa Digital Experience Platform Market Revenue (Million), by Component 2024 & 2032
- Figure 108: Middle East and Africa Digital Experience Platform Market Volume (K Unit), by Component 2024 & 2032
- Figure 109: Middle East and Africa Digital Experience Platform Market Revenue Share (%), by Component 2024 & 2032
- Figure 110: Middle East and Africa Digital Experience Platform Market Volume Share (%), by Component 2024 & 2032
- Figure 111: Middle East and Africa Digital Experience Platform Market Revenue (Million), by Deployment Type 2024 & 2032
- Figure 112: Middle East and Africa Digital Experience Platform Market Volume (K Unit), by Deployment Type 2024 & 2032
- Figure 113: Middle East and Africa Digital Experience Platform Market Revenue Share (%), by Deployment Type 2024 & 2032
- Figure 114: Middle East and Africa Digital Experience Platform Market Volume Share (%), by Deployment Type 2024 & 2032
- Figure 115: Middle East and Africa Digital Experience Platform Market Revenue (Million), by End Users 2024 & 2032
- Figure 116: Middle East and Africa Digital Experience Platform Market Volume (K Unit), by End Users 2024 & 2032
- Figure 117: Middle East and Africa Digital Experience Platform Market Revenue Share (%), by End Users 2024 & 2032
- Figure 118: Middle East and Africa Digital Experience Platform Market Volume Share (%), by End Users 2024 & 2032
- Figure 119: Middle East and Africa Digital Experience Platform Market Revenue (Million), by Country 2024 & 2032
- Figure 120: Middle East and Africa Digital Experience Platform Market Volume (K Unit), by Country 2024 & 2032
- Figure 121: Middle East and Africa Digital Experience Platform Market Revenue Share (%), by Country 2024 & 2032
- Figure 122: Middle East and Africa Digital Experience Platform Market Volume Share (%), by Country 2024 & 2032
List of Tables
- Table 1: Global Digital Experience Platform Market Revenue Million Forecast, by Region 2019 & 2032
- Table 2: Global Digital Experience Platform Market Volume K Unit Forecast, by Region 2019 & 2032
- Table 3: Global Digital Experience Platform Market Revenue Million Forecast, by Component 2019 & 2032
- Table 4: Global Digital Experience Platform Market Volume K Unit Forecast, by Component 2019 & 2032
- Table 5: Global Digital Experience Platform Market Revenue Million Forecast, by Deployment Type 2019 & 2032
- Table 6: Global Digital Experience Platform Market Volume K Unit Forecast, by Deployment Type 2019 & 2032
- Table 7: Global Digital Experience Platform Market Revenue Million Forecast, by End Users 2019 & 2032
- Table 8: Global Digital Experience Platform Market Volume K Unit Forecast, by End Users 2019 & 2032
- Table 9: Global Digital Experience Platform Market Revenue Million Forecast, by Region 2019 & 2032
- Table 10: Global Digital Experience Platform Market Volume K Unit Forecast, by Region 2019 & 2032
- Table 11: Global Digital Experience Platform Market Revenue Million Forecast, by Country 2019 & 2032
- Table 12: Global Digital Experience Platform Market Volume K Unit Forecast, by Country 2019 & 2032
- Table 13: United States Digital Experience Platform Market Revenue (Million) Forecast, by Application 2019 & 2032
- Table 14: United States Digital Experience Platform Market Volume (K Unit) Forecast, by Application 2019 & 2032
- Table 15: Canada Digital Experience Platform Market Revenue (Million) Forecast, by Application 2019 & 2032
- Table 16: Canada Digital Experience Platform Market Volume (K Unit) Forecast, by Application 2019 & 2032
- Table 17: Mexico Digital Experience Platform Market Revenue (Million) Forecast, by Application 2019 & 2032
- Table 18: Mexico Digital Experience Platform Market Volume (K Unit) Forecast, by Application 2019 & 2032
- Table 19: Global Digital Experience Platform Market Revenue Million Forecast, by Country 2019 & 2032
- Table 20: Global Digital Experience Platform Market Volume K Unit Forecast, by Country 2019 & 2032
- Table 21: Germany Digital Experience Platform Market Revenue (Million) Forecast, by Application 2019 & 2032
- Table 22: Germany Digital Experience Platform Market Volume (K Unit) Forecast, by Application 2019 & 2032
- Table 23: United Kingdom Digital Experience Platform Market Revenue (Million) Forecast, by Application 2019 & 2032
- Table 24: United Kingdom Digital Experience Platform Market Volume (K Unit) Forecast, by Application 2019 & 2032
- Table 25: France Digital Experience Platform Market Revenue (Million) Forecast, by Application 2019 & 2032
- Table 26: France Digital Experience Platform Market Volume (K Unit) Forecast, by Application 2019 & 2032
- Table 27: Spain Digital Experience Platform Market Revenue (Million) Forecast, by Application 2019 & 2032
- Table 28: Spain Digital Experience Platform Market Volume (K Unit) Forecast, by Application 2019 & 2032
- Table 29: Italy Digital Experience Platform Market Revenue (Million) Forecast, by Application 2019 & 2032
- Table 30: Italy Digital Experience Platform Market Volume (K Unit) Forecast, by Application 2019 & 2032
- Table 31: Spain Digital Experience Platform Market Revenue (Million) Forecast, by Application 2019 & 2032
- Table 32: Spain Digital Experience Platform Market Volume (K Unit) Forecast, by Application 2019 & 2032
- Table 33: Belgium Digital Experience Platform Market Revenue (Million) Forecast, by Application 2019 & 2032
- Table 34: Belgium Digital Experience Platform Market Volume (K Unit) Forecast, by Application 2019 & 2032
- Table 35: Netherland Digital Experience Platform Market Revenue (Million) Forecast, by Application 2019 & 2032
- Table 36: Netherland Digital Experience Platform Market Volume (K Unit) Forecast, by Application 2019 & 2032
- Table 37: Nordics Digital Experience Platform Market Revenue (Million) Forecast, by Application 2019 & 2032
- Table 38: Nordics Digital Experience Platform Market Volume (K Unit) Forecast, by Application 2019 & 2032
- Table 39: Rest of Europe Digital Experience Platform Market Revenue (Million) Forecast, by Application 2019 & 2032
- Table 40: Rest of Europe Digital Experience Platform Market Volume (K Unit) Forecast, by Application 2019 & 2032
- Table 41: Global Digital Experience Platform Market Revenue Million Forecast, by Country 2019 & 2032
- Table 42: Global Digital Experience Platform Market Volume K Unit Forecast, by Country 2019 & 2032
- Table 43: China Digital Experience Platform Market Revenue (Million) Forecast, by Application 2019 & 2032
- Table 44: China Digital Experience Platform Market Volume (K Unit) Forecast, by Application 2019 & 2032
- Table 45: Japan Digital Experience Platform Market Revenue (Million) Forecast, by Application 2019 & 2032
- Table 46: Japan Digital Experience Platform Market Volume (K Unit) Forecast, by Application 2019 & 2032
- Table 47: India Digital Experience Platform Market Revenue (Million) Forecast, by Application 2019 & 2032
- Table 48: India Digital Experience Platform Market Volume (K Unit) Forecast, by Application 2019 & 2032
- Table 49: South Korea Digital Experience Platform Market Revenue (Million) Forecast, by Application 2019 & 2032
- Table 50: South Korea Digital Experience Platform Market Volume (K Unit) Forecast, by Application 2019 & 2032
- Table 51: Southeast Asia Digital Experience Platform Market Revenue (Million) Forecast, by Application 2019 & 2032
- Table 52: Southeast Asia Digital Experience Platform Market Volume (K Unit) Forecast, by Application 2019 & 2032
- Table 53: Australia Digital Experience Platform Market Revenue (Million) Forecast, by Application 2019 & 2032
- Table 54: Australia Digital Experience Platform Market Volume (K Unit) Forecast, by Application 2019 & 2032
- Table 55: Indonesia Digital Experience Platform Market Revenue (Million) Forecast, by Application 2019 & 2032
- Table 56: Indonesia Digital Experience Platform Market Volume (K Unit) Forecast, by Application 2019 & 2032
- Table 57: Phillipes Digital Experience Platform Market Revenue (Million) Forecast, by Application 2019 & 2032
- Table 58: Phillipes Digital Experience Platform Market Volume (K Unit) Forecast, by Application 2019 & 2032
- Table 59: Singapore Digital Experience Platform Market Revenue (Million) Forecast, by Application 2019 & 2032
- Table 60: Singapore Digital Experience Platform Market Volume (K Unit) Forecast, by Application 2019 & 2032
- Table 61: Thailandc Digital Experience Platform Market Revenue (Million) Forecast, by Application 2019 & 2032
- Table 62: Thailandc Digital Experience Platform Market Volume (K Unit) Forecast, by Application 2019 & 2032
- Table 63: Rest of Asia Pacific Digital Experience Platform Market Revenue (Million) Forecast, by Application 2019 & 2032
- Table 64: Rest of Asia Pacific Digital Experience Platform Market Volume (K Unit) Forecast, by Application 2019 & 2032
- Table 65: Global Digital Experience Platform Market Revenue Million Forecast, by Country 2019 & 2032
- Table 66: Global Digital Experience Platform Market Volume K Unit Forecast, by Country 2019 & 2032
- Table 67: Brazil Digital Experience Platform Market Revenue (Million) Forecast, by Application 2019 & 2032
- Table 68: Brazil Digital Experience Platform Market Volume (K Unit) Forecast, by Application 2019 & 2032
- Table 69: Argentina Digital Experience Platform Market Revenue (Million) Forecast, by Application 2019 & 2032
- Table 70: Argentina Digital Experience Platform Market Volume (K Unit) Forecast, by Application 2019 & 2032
- Table 71: Peru Digital Experience Platform Market Revenue (Million) Forecast, by Application 2019 & 2032
- Table 72: Peru Digital Experience Platform Market Volume (K Unit) Forecast, by Application 2019 & 2032
- Table 73: Chile Digital Experience Platform Market Revenue (Million) Forecast, by Application 2019 & 2032
- Table 74: Chile Digital Experience Platform Market Volume (K Unit) Forecast, by Application 2019 & 2032
- Table 75: Colombia Digital Experience Platform Market Revenue (Million) Forecast, by Application 2019 & 2032
- Table 76: Colombia Digital Experience Platform Market Volume (K Unit) Forecast, by Application 2019 & 2032
- Table 77: Ecuador Digital Experience Platform Market Revenue (Million) Forecast, by Application 2019 & 2032
- Table 78: Ecuador Digital Experience Platform Market Volume (K Unit) Forecast, by Application 2019 & 2032
- Table 79: Venezuela Digital Experience Platform Market Revenue (Million) Forecast, by Application 2019 & 2032
- Table 80: Venezuela Digital Experience Platform Market Volume (K Unit) Forecast, by Application 2019 & 2032
- Table 81: Rest of South America Digital Experience Platform Market Revenue (Million) Forecast, by Application 2019 & 2032
- Table 82: Rest of South America Digital Experience Platform Market Volume (K Unit) Forecast, by Application 2019 & 2032
- Table 83: Global Digital Experience Platform Market Revenue Million Forecast, by Country 2019 & 2032
- Table 84: Global Digital Experience Platform Market Volume K Unit Forecast, by Country 2019 & 2032
- Table 85: United States Digital Experience Platform Market Revenue (Million) Forecast, by Application 2019 & 2032
- Table 86: United States Digital Experience Platform Market Volume (K Unit) Forecast, by Application 2019 & 2032
- Table 87: Canada Digital Experience Platform Market Revenue (Million) Forecast, by Application 2019 & 2032
- Table 88: Canada Digital Experience Platform Market Volume (K Unit) Forecast, by Application 2019 & 2032
- Table 89: Mexico Digital Experience Platform Market Revenue (Million) Forecast, by Application 2019 & 2032
- Table 90: Mexico Digital Experience Platform Market Volume (K Unit) Forecast, by Application 2019 & 2032
- Table 91: Global Digital Experience Platform Market Revenue Million Forecast, by Country 2019 & 2032
- Table 92: Global Digital Experience Platform Market Volume K Unit Forecast, by Country 2019 & 2032
- Table 93: United Arab Emirates Digital Experience Platform Market Revenue (Million) Forecast, by Application 2019 & 2032
- Table 94: United Arab Emirates Digital Experience Platform Market Volume (K Unit) Forecast, by Application 2019 & 2032
- Table 95: Saudi Arabia Digital Experience Platform Market Revenue (Million) Forecast, by Application 2019 & 2032
- Table 96: Saudi Arabia Digital Experience Platform Market Volume (K Unit) Forecast, by Application 2019 & 2032
- Table 97: South Africa Digital Experience Platform Market Revenue (Million) Forecast, by Application 2019 & 2032
- Table 98: South Africa Digital Experience Platform Market Volume (K Unit) Forecast, by Application 2019 & 2032
- Table 99: Rest of Middle East and Africa Digital Experience Platform Market Revenue (Million) Forecast, by Application 2019 & 2032
- Table 100: Rest of Middle East and Africa Digital Experience Platform Market Volume (K Unit) Forecast, by Application 2019 & 2032
- Table 101: Global Digital Experience Platform Market Revenue Million Forecast, by Component 2019 & 2032
- Table 102: Global Digital Experience Platform Market Volume K Unit Forecast, by Component 2019 & 2032
- Table 103: Global Digital Experience Platform Market Revenue Million Forecast, by Deployment Type 2019 & 2032
- Table 104: Global Digital Experience Platform Market Volume K Unit Forecast, by Deployment Type 2019 & 2032
- Table 105: Global Digital Experience Platform Market Revenue Million Forecast, by End Users 2019 & 2032
- Table 106: Global Digital Experience Platform Market Volume K Unit Forecast, by End Users 2019 & 2032
- Table 107: Global Digital Experience Platform Market Revenue Million Forecast, by Country 2019 & 2032
- Table 108: Global Digital Experience Platform Market Volume K Unit Forecast, by Country 2019 & 2032
- Table 109: Global Digital Experience Platform Market Revenue Million Forecast, by Component 2019 & 2032
- Table 110: Global Digital Experience Platform Market Volume K Unit Forecast, by Component 2019 & 2032
- Table 111: Global Digital Experience Platform Market Revenue Million Forecast, by Deployment Type 2019 & 2032
- Table 112: Global Digital Experience Platform Market Volume K Unit Forecast, by Deployment Type 2019 & 2032
- Table 113: Global Digital Experience Platform Market Revenue Million Forecast, by End Users 2019 & 2032
- Table 114: Global Digital Experience Platform Market Volume K Unit Forecast, by End Users 2019 & 2032
- Table 115: Global Digital Experience Platform Market Revenue Million Forecast, by Country 2019 & 2032
- Table 116: Global Digital Experience Platform Market Volume K Unit Forecast, by Country 2019 & 2032
- Table 117: Global Digital Experience Platform Market Revenue Million Forecast, by Component 2019 & 2032
- Table 118: Global Digital Experience Platform Market Volume K Unit Forecast, by Component 2019 & 2032
- Table 119: Global Digital Experience Platform Market Revenue Million Forecast, by Deployment Type 2019 & 2032
- Table 120: Global Digital Experience Platform Market Volume K Unit Forecast, by Deployment Type 2019 & 2032
- Table 121: Global Digital Experience Platform Market Revenue Million Forecast, by End Users 2019 & 2032
- Table 122: Global Digital Experience Platform Market Volume K Unit Forecast, by End Users 2019 & 2032
- Table 123: Global Digital Experience Platform Market Revenue Million Forecast, by Country 2019 & 2032
- Table 124: Global Digital Experience Platform Market Volume K Unit Forecast, by Country 2019 & 2032
- Table 125: Global Digital Experience Platform Market Revenue Million Forecast, by Component 2019 & 2032
- Table 126: Global Digital Experience Platform Market Volume K Unit Forecast, by Component 2019 & 2032
- Table 127: Global Digital Experience Platform Market Revenue Million Forecast, by Deployment Type 2019 & 2032
- Table 128: Global Digital Experience Platform Market Volume K Unit Forecast, by Deployment Type 2019 & 2032
- Table 129: Global Digital Experience Platform Market Revenue Million Forecast, by End Users 2019 & 2032
- Table 130: Global Digital Experience Platform Market Volume K Unit Forecast, by End Users 2019 & 2032
- Table 131: Global Digital Experience Platform Market Revenue Million Forecast, by Country 2019 & 2032
- Table 132: Global Digital Experience Platform Market Volume K Unit Forecast, by Country 2019 & 2032
- Table 133: Global Digital Experience Platform Market Revenue Million Forecast, by Component 2019 & 2032
- Table 134: Global Digital Experience Platform Market Volume K Unit Forecast, by Component 2019 & 2032
- Table 135: Global Digital Experience Platform Market Revenue Million Forecast, by Deployment Type 2019 & 2032
- Table 136: Global Digital Experience Platform Market Volume K Unit Forecast, by Deployment Type 2019 & 2032
- Table 137: Global Digital Experience Platform Market Revenue Million Forecast, by End Users 2019 & 2032
- Table 138: Global Digital Experience Platform Market Volume K Unit Forecast, by End Users 2019 & 2032
- Table 139: Global Digital Experience Platform Market Revenue Million Forecast, by Country 2019 & 2032
- Table 140: Global Digital Experience Platform Market Volume K Unit Forecast, by Country 2019 & 2032
- Table 141: Global Digital Experience Platform Market Revenue Million Forecast, by Component 2019 & 2032
- Table 142: Global Digital Experience Platform Market Volume K Unit Forecast, by Component 2019 & 2032
- Table 143: Global Digital Experience Platform Market Revenue Million Forecast, by Deployment Type 2019 & 2032
- Table 144: Global Digital Experience Platform Market Volume K Unit Forecast, by Deployment Type 2019 & 2032
- Table 145: Global Digital Experience Platform Market Revenue Million Forecast, by End Users 2019 & 2032
- Table 146: Global Digital Experience Platform Market Volume K Unit Forecast, by End Users 2019 & 2032
- Table 147: Global Digital Experience Platform Market Revenue Million Forecast, by Country 2019 & 2032
- Table 148: Global Digital Experience Platform Market Volume K Unit Forecast, by Country 2019 & 2032
Frequently Asked Questions
1. What is the projected Compound Annual Growth Rate (CAGR) of the Digital Experience Platform Market?
The projected CAGR is approximately 13.48%.
2. Which companies are prominent players in the Digital Experience Platform Market?
Key companies in the market include SDL PLC, Salesforce Inc, OpenText Corporation, IBM Corporation, Acqui, Microsoft Corporation, Adobe Inc, Oracle Corporation, Sitecore, SAP SE.
3. What are the main segments of the Digital Experience Platform Market?
The market segments include Component, Deployment Type, End Users.
4. Can you provide details about the market size?
The market size is estimated to be USD 14.08 Million as of 2022.
5. What are some drivers contributing to market growth?
Growing Deployment of Cloud-Based Solutions; Rising Demand for big Data Analytics.
6. What are the notable trends driving market growth?
On Cloud Deployment to Drive the Market Growth.
7. Are there any restraints impacting market growth?
Privacy and Data Security Issues.
8. Can you provide examples of recent developments in the market?
December 2022- The Bank of Thailand (BOT) has chosen Oracle Fusion Cloud Human Capital Management (HCM), a comprehensive HR system, to promote a digital workforce with a better employee experience. The BOT can reduce manual processes and improve workflows with Oracle Cloud HCM.
9. What pricing options are available for accessing the report?
Pricing options include single-user, multi-user, and enterprise licenses priced at USD 4750, USD 5250, and USD 8750 respectively.
10. Is the market size provided in terms of value or volume?
The market size is provided in terms of value, measured in Million and volume, measured in K Unit.
11. Are there any specific market keywords associated with the report?
Yes, the market keyword associated with the report is "Digital Experience Platform Market," which aids in identifying and referencing the specific market segment covered.
12. How do I determine which pricing option suits my needs best?
The pricing options vary based on user requirements and access needs. Individual users may opt for single-user licenses, while businesses requiring broader access may choose multi-user or enterprise licenses for cost-effective access to the report.
13. Are there any additional resources or data provided in the Digital Experience Platform Market report?
While the report offers comprehensive insights, it's advisable to review the specific contents or supplementary materials provided to ascertain if additional resources or data are available.
14. How can I stay updated on further developments or reports in the Digital Experience Platform Market?
To stay informed about further developments, trends, and reports in the Digital Experience Platform Market, consider subscribing to industry newsletters, following relevant companies and organizations, or regularly checking reputable industry news sources and publications.
Methodology
Step 1 - Identification of Relevant Samples Size from Population Database


Step 2 - Approaches for Defining Global Market Size (Value, Volume* & Price*)

Note*: In applicable scenarios
Step 3 - Data Sources
Primary Research
- Web Analytics
- Survey Reports
- Research Institute
- Latest Research Reports
- Opinion Leaders
Secondary Research
- Annual Reports
- White Paper
- Latest Press Release
- Industry Association
- Paid Database
- Investor Presentations

Step 4 - Data Triangulation
Involves using different sources of information in order to increase the validity of a study
These sources are likely to be stakeholders in a program - participants, other researchers, program staff, other community members, and so on.
Then we put all data in single framework & apply various statistical tools to find out the dynamic on the market.
During the analysis stage, feedback from the stakeholder groups would be compared to determine areas of agreement as well as areas of divergence


