
Key Insights
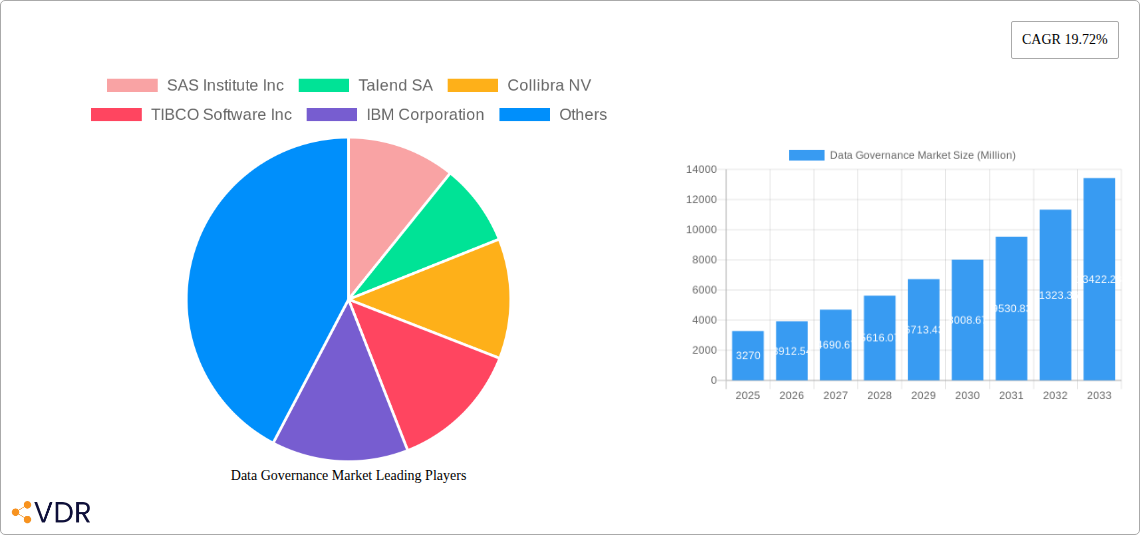
The Data Governance market is experiencing robust growth, projected to reach \$3.27 billion in 2025 and exhibiting a Compound Annual Growth Rate (CAGR) of 19.72% from 2025 to 2033. This expansion is fueled by several key drivers. The increasing volume and complexity of data, coupled with stringent regulatory compliance requirements (like GDPR and CCPA), are compelling organizations across all sectors to prioritize data governance strategies. Furthermore, the rise of cloud computing and big data analytics necessitates robust data governance frameworks to ensure data quality, security, and accessibility. The shift towards data-driven decision-making across various business functions, including operations, IT, finance, and legal, is further bolstering market demand. Small and medium-scale businesses are increasingly adopting data governance solutions, driven by the need to improve operational efficiency and gain a competitive edge. While on-premise deployments remain relevant, the cloud deployment model dominates, offering scalability, cost-effectiveness, and enhanced accessibility.
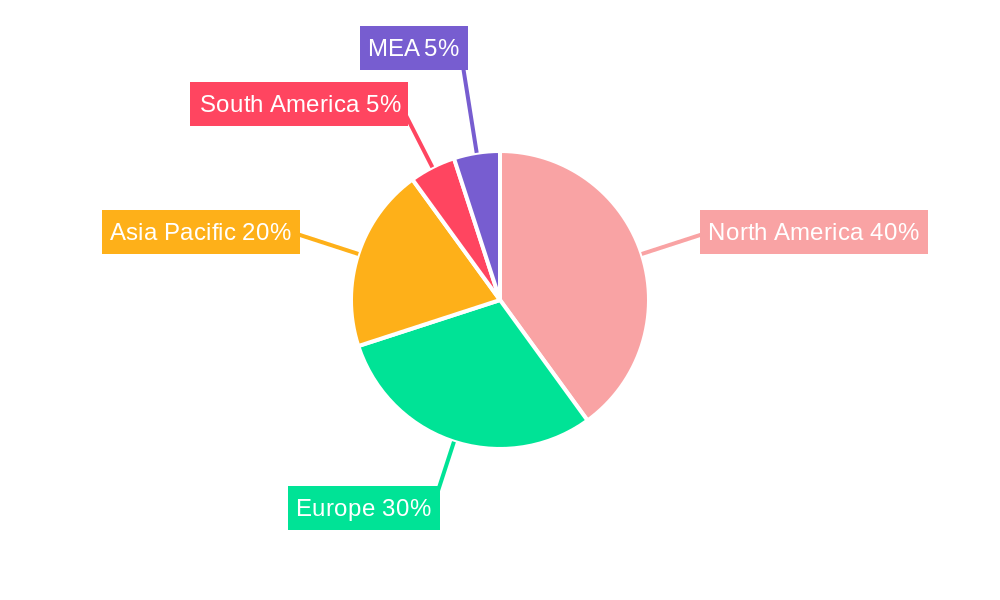
Market segmentation reveals significant opportunities. The software component holds a larger market share compared to services, reflecting the growing demand for comprehensive data governance platforms. The North American market currently leads in adoption, followed by Europe and the Asia-Pacific region. However, significant growth potential exists in emerging economies, driven by increasing digitalization and expanding data infrastructure. While the market faces restraints like the initial high investment costs associated with implementing data governance solutions and the lack of skilled professionals, the long-term benefits in terms of improved data quality, risk mitigation, and compliance outweigh these challenges. Key players like SAS Institute, Talend, Collibra, and IBM are actively shaping the market through innovation and strategic partnerships. The continued focus on data security, AI-driven data governance tools, and integration with other enterprise solutions will further accelerate market growth in the coming years.
Data Governance Market Report: 2019-2033
This comprehensive report provides a detailed analysis of the Data Governance market, encompassing market dynamics, growth trends, regional dominance, product landscape, key players, and future outlook. The study period covers 2019-2033, with 2025 as the base and estimated year. The forecast period spans 2025-2033, and the historical period encompasses 2019-2024. The report segments the market by deployment (cloud, on-premise), organization size (large-scale, small- and medium-scale businesses), component (software, service), business function (operations & IT, legal, finance, other), and end-user industry (IT & Telecom, healthcare, retail, defense, BFSI, others). The total market size is projected to reach xx Million by 2033.
Data Governance Market Dynamics & Structure
The Data Governance market is experiencing significant growth, driven by increasing data volumes, stringent regulatory compliance needs, and the rising demand for improved data quality. Market concentration is moderate, with several key players vying for market share. Technological innovation, particularly in AI and machine learning, is a major driver. However, challenges remain, including the complexity of implementing data governance solutions and the need for skilled professionals.
- Market Concentration: Moderately concentrated, with the top 5 players holding an estimated xx% market share in 2025.
- Technological Innovation: AI, machine learning, and automation are key drivers, improving data quality and efficiency.
- Regulatory Frameworks: GDPR, CCPA, and other regulations are driving adoption of data governance solutions.
- Competitive Product Substitutes: Limited, with most solutions offering unique functionalities.
- M&A Trends: A moderate number of M&A deals were observed in the historical period (2019-2024), with an average of xx deals per year. This trend is expected to continue due to increased competition and consolidation.
- End-user Demographics: Large-scale businesses dominate the market, but adoption is growing among SMEs.
Data Governance Market Growth Trends & Insights
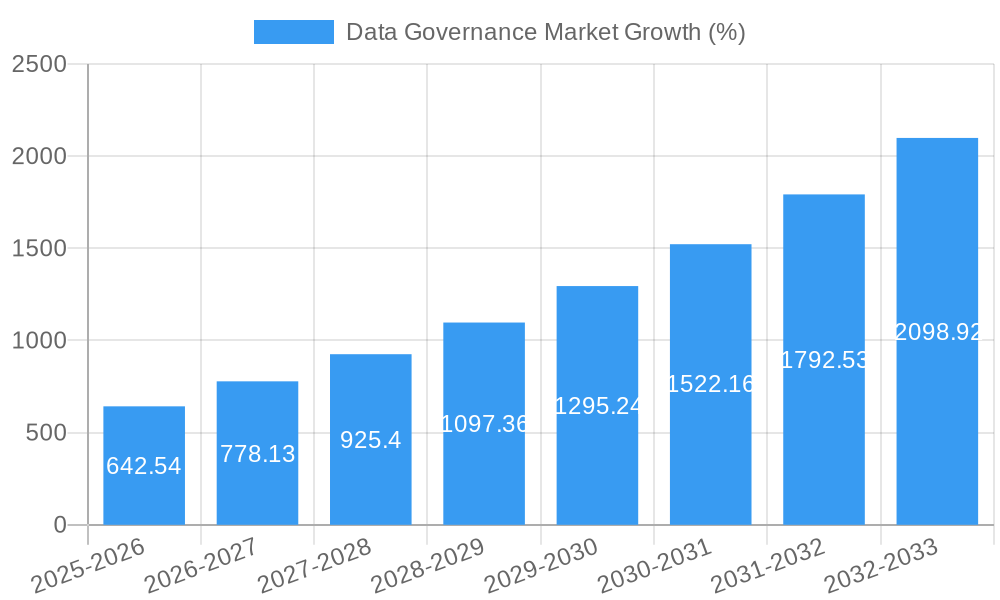
The Data Governance market exhibits a robust growth trajectory, fueled by the increasing need for data-driven decision-making across various industries. The market size experienced significant growth during the historical period (2019-2024), expanding from xx Million in 2019 to xx Million in 2024 at a CAGR of xx%. This growth is expected to continue through the forecast period (2025-2033), reaching xx Million by 2033, with a projected CAGR of xx%. The increasing adoption of cloud-based solutions, coupled with the rising awareness of data security and compliance, is a key driver of this expansion. Market penetration is currently at xx% and is expected to reach xx% by 2033. Technological disruptions, such as the rise of AI-powered data governance tools, are further accelerating market growth. Shifting consumer behavior, which favors data-driven insights and personalized experiences, also plays a crucial role.
Dominant Regions, Countries, or Segments in Data Governance Market
North America currently holds the largest market share, followed by Europe. The strong presence of key players and high technological adoption rates in these regions contribute to their dominance. However, the Asia-Pacific region is witnessing rapid growth, driven by increasing digitalization and government initiatives.
- Dominant Segment: Cloud deployment holds the largest market share due to its scalability and cost-effectiveness. Large-scale businesses also form a significant portion of the market due to their higher budgets and greater data management needs.
- Key Regional Drivers: North America: Strong regulatory environment and high technological adoption. Europe: Stringent data privacy regulations. Asia-Pacific: Rapid digitalization and government investments.
- Growth Potential: The Asia-Pacific region is expected to witness the highest growth rate due to increased adoption across several industries.
Data Governance Market Product Landscape
The market offers a diverse range of products, including data cataloging, data quality management, data lineage tracking, and metadata management solutions. Recent innovations focus on AI-powered automation, enhanced security features, and seamless integration with existing enterprise systems. Key features driving adoption include improved data visibility, reduced data silos, and enhanced compliance capabilities.
Key Drivers, Barriers & Challenges in Data Governance Market
Key Drivers: Increasing data volumes, stringent data privacy regulations (GDPR, CCPA), growing need for data-driven decision-making, and the rising adoption of cloud-based solutions.
Key Challenges: High implementation costs, lack of skilled professionals, integration complexity with existing systems, and concerns about data security and privacy breaches. The market faces supply chain disruptions causing delays in implementation and increased costs. Regulatory hurdles and strict compliance requirements also pose significant challenges. Competitive pressure from established players and new entrants further adds complexity.
Emerging Opportunities in Data Governance Market
Emerging opportunities include the growing demand for data governance solutions in the healthcare, BFSI, and retail sectors. The increasing adoption of AI and machine learning in data governance tools presents new opportunities. The expansion of data governance solutions to handle unstructured data is a significant opportunity.
Growth Accelerators in the Data Governance Market Industry
Strategic partnerships between data governance vendors and cloud providers will greatly accelerate market growth. Technological advancements like AI and machine learning will continue to enhance data quality, security, and compliance. Market expansion into untapped regions, particularly in developing economies, presents significant growth opportunities.
Key Players Shaping the Data Governance Market Market
- SAS Institute Inc
- Talend SA
- Collibra NV
- TIBCO Software Inc
- IBM Corporation
- Informatica Inc
- Microsoft Corporation
- Symantec Corporation (Norton Lifelock)
- Alation Inc
- Varonis Systems Inc
- Oracle Corporation
- Alfresco Software Inc
- SAP SE
Notable Milestones in Data Governance Market Sector
- June 2023: Oracle announced plans to develop powerful, generative AI services for organizations globally, enhancing automation and decision-making.
- May 2023: Informatica unveiled significant innovations to its AI-Powered Intelligent Data Management Cloud (IDMC), boosting efficiency and reducing costs for enterprises.
In-Depth Data Governance Market Market Outlook
The Data Governance market is poised for sustained growth, driven by ongoing technological advancements, increasing data volumes, and the imperative for robust data security and compliance. Strategic partnerships, expansion into new markets, and the development of innovative solutions will shape the future landscape, presenting significant opportunities for both established players and new entrants. The market’s potential lies in its ability to empower organizations to leverage their data effectively and responsibly, driving better business outcomes.
Data Governance Market Segmentation
-
1. Deployment
- 1.1. Cloud
- 1.2. On-premise
-
2. Organization Size
- 2.1. Large-scale Business
- 2.2. Small- and Medium-scale Business
-
3. Component
- 3.1. Software
- 3.2. Service
-
4. Business Function
- 4.1. Operation and IT
- 4.2. Legal
- 4.3. Finance
- 4.4. Other Business Functions
-
5. End-user Industry
- 5.1. IT and Telecom
- 5.2. Healthcare
- 5.3. Retail
- 5.4. Defense
- 5.5. BFSI
- 5.6. Other End-user Industries
Data Governance Market Segmentation By Geography
- 1. North America
- 2. Europe
- 3. Asia Pacific
- 4. Latin America
- 5. Middle East and Africa
Data Governance Market REPORT HIGHLIGHTS
| Aspects | Details |
|---|---|
| Study Period | 2019-2033 |
| Base Year | 2024 |
| Estimated Year | 2025 |
| Forecast Period | 2025-2033 |
| Historical Period | 2019-2024 |
| Growth Rate | CAGR of 19.72% from 2019-2033 |
| Segmentation |
|
Table of Contents
- 1. Introduction
- 1.1. Research Scope
- 1.2. Market Segmentation
- 1.3. Research Methodology
- 1.4. Definitions and Assumptions
- 2. Executive Summary
- 2.1. Introduction
- 3. Market Dynamics
- 3.1. Introduction
- 3.2. Market Drivers
- 3.2.1. Rising Regulatory and Compliance Mandates; Growth of Data Volume
- 3.3. Market Restrains
- 3.3.1. Varying Structure of Regulatory Policies and Data Address Validation
- 3.4. Market Trends
- 3.4.1. Healthcare Sector Expected to Exhibit Significant Growth Rate
- 4. Market Factor Analysis
- 4.1. Porters Five Forces
- 4.2. Supply/Value Chain
- 4.3. PESTEL analysis
- 4.4. Market Entropy
- 4.5. Patent/Trademark Analysis
- 5. Global Data Governance Market Analysis, Insights and Forecast, 2019-2031
- 5.1. Market Analysis, Insights and Forecast - by Deployment
- 5.1.1. Cloud
- 5.1.2. On-premise
- 5.2. Market Analysis, Insights and Forecast - by Organization Size
- 5.2.1. Large-scale Business
- 5.2.2. Small- and Medium-scale Business
- 5.3. Market Analysis, Insights and Forecast - by Component
- 5.3.1. Software
- 5.3.2. Service
- 5.4. Market Analysis, Insights and Forecast - by Business Function
- 5.4.1. Operation and IT
- 5.4.2. Legal
- 5.4.3. Finance
- 5.4.4. Other Business Functions
- 5.5. Market Analysis, Insights and Forecast - by End-user Industry
- 5.5.1. IT and Telecom
- 5.5.2. Healthcare
- 5.5.3. Retail
- 5.5.4. Defense
- 5.5.5. BFSI
- 5.5.6. Other End-user Industries
- 5.6. Market Analysis, Insights and Forecast - by Region
- 5.6.1. North America
- 5.6.2. Europe
- 5.6.3. Asia Pacific
- 5.6.4. Latin America
- 5.6.5. Middle East and Africa
- 5.1. Market Analysis, Insights and Forecast - by Deployment
- 6. North America Data Governance Market Analysis, Insights and Forecast, 2019-2031
- 6.1. Market Analysis, Insights and Forecast - by Deployment
- 6.1.1. Cloud
- 6.1.2. On-premise
- 6.2. Market Analysis, Insights and Forecast - by Organization Size
- 6.2.1. Large-scale Business
- 6.2.2. Small- and Medium-scale Business
- 6.3. Market Analysis, Insights and Forecast - by Component
- 6.3.1. Software
- 6.3.2. Service
- 6.4. Market Analysis, Insights and Forecast - by Business Function
- 6.4.1. Operation and IT
- 6.4.2. Legal
- 6.4.3. Finance
- 6.4.4. Other Business Functions
- 6.5. Market Analysis, Insights and Forecast - by End-user Industry
- 6.5.1. IT and Telecom
- 6.5.2. Healthcare
- 6.5.3. Retail
- 6.5.4. Defense
- 6.5.5. BFSI
- 6.5.6. Other End-user Industries
- 6.1. Market Analysis, Insights and Forecast - by Deployment
- 7. Europe Data Governance Market Analysis, Insights and Forecast, 2019-2031
- 7.1. Market Analysis, Insights and Forecast - by Deployment
- 7.1.1. Cloud
- 7.1.2. On-premise
- 7.2. Market Analysis, Insights and Forecast - by Organization Size
- 7.2.1. Large-scale Business
- 7.2.2. Small- and Medium-scale Business
- 7.3. Market Analysis, Insights and Forecast - by Component
- 7.3.1. Software
- 7.3.2. Service
- 7.4. Market Analysis, Insights and Forecast - by Business Function
- 7.4.1. Operation and IT
- 7.4.2. Legal
- 7.4.3. Finance
- 7.4.4. Other Business Functions
- 7.5. Market Analysis, Insights and Forecast - by End-user Industry
- 7.5.1. IT and Telecom
- 7.5.2. Healthcare
- 7.5.3. Retail
- 7.5.4. Defense
- 7.5.5. BFSI
- 7.5.6. Other End-user Industries
- 7.1. Market Analysis, Insights and Forecast - by Deployment
- 8. Asia Pacific Data Governance Market Analysis, Insights and Forecast, 2019-2031
- 8.1. Market Analysis, Insights and Forecast - by Deployment
- 8.1.1. Cloud
- 8.1.2. On-premise
- 8.2. Market Analysis, Insights and Forecast - by Organization Size
- 8.2.1. Large-scale Business
- 8.2.2. Small- and Medium-scale Business
- 8.3. Market Analysis, Insights and Forecast - by Component
- 8.3.1. Software
- 8.3.2. Service
- 8.4. Market Analysis, Insights and Forecast - by Business Function
- 8.4.1. Operation and IT
- 8.4.2. Legal
- 8.4.3. Finance
- 8.4.4. Other Business Functions
- 8.5. Market Analysis, Insights and Forecast - by End-user Industry
- 8.5.1. IT and Telecom
- 8.5.2. Healthcare
- 8.5.3. Retail
- 8.5.4. Defense
- 8.5.5. BFSI
- 8.5.6. Other End-user Industries
- 8.1. Market Analysis, Insights and Forecast - by Deployment
- 9. Latin America Data Governance Market Analysis, Insights and Forecast, 2019-2031
- 9.1. Market Analysis, Insights and Forecast - by Deployment
- 9.1.1. Cloud
- 9.1.2. On-premise
- 9.2. Market Analysis, Insights and Forecast - by Organization Size
- 9.2.1. Large-scale Business
- 9.2.2. Small- and Medium-scale Business
- 9.3. Market Analysis, Insights and Forecast - by Component
- 9.3.1. Software
- 9.3.2. Service
- 9.4. Market Analysis, Insights and Forecast - by Business Function
- 9.4.1. Operation and IT
- 9.4.2. Legal
- 9.4.3. Finance
- 9.4.4. Other Business Functions
- 9.5. Market Analysis, Insights and Forecast - by End-user Industry
- 9.5.1. IT and Telecom
- 9.5.2. Healthcare
- 9.5.3. Retail
- 9.5.4. Defense
- 9.5.5. BFSI
- 9.5.6. Other End-user Industries
- 9.1. Market Analysis, Insights and Forecast - by Deployment
- 10. Middle East and Africa Data Governance Market Analysis, Insights and Forecast, 2019-2031
- 10.1. Market Analysis, Insights and Forecast - by Deployment
- 10.1.1. Cloud
- 10.1.2. On-premise
- 10.2. Market Analysis, Insights and Forecast - by Organization Size
- 10.2.1. Large-scale Business
- 10.2.2. Small- and Medium-scale Business
- 10.3. Market Analysis, Insights and Forecast - by Component
- 10.3.1. Software
- 10.3.2. Service
- 10.4. Market Analysis, Insights and Forecast - by Business Function
- 10.4.1. Operation and IT
- 10.4.2. Legal
- 10.4.3. Finance
- 10.4.4. Other Business Functions
- 10.5. Market Analysis, Insights and Forecast - by End-user Industry
- 10.5.1. IT and Telecom
- 10.5.2. Healthcare
- 10.5.3. Retail
- 10.5.4. Defense
- 10.5.5. BFSI
- 10.5.6. Other End-user Industries
- 10.1. Market Analysis, Insights and Forecast - by Deployment
- 11. North America Data Governance Market Analysis, Insights and Forecast, 2019-2031
- 11.1. Market Analysis, Insights and Forecast - By Country/Sub-region
- 11.1.1 United States
- 11.1.2 Canada
- 11.1.3 Mexico
- 12. Europe Data Governance Market Analysis, Insights and Forecast, 2019-2031
- 12.1. Market Analysis, Insights and Forecast - By Country/Sub-region
- 12.1.1 Germany
- 12.1.2 United Kingdom
- 12.1.3 France
- 12.1.4 Spain
- 12.1.5 Italy
- 12.1.6 Spain
- 12.1.7 Belgium
- 12.1.8 Netherland
- 12.1.9 Nordics
- 12.1.10 Rest of Europe
- 13. Asia Pacific Data Governance Market Analysis, Insights and Forecast, 2019-2031
- 13.1. Market Analysis, Insights and Forecast - By Country/Sub-region
- 13.1.1 China
- 13.1.2 Japan
- 13.1.3 India
- 13.1.4 South Korea
- 13.1.5 Southeast Asia
- 13.1.6 Australia
- 13.1.7 Indonesia
- 13.1.8 Phillipes
- 13.1.9 Singapore
- 13.1.10 Thailandc
- 13.1.11 Rest of Asia Pacific
- 14. South America Data Governance Market Analysis, Insights and Forecast, 2019-2031
- 14.1. Market Analysis, Insights and Forecast - By Country/Sub-region
- 14.1.1 Brazil
- 14.1.2 Argentina
- 14.1.3 Peru
- 14.1.4 Chile
- 14.1.5 Colombia
- 14.1.6 Ecuador
- 14.1.7 Venezuela
- 14.1.8 Rest of South America
- 15. North America Data Governance Market Analysis, Insights and Forecast, 2019-2031
- 15.1. Market Analysis, Insights and Forecast - By Country/Sub-region
- 15.1.1 United States
- 15.1.2 Canada
- 15.1.3 Mexico
- 16. MEA Data Governance Market Analysis, Insights and Forecast, 2019-2031
- 16.1. Market Analysis, Insights and Forecast - By Country/Sub-region
- 16.1.1 United Arab Emirates
- 16.1.2 Saudi Arabia
- 16.1.3 South Africa
- 16.1.4 Rest of Middle East and Africa
- 17. Competitive Analysis
- 17.1. Global Market Share Analysis 2024
- 17.2. Company Profiles
- 17.2.1 SAS Institute Inc
- 17.2.1.1. Overview
- 17.2.1.2. Products
- 17.2.1.3. SWOT Analysis
- 17.2.1.4. Recent Developments
- 17.2.1.5. Financials (Based on Availability)
- 17.2.2 Talend SA
- 17.2.2.1. Overview
- 17.2.2.2. Products
- 17.2.2.3. SWOT Analysis
- 17.2.2.4. Recent Developments
- 17.2.2.5. Financials (Based on Availability)
- 17.2.3 Collibra NV
- 17.2.3.1. Overview
- 17.2.3.2. Products
- 17.2.3.3. SWOT Analysis
- 17.2.3.4. Recent Developments
- 17.2.3.5. Financials (Based on Availability)
- 17.2.4 TIBCO Software Inc
- 17.2.4.1. Overview
- 17.2.4.2. Products
- 17.2.4.3. SWOT Analysis
- 17.2.4.4. Recent Developments
- 17.2.4.5. Financials (Based on Availability)
- 17.2.5 IBM Corporation
- 17.2.5.1. Overview
- 17.2.5.2. Products
- 17.2.5.3. SWOT Analysis
- 17.2.5.4. Recent Developments
- 17.2.5.5. Financials (Based on Availability)
- 17.2.6 Informatica Inc
- 17.2.6.1. Overview
- 17.2.6.2. Products
- 17.2.6.3. SWOT Analysis
- 17.2.6.4. Recent Developments
- 17.2.6.5. Financials (Based on Availability)
- 17.2.7 Microsoft Corporation
- 17.2.7.1. Overview
- 17.2.7.2. Products
- 17.2.7.3. SWOT Analysis
- 17.2.7.4. Recent Developments
- 17.2.7.5. Financials (Based on Availability)
- 17.2.8 Symantec Corporation (Norton Lifelock)
- 17.2.8.1. Overview
- 17.2.8.2. Products
- 17.2.8.3. SWOT Analysis
- 17.2.8.4. Recent Developments
- 17.2.8.5. Financials (Based on Availability)
- 17.2.9 Alation Inc
- 17.2.9.1. Overview
- 17.2.9.2. Products
- 17.2.9.3. SWOT Analysis
- 17.2.9.4. Recent Developments
- 17.2.9.5. Financials (Based on Availability)
- 17.2.10 Varonis Systems Inc
- 17.2.10.1. Overview
- 17.2.10.2. Products
- 17.2.10.3. SWOT Analysis
- 17.2.10.4. Recent Developments
- 17.2.10.5. Financials (Based on Availability)
- 17.2.11 Oracle Corporation
- 17.2.11.1. Overview
- 17.2.11.2. Products
- 17.2.11.3. SWOT Analysis
- 17.2.11.4. Recent Developments
- 17.2.11.5. Financials (Based on Availability)
- 17.2.12 Alfresco Software Inc
- 17.2.12.1. Overview
- 17.2.12.2. Products
- 17.2.12.3. SWOT Analysis
- 17.2.12.4. Recent Developments
- 17.2.12.5. Financials (Based on Availability)
- 17.2.13 SAP SE
- 17.2.13.1. Overview
- 17.2.13.2. Products
- 17.2.13.3. SWOT Analysis
- 17.2.13.4. Recent Developments
- 17.2.13.5. Financials (Based on Availability)
- 17.2.1 SAS Institute Inc
List of Figures
- Figure 1: Global Data Governance Market Revenue Breakdown (Million, %) by Region 2024 & 2032
- Figure 2: North America Data Governance Market Revenue (Million), by Country 2024 & 2032
- Figure 3: North America Data Governance Market Revenue Share (%), by Country 2024 & 2032
- Figure 4: Europe Data Governance Market Revenue (Million), by Country 2024 & 2032
- Figure 5: Europe Data Governance Market Revenue Share (%), by Country 2024 & 2032
- Figure 6: Asia Pacific Data Governance Market Revenue (Million), by Country 2024 & 2032
- Figure 7: Asia Pacific Data Governance Market Revenue Share (%), by Country 2024 & 2032
- Figure 8: South America Data Governance Market Revenue (Million), by Country 2024 & 2032
- Figure 9: South America Data Governance Market Revenue Share (%), by Country 2024 & 2032
- Figure 10: North America Data Governance Market Revenue (Million), by Country 2024 & 2032
- Figure 11: North America Data Governance Market Revenue Share (%), by Country 2024 & 2032
- Figure 12: MEA Data Governance Market Revenue (Million), by Country 2024 & 2032
- Figure 13: MEA Data Governance Market Revenue Share (%), by Country 2024 & 2032
- Figure 14: North America Data Governance Market Revenue (Million), by Deployment 2024 & 2032
- Figure 15: North America Data Governance Market Revenue Share (%), by Deployment 2024 & 2032
- Figure 16: North America Data Governance Market Revenue (Million), by Organization Size 2024 & 2032
- Figure 17: North America Data Governance Market Revenue Share (%), by Organization Size 2024 & 2032
- Figure 18: North America Data Governance Market Revenue (Million), by Component 2024 & 2032
- Figure 19: North America Data Governance Market Revenue Share (%), by Component 2024 & 2032
- Figure 20: North America Data Governance Market Revenue (Million), by Business Function 2024 & 2032
- Figure 21: North America Data Governance Market Revenue Share (%), by Business Function 2024 & 2032
- Figure 22: North America Data Governance Market Revenue (Million), by End-user Industry 2024 & 2032
- Figure 23: North America Data Governance Market Revenue Share (%), by End-user Industry 2024 & 2032
- Figure 24: North America Data Governance Market Revenue (Million), by Country 2024 & 2032
- Figure 25: North America Data Governance Market Revenue Share (%), by Country 2024 & 2032
- Figure 26: Europe Data Governance Market Revenue (Million), by Deployment 2024 & 2032
- Figure 27: Europe Data Governance Market Revenue Share (%), by Deployment 2024 & 2032
- Figure 28: Europe Data Governance Market Revenue (Million), by Organization Size 2024 & 2032
- Figure 29: Europe Data Governance Market Revenue Share (%), by Organization Size 2024 & 2032
- Figure 30: Europe Data Governance Market Revenue (Million), by Component 2024 & 2032
- Figure 31: Europe Data Governance Market Revenue Share (%), by Component 2024 & 2032
- Figure 32: Europe Data Governance Market Revenue (Million), by Business Function 2024 & 2032
- Figure 33: Europe Data Governance Market Revenue Share (%), by Business Function 2024 & 2032
- Figure 34: Europe Data Governance Market Revenue (Million), by End-user Industry 2024 & 2032
- Figure 35: Europe Data Governance Market Revenue Share (%), by End-user Industry 2024 & 2032
- Figure 36: Europe Data Governance Market Revenue (Million), by Country 2024 & 2032
- Figure 37: Europe Data Governance Market Revenue Share (%), by Country 2024 & 2032
- Figure 38: Asia Pacific Data Governance Market Revenue (Million), by Deployment 2024 & 2032
- Figure 39: Asia Pacific Data Governance Market Revenue Share (%), by Deployment 2024 & 2032
- Figure 40: Asia Pacific Data Governance Market Revenue (Million), by Organization Size 2024 & 2032
- Figure 41: Asia Pacific Data Governance Market Revenue Share (%), by Organization Size 2024 & 2032
- Figure 42: Asia Pacific Data Governance Market Revenue (Million), by Component 2024 & 2032
- Figure 43: Asia Pacific Data Governance Market Revenue Share (%), by Component 2024 & 2032
- Figure 44: Asia Pacific Data Governance Market Revenue (Million), by Business Function 2024 & 2032
- Figure 45: Asia Pacific Data Governance Market Revenue Share (%), by Business Function 2024 & 2032
- Figure 46: Asia Pacific Data Governance Market Revenue (Million), by End-user Industry 2024 & 2032
- Figure 47: Asia Pacific Data Governance Market Revenue Share (%), by End-user Industry 2024 & 2032
- Figure 48: Asia Pacific Data Governance Market Revenue (Million), by Country 2024 & 2032
- Figure 49: Asia Pacific Data Governance Market Revenue Share (%), by Country 2024 & 2032
- Figure 50: Latin America Data Governance Market Revenue (Million), by Deployment 2024 & 2032
- Figure 51: Latin America Data Governance Market Revenue Share (%), by Deployment 2024 & 2032
- Figure 52: Latin America Data Governance Market Revenue (Million), by Organization Size 2024 & 2032
- Figure 53: Latin America Data Governance Market Revenue Share (%), by Organization Size 2024 & 2032
- Figure 54: Latin America Data Governance Market Revenue (Million), by Component 2024 & 2032
- Figure 55: Latin America Data Governance Market Revenue Share (%), by Component 2024 & 2032
- Figure 56: Latin America Data Governance Market Revenue (Million), by Business Function 2024 & 2032
- Figure 57: Latin America Data Governance Market Revenue Share (%), by Business Function 2024 & 2032
- Figure 58: Latin America Data Governance Market Revenue (Million), by End-user Industry 2024 & 2032
- Figure 59: Latin America Data Governance Market Revenue Share (%), by End-user Industry 2024 & 2032
- Figure 60: Latin America Data Governance Market Revenue (Million), by Country 2024 & 2032
- Figure 61: Latin America Data Governance Market Revenue Share (%), by Country 2024 & 2032
- Figure 62: Middle East and Africa Data Governance Market Revenue (Million), by Deployment 2024 & 2032
- Figure 63: Middle East and Africa Data Governance Market Revenue Share (%), by Deployment 2024 & 2032
- Figure 64: Middle East and Africa Data Governance Market Revenue (Million), by Organization Size 2024 & 2032
- Figure 65: Middle East and Africa Data Governance Market Revenue Share (%), by Organization Size 2024 & 2032
- Figure 66: Middle East and Africa Data Governance Market Revenue (Million), by Component 2024 & 2032
- Figure 67: Middle East and Africa Data Governance Market Revenue Share (%), by Component 2024 & 2032
- Figure 68: Middle East and Africa Data Governance Market Revenue (Million), by Business Function 2024 & 2032
- Figure 69: Middle East and Africa Data Governance Market Revenue Share (%), by Business Function 2024 & 2032
- Figure 70: Middle East and Africa Data Governance Market Revenue (Million), by End-user Industry 2024 & 2032
- Figure 71: Middle East and Africa Data Governance Market Revenue Share (%), by End-user Industry 2024 & 2032
- Figure 72: Middle East and Africa Data Governance Market Revenue (Million), by Country 2024 & 2032
- Figure 73: Middle East and Africa Data Governance Market Revenue Share (%), by Country 2024 & 2032
List of Tables
- Table 1: Global Data Governance Market Revenue Million Forecast, by Region 2019 & 2032
- Table 2: Global Data Governance Market Revenue Million Forecast, by Deployment 2019 & 2032
- Table 3: Global Data Governance Market Revenue Million Forecast, by Organization Size 2019 & 2032
- Table 4: Global Data Governance Market Revenue Million Forecast, by Component 2019 & 2032
- Table 5: Global Data Governance Market Revenue Million Forecast, by Business Function 2019 & 2032
- Table 6: Global Data Governance Market Revenue Million Forecast, by End-user Industry 2019 & 2032
- Table 7: Global Data Governance Market Revenue Million Forecast, by Region 2019 & 2032
- Table 8: Global Data Governance Market Revenue Million Forecast, by Country 2019 & 2032
- Table 9: United States Data Governance Market Revenue (Million) Forecast, by Application 2019 & 2032
- Table 10: Canada Data Governance Market Revenue (Million) Forecast, by Application 2019 & 2032
- Table 11: Mexico Data Governance Market Revenue (Million) Forecast, by Application 2019 & 2032
- Table 12: Global Data Governance Market Revenue Million Forecast, by Country 2019 & 2032
- Table 13: Germany Data Governance Market Revenue (Million) Forecast, by Application 2019 & 2032
- Table 14: United Kingdom Data Governance Market Revenue (Million) Forecast, by Application 2019 & 2032
- Table 15: France Data Governance Market Revenue (Million) Forecast, by Application 2019 & 2032
- Table 16: Spain Data Governance Market Revenue (Million) Forecast, by Application 2019 & 2032
- Table 17: Italy Data Governance Market Revenue (Million) Forecast, by Application 2019 & 2032
- Table 18: Spain Data Governance Market Revenue (Million) Forecast, by Application 2019 & 2032
- Table 19: Belgium Data Governance Market Revenue (Million) Forecast, by Application 2019 & 2032
- Table 20: Netherland Data Governance Market Revenue (Million) Forecast, by Application 2019 & 2032
- Table 21: Nordics Data Governance Market Revenue (Million) Forecast, by Application 2019 & 2032
- Table 22: Rest of Europe Data Governance Market Revenue (Million) Forecast, by Application 2019 & 2032
- Table 23: Global Data Governance Market Revenue Million Forecast, by Country 2019 & 2032
- Table 24: China Data Governance Market Revenue (Million) Forecast, by Application 2019 & 2032
- Table 25: Japan Data Governance Market Revenue (Million) Forecast, by Application 2019 & 2032
- Table 26: India Data Governance Market Revenue (Million) Forecast, by Application 2019 & 2032
- Table 27: South Korea Data Governance Market Revenue (Million) Forecast, by Application 2019 & 2032
- Table 28: Southeast Asia Data Governance Market Revenue (Million) Forecast, by Application 2019 & 2032
- Table 29: Australia Data Governance Market Revenue (Million) Forecast, by Application 2019 & 2032
- Table 30: Indonesia Data Governance Market Revenue (Million) Forecast, by Application 2019 & 2032
- Table 31: Phillipes Data Governance Market Revenue (Million) Forecast, by Application 2019 & 2032
- Table 32: Singapore Data Governance Market Revenue (Million) Forecast, by Application 2019 & 2032
- Table 33: Thailandc Data Governance Market Revenue (Million) Forecast, by Application 2019 & 2032
- Table 34: Rest of Asia Pacific Data Governance Market Revenue (Million) Forecast, by Application 2019 & 2032
- Table 35: Global Data Governance Market Revenue Million Forecast, by Country 2019 & 2032
- Table 36: Brazil Data Governance Market Revenue (Million) Forecast, by Application 2019 & 2032
- Table 37: Argentina Data Governance Market Revenue (Million) Forecast, by Application 2019 & 2032
- Table 38: Peru Data Governance Market Revenue (Million) Forecast, by Application 2019 & 2032
- Table 39: Chile Data Governance Market Revenue (Million) Forecast, by Application 2019 & 2032
- Table 40: Colombia Data Governance Market Revenue (Million) Forecast, by Application 2019 & 2032
- Table 41: Ecuador Data Governance Market Revenue (Million) Forecast, by Application 2019 & 2032
- Table 42: Venezuela Data Governance Market Revenue (Million) Forecast, by Application 2019 & 2032
- Table 43: Rest of South America Data Governance Market Revenue (Million) Forecast, by Application 2019 & 2032
- Table 44: Global Data Governance Market Revenue Million Forecast, by Country 2019 & 2032
- Table 45: United States Data Governance Market Revenue (Million) Forecast, by Application 2019 & 2032
- Table 46: Canada Data Governance Market Revenue (Million) Forecast, by Application 2019 & 2032
- Table 47: Mexico Data Governance Market Revenue (Million) Forecast, by Application 2019 & 2032
- Table 48: Global Data Governance Market Revenue Million Forecast, by Country 2019 & 2032
- Table 49: United Arab Emirates Data Governance Market Revenue (Million) Forecast, by Application 2019 & 2032
- Table 50: Saudi Arabia Data Governance Market Revenue (Million) Forecast, by Application 2019 & 2032
- Table 51: South Africa Data Governance Market Revenue (Million) Forecast, by Application 2019 & 2032
- Table 52: Rest of Middle East and Africa Data Governance Market Revenue (Million) Forecast, by Application 2019 & 2032
- Table 53: Global Data Governance Market Revenue Million Forecast, by Deployment 2019 & 2032
- Table 54: Global Data Governance Market Revenue Million Forecast, by Organization Size 2019 & 2032
- Table 55: Global Data Governance Market Revenue Million Forecast, by Component 2019 & 2032
- Table 56: Global Data Governance Market Revenue Million Forecast, by Business Function 2019 & 2032
- Table 57: Global Data Governance Market Revenue Million Forecast, by End-user Industry 2019 & 2032
- Table 58: Global Data Governance Market Revenue Million Forecast, by Country 2019 & 2032
- Table 59: Global Data Governance Market Revenue Million Forecast, by Deployment 2019 & 2032
- Table 60: Global Data Governance Market Revenue Million Forecast, by Organization Size 2019 & 2032
- Table 61: Global Data Governance Market Revenue Million Forecast, by Component 2019 & 2032
- Table 62: Global Data Governance Market Revenue Million Forecast, by Business Function 2019 & 2032
- Table 63: Global Data Governance Market Revenue Million Forecast, by End-user Industry 2019 & 2032
- Table 64: Global Data Governance Market Revenue Million Forecast, by Country 2019 & 2032
- Table 65: Global Data Governance Market Revenue Million Forecast, by Deployment 2019 & 2032
- Table 66: Global Data Governance Market Revenue Million Forecast, by Organization Size 2019 & 2032
- Table 67: Global Data Governance Market Revenue Million Forecast, by Component 2019 & 2032
- Table 68: Global Data Governance Market Revenue Million Forecast, by Business Function 2019 & 2032
- Table 69: Global Data Governance Market Revenue Million Forecast, by End-user Industry 2019 & 2032
- Table 70: Global Data Governance Market Revenue Million Forecast, by Country 2019 & 2032
- Table 71: Global Data Governance Market Revenue Million Forecast, by Deployment 2019 & 2032
- Table 72: Global Data Governance Market Revenue Million Forecast, by Organization Size 2019 & 2032
- Table 73: Global Data Governance Market Revenue Million Forecast, by Component 2019 & 2032
- Table 74: Global Data Governance Market Revenue Million Forecast, by Business Function 2019 & 2032
- Table 75: Global Data Governance Market Revenue Million Forecast, by End-user Industry 2019 & 2032
- Table 76: Global Data Governance Market Revenue Million Forecast, by Country 2019 & 2032
- Table 77: Global Data Governance Market Revenue Million Forecast, by Deployment 2019 & 2032
- Table 78: Global Data Governance Market Revenue Million Forecast, by Organization Size 2019 & 2032
- Table 79: Global Data Governance Market Revenue Million Forecast, by Component 2019 & 2032
- Table 80: Global Data Governance Market Revenue Million Forecast, by Business Function 2019 & 2032
- Table 81: Global Data Governance Market Revenue Million Forecast, by End-user Industry 2019 & 2032
- Table 82: Global Data Governance Market Revenue Million Forecast, by Country 2019 & 2032
Frequently Asked Questions
1. What is the projected Compound Annual Growth Rate (CAGR) of the Data Governance Market?
The projected CAGR is approximately 19.72%.
2. Which companies are prominent players in the Data Governance Market?
Key companies in the market include SAS Institute Inc, Talend SA, Collibra NV, TIBCO Software Inc, IBM Corporation, Informatica Inc, Microsoft Corporation, Symantec Corporation (Norton Lifelock), Alation Inc, Varonis Systems Inc , Oracle Corporation, Alfresco Software Inc, SAP SE.
3. What are the main segments of the Data Governance Market?
The market segments include Deployment, Organization Size, Component, Business Function, End-user Industry.
4. Can you provide details about the market size?
The market size is estimated to be USD 3.27 Million as of 2022.
5. What are some drivers contributing to market growth?
Rising Regulatory and Compliance Mandates; Growth of Data Volume.
6. What are the notable trends driving market growth?
Healthcare Sector Expected to Exhibit Significant Growth Rate.
7. Are there any restraints impacting market growth?
Varying Structure of Regulatory Policies and Data Address Validation.
8. Can you provide examples of recent developments in the market?
June 2023 - Oracle announced its plans to develop powerful, generative AI services for organizations across the world. The company will provide native generative AI services to help organizations automate end-to-end business processes, improve decision-making, and enhance customer experiences, in collaboration with Cohere, a leading AI platform for enterprise.
9. What pricing options are available for accessing the report?
Pricing options include single-user, multi-user, and enterprise licenses priced at USD 4750, USD 5250, and USD 8750 respectively.
10. Is the market size provided in terms of value or volume?
The market size is provided in terms of value, measured in Million.
11. Are there any specific market keywords associated with the report?
Yes, the market keyword associated with the report is "Data Governance Market," which aids in identifying and referencing the specific market segment covered.
12. How do I determine which pricing option suits my needs best?
The pricing options vary based on user requirements and access needs. Individual users may opt for single-user licenses, while businesses requiring broader access may choose multi-user or enterprise licenses for cost-effective access to the report.
13. Are there any additional resources or data provided in the Data Governance Market report?
While the report offers comprehensive insights, it's advisable to review the specific contents or supplementary materials provided to ascertain if additional resources or data are available.
14. How can I stay updated on further developments or reports in the Data Governance Market?
To stay informed about further developments, trends, and reports in the Data Governance Market, consider subscribing to industry newsletters, following relevant companies and organizations, or regularly checking reputable industry news sources and publications.
Methodology
Step 1 - Identification of Relevant Samples Size from Population Database


Step 2 - Approaches for Defining Global Market Size (Value, Volume* & Price*)

Note*: In applicable scenarios
Step 3 - Data Sources
Primary Research
- Web Analytics
- Survey Reports
- Research Institute
- Latest Research Reports
- Opinion Leaders
Secondary Research
- Annual Reports
- White Paper
- Latest Press Release
- Industry Association
- Paid Database
- Investor Presentations

Step 4 - Data Triangulation
Involves using different sources of information in order to increase the validity of a study
These sources are likely to be stakeholders in a program - participants, other researchers, program staff, other community members, and so on.
Then we put all data in single framework & apply various statistical tools to find out the dynamic on the market.
During the analysis stage, feedback from the stakeholder groups would be compared to determine areas of agreement as well as areas of divergence


