
Key Insights
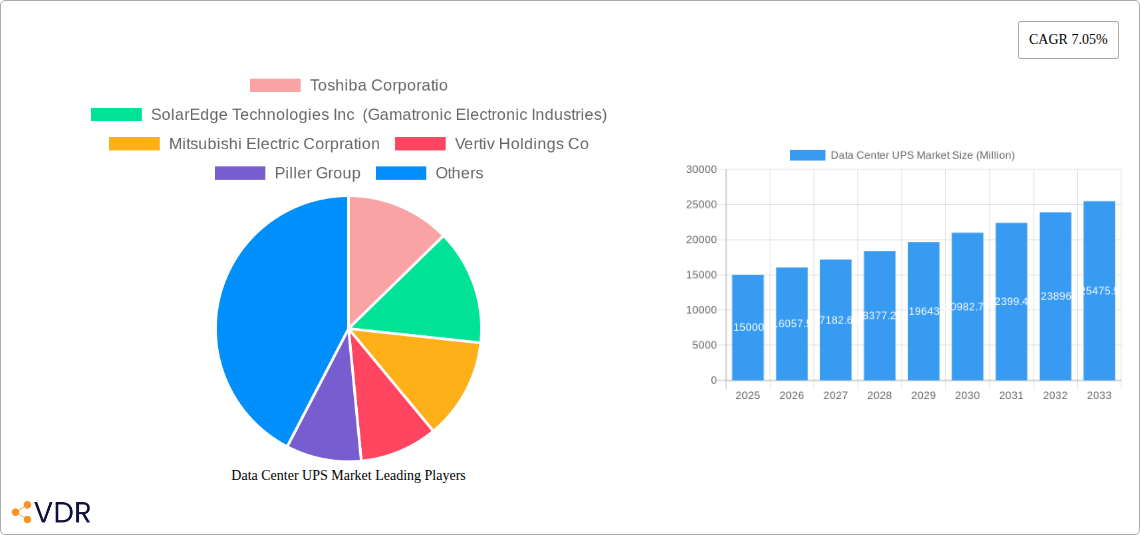
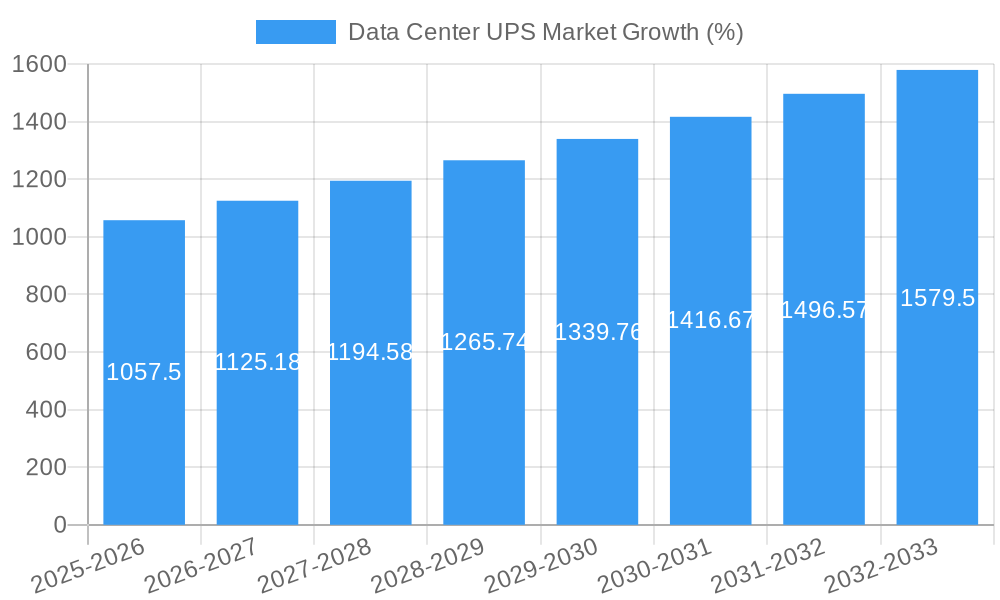
The Data Center UPS market is experiencing robust growth, driven by the increasing adoption of cloud computing, the proliferation of data centers globally, and the rising demand for reliable power backup solutions to prevent data loss and ensure business continuity. The market, estimated at $XX million in 2025, is projected to maintain a Compound Annual Growth Rate (CAGR) of 7.05% from 2025 to 2033. This growth is fueled by several key factors. The expansion of the IT sector, particularly in regions like North America and Asia Pacific, necessitates advanced power protection systems, significantly boosting demand for UPS solutions. Furthermore, the growing emphasis on green initiatives is driving the adoption of energy-efficient UPS systems, particularly in large data centers. Stringent government regulations related to data security and power reliability are also contributing to market expansion. Segment-wise, the double conversion online UPS type holds a significant market share owing to its superior power quality and protection capabilities, while the large data center segment is the major revenue contributor due to higher power requirements. Key players like Schneider Electric, Eaton, and Vertiv are leveraging technological advancements and strategic partnerships to strengthen their market positions.
While the market outlook is positive, challenges exist. High initial investment costs associated with advanced UPS systems can be a deterrent for smaller data centers. Furthermore, competition from emerging players and the need to constantly innovate to meet evolving technological demands present ongoing hurdles. Despite these restraints, the overall market trajectory indicates sustained growth, driven by the unwavering demand for robust power protection in the ever-expanding digital landscape. The strategic adoption of advanced technologies like AI and IoT in UPS systems is further expected to boost market growth in the coming years, enhancing monitoring capabilities and predictive maintenance, ultimately contributing to reduced downtime and increased operational efficiency. This creates opportunities for companies to invest in R&D and to develop more efficient and feature-rich solutions to capture a larger market share.
Data Center UPS Market: A Comprehensive Report (2019-2033)
This comprehensive report provides an in-depth analysis of the Data Center UPS market, encompassing historical data (2019-2024), the base year (2025), and a detailed forecast (2025-2033). The study meticulously examines market dynamics, growth trends, regional segmentation, product landscapes, key players, and emerging opportunities, offering invaluable insights for industry professionals, investors, and strategic decision-makers. The market is segmented by UPS type (Standby, Line Interactive, Double Conversion Online, Other UPS Types), data center size (Small, Medium, Large), and end-user vertical (Banking and Financial Services, Manufacturing, Information Technology, Energy, Healthcare, Government, Entertainment and Media, Other End-user Verticals). The total market size is projected to reach xx Million units by 2033.
Data Center UPS Market Dynamics & Structure
The Data Center UPS market is characterized by moderate concentration, with key players like Schneider Electric SE, Eaton Corporation, Vertiv Holdings Co, and ABB Group holding significant market share. Technological innovation, particularly in areas like modularity, scalability, and enhanced monitoring capabilities, is a key driver. Stringent regulatory frameworks concerning power efficiency and data security influence market dynamics. Competition from alternative power solutions, such as fuel cells and alternative energy sources, presents a challenge. The market exhibits significant growth potential driven by the expanding data center landscape, fueled by the increasing adoption of cloud computing and big data analytics. M&A activity remains relatively active, with consolidation expected to continue as companies seek to expand their product portfolios and geographical reach.
- Market Concentration: Moderately concentrated, with top 5 players holding approximately xx% market share in 2025.
- Technological Innovation: Focus on modularity, higher power density, AI-driven predictive maintenance, and enhanced energy efficiency.
- Regulatory Framework: Stringent regulations concerning power efficiency and data center security compliance drive adoption of advanced UPS systems.
- Competitive Substitutes: Fuel cells, alternative energy sources, and battery storage technologies pose a competitive threat.
- M&A Trends: Consolidation through mergers and acquisitions is expected to continue, driving market concentration. An estimated xx M&A deals occurred between 2019-2024.
- End-user Demographics: Growth is driven by increasing data center deployments across various sectors like IT, BFSI, and healthcare.
Data Center UPS Market Growth Trends & Insights
The global Data Center UPS market experienced a CAGR of xx% during the historical period (2019-2024), reaching xx Million units in 2024. This growth is attributed to factors such as the burgeoning adoption of cloud computing, the rise of big data analytics, and increasing digitalization across various industries. Technological advancements like the introduction of modular and scalable UPS systems, enhanced monitoring capabilities, and improved energy efficiency have further fueled market growth. Consumer behavior shifts towards greater reliance on cloud services and enhanced data security needs are driving demand for reliable power backup solutions. The market is projected to maintain a robust growth trajectory, with a projected CAGR of xx% during the forecast period (2025-2033), reaching xx Million units by 2033. Market penetration is expected to increase significantly in developing economies due to rising infrastructure investments and expanding digital infrastructure.
Dominant Regions, Countries, or Segments in Data Center UPS Market
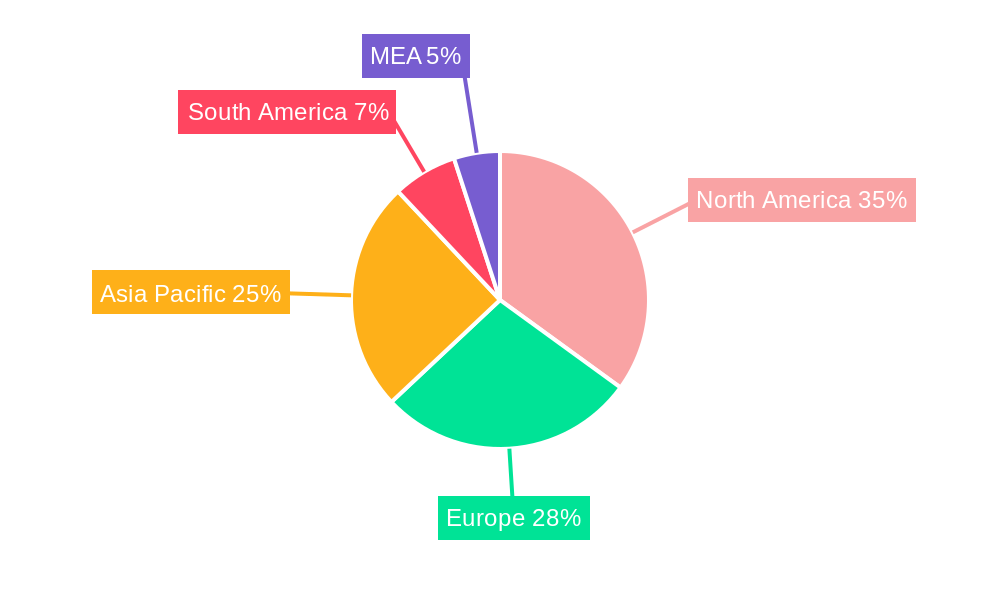
North America and Europe currently dominate the Data Center UPS market, driven by high data center density, robust IT infrastructure, and stringent regulatory compliance requirements. However, Asia-Pacific is experiencing rapid growth, fueled by increasing investments in data center infrastructure and the expanding digital economy. Within UPS types, Double Conversion Online UPS systems are witnessing higher adoption rates due to their enhanced reliability and power quality. Large data centers represent a significant market segment due to their high power requirements and criticality of uptime. The Banking and Financial Services and Information Technology sectors are major end-users, driven by stringent data security and business continuity requirements.
- Key Regional Drivers:
- North America: High data center density, stringent regulations, and strong IT infrastructure.
- Europe: Similar to North America, with a focus on energy efficiency.
- Asia-Pacific: Rapid growth driven by increasing infrastructure investments and expanding digital economy.
- Dominant Segments:
- UPS Type: Double Conversion Online, due to enhanced reliability and power quality.
- Data Center Size: Large, due to high power needs and criticality of uptime.
- End-User Vertical: Banking and Financial Services, and Information Technology.
Data Center UPS Market Product Landscape
The Data Center UPS market is witnessing significant product innovation, with a focus on modularity, scalability, higher power density, and improved energy efficiency. Modern UPS systems incorporate advanced features like predictive maintenance capabilities, remote monitoring, and intelligent power management software. These systems offer unique selling propositions, such as reduced maintenance costs, enhanced reliability, and improved total cost of ownership (TCO). Technological advancements like the integration of AI and machine learning are further enhancing the performance and efficiency of Data Center UPS systems.
Key Drivers, Barriers & Challenges in Data Center UPS Market
Key Drivers:
- Growing adoption of cloud computing and big data analytics.
- Increasing demand for data center infrastructure globally.
- Stringent regulations regarding data security and power reliability.
- Technological advancements in UPS systems (modularity, efficiency, and smart features).
Key Challenges and Restraints:
- High initial investment costs associated with advanced UPS systems.
- Supply chain disruptions impacting component availability and pricing.
- Competition from alternative power solutions (fuel cells, battery storage).
- Regulatory hurdles and compliance requirements in certain regions.
Emerging Opportunities in Data Center UPS Market
- Expansion into emerging markets with growing data center infrastructure.
- Development of eco-friendly UPS systems with enhanced energy efficiency.
- Integration of advanced technologies like AI and IoT for predictive maintenance.
- Growing demand for edge computing and distributed data centers.
Growth Accelerators in the Data Center UPS Market Industry
Technological advancements, strategic partnerships between UPS manufacturers and data center operators, and expansion into untapped markets are key catalysts for long-term growth in the Data Center UPS market. The development of more efficient and reliable UPS systems, coupled with innovative service offerings, are also driving market expansion. Increasing focus on sustainability and environmental concerns is promoting the adoption of greener UPS technologies.
Key Players Shaping the Data Center UPS Market Market
- Toshiba Corporation
- SolarEdge Technologies Inc (Gamatronic Electronic Industries)
- Mitsubishi Electric Corporation
- Vertiv Holdings Co
- Piller Group
- SOCOMEC Group
- Riello SPA
- Schneider Electric SE
- Power Innovations International
- ABB Group
- Eaton Corporation
Notable Milestones in Data Center UPS Market Sector
- April 2022: Numeric (Legrand Group) launches Keor XPE 3, a high-power modular UPS (500 KW – 2.1 MW).
- January 2022: Eaton launches the second generation 5PX UPS with enhanced connectivity and remote monitoring features.
In-Depth Data Center UPS Market Market Outlook
The Data Center UPS market is poised for sustained growth, driven by ongoing digital transformation, expanding data center deployments globally, and the increasing adoption of advanced UPS technologies. Strategic partnerships, technological breakthroughs, and expansion into emerging markets present significant opportunities for market players. The focus on sustainability and energy efficiency will shape future market trends, creating demand for green and energy-efficient UPS solutions. The market's continued expansion promises significant opportunities for innovation, investment, and growth in the coming years.
Data Center UPS Market Segmentation
-
1. UPS Type
- 1.1. Standby
- 1.2. Line Interactive
- 1.3. Double Conversion on Line
- 1.4. Other UPS Types
-
2. Size of Data Center
- 2.1. Small
- 2.2. Medium
- 2.3. Large
-
3. End-user Vertical
- 3.1. Banking and Financial Services
- 3.2. Manufacturing
- 3.3. Information Technology
- 3.4. Energy
- 3.5. Healthcare
- 3.6. Government
- 3.7. Entertainment and Media
- 3.8. Other End-user Verticals
Data Center UPS Market Segmentation By Geography
- 1. North America
- 2. Europe
- 3. Asia
- 4. Australia and New Zealand
- 5. Latin America
- 6. Middle East and Africa
Data Center UPS Market REPORT HIGHLIGHTS
| Aspects | Details |
|---|---|
| Study Period | 2019-2033 |
| Base Year | 2024 |
| Estimated Year | 2025 |
| Forecast Period | 2025-2033 |
| Historical Period | 2019-2024 |
| Growth Rate | CAGR of 7.05% from 2019-2033 |
| Segmentation |
|
Table of Contents
- 1. Introduction
- 1.1. Research Scope
- 1.2. Market Segmentation
- 1.3. Research Methodology
- 1.4. Definitions and Assumptions
- 2. Executive Summary
- 2.1. Introduction
- 3. Market Dynamics
- 3.1. Introduction
- 3.2. Market Drivers
- 3.2.1. Demand in Renewable Energy Commercialization; Growing Trend of Digitization and Adoption of Connected Solution
- 3.3. Market Restrains
- 3.3.1. Volatile Raw Material Prices
- 3.4. Market Trends
- 3.4.1. Double Conversion Online Accounts for a Significant Market Share
- 4. Market Factor Analysis
- 4.1. Porters Five Forces
- 4.2. Supply/Value Chain
- 4.3. PESTEL analysis
- 4.4. Market Entropy
- 4.5. Patent/Trademark Analysis
- 5. Global Data Center UPS Market Analysis, Insights and Forecast, 2019-2031
- 5.1. Market Analysis, Insights and Forecast - by UPS Type
- 5.1.1. Standby
- 5.1.2. Line Interactive
- 5.1.3. Double Conversion on Line
- 5.1.4. Other UPS Types
- 5.2. Market Analysis, Insights and Forecast - by Size of Data Center
- 5.2.1. Small
- 5.2.2. Medium
- 5.2.3. Large
- 5.3. Market Analysis, Insights and Forecast - by End-user Vertical
- 5.3.1. Banking and Financial Services
- 5.3.2. Manufacturing
- 5.3.3. Information Technology
- 5.3.4. Energy
- 5.3.5. Healthcare
- 5.3.6. Government
- 5.3.7. Entertainment and Media
- 5.3.8. Other End-user Verticals
- 5.4. Market Analysis, Insights and Forecast - by Region
- 5.4.1. North America
- 5.4.2. Europe
- 5.4.3. Asia
- 5.4.4. Australia and New Zealand
- 5.4.5. Latin America
- 5.4.6. Middle East and Africa
- 5.1. Market Analysis, Insights and Forecast - by UPS Type
- 6. North America Data Center UPS Market Analysis, Insights and Forecast, 2019-2031
- 6.1. Market Analysis, Insights and Forecast - by UPS Type
- 6.1.1. Standby
- 6.1.2. Line Interactive
- 6.1.3. Double Conversion on Line
- 6.1.4. Other UPS Types
- 6.2. Market Analysis, Insights and Forecast - by Size of Data Center
- 6.2.1. Small
- 6.2.2. Medium
- 6.2.3. Large
- 6.3. Market Analysis, Insights and Forecast - by End-user Vertical
- 6.3.1. Banking and Financial Services
- 6.3.2. Manufacturing
- 6.3.3. Information Technology
- 6.3.4. Energy
- 6.3.5. Healthcare
- 6.3.6. Government
- 6.3.7. Entertainment and Media
- 6.3.8. Other End-user Verticals
- 6.1. Market Analysis, Insights and Forecast - by UPS Type
- 7. Europe Data Center UPS Market Analysis, Insights and Forecast, 2019-2031
- 7.1. Market Analysis, Insights and Forecast - by UPS Type
- 7.1.1. Standby
- 7.1.2. Line Interactive
- 7.1.3. Double Conversion on Line
- 7.1.4. Other UPS Types
- 7.2. Market Analysis, Insights and Forecast - by Size of Data Center
- 7.2.1. Small
- 7.2.2. Medium
- 7.2.3. Large
- 7.3. Market Analysis, Insights and Forecast - by End-user Vertical
- 7.3.1. Banking and Financial Services
- 7.3.2. Manufacturing
- 7.3.3. Information Technology
- 7.3.4. Energy
- 7.3.5. Healthcare
- 7.3.6. Government
- 7.3.7. Entertainment and Media
- 7.3.8. Other End-user Verticals
- 7.1. Market Analysis, Insights and Forecast - by UPS Type
- 8. Asia Data Center UPS Market Analysis, Insights and Forecast, 2019-2031
- 8.1. Market Analysis, Insights and Forecast - by UPS Type
- 8.1.1. Standby
- 8.1.2. Line Interactive
- 8.1.3. Double Conversion on Line
- 8.1.4. Other UPS Types
- 8.2. Market Analysis, Insights and Forecast - by Size of Data Center
- 8.2.1. Small
- 8.2.2. Medium
- 8.2.3. Large
- 8.3. Market Analysis, Insights and Forecast - by End-user Vertical
- 8.3.1. Banking and Financial Services
- 8.3.2. Manufacturing
- 8.3.3. Information Technology
- 8.3.4. Energy
- 8.3.5. Healthcare
- 8.3.6. Government
- 8.3.7. Entertainment and Media
- 8.3.8. Other End-user Verticals
- 8.1. Market Analysis, Insights and Forecast - by UPS Type
- 9. Australia and New Zealand Data Center UPS Market Analysis, Insights and Forecast, 2019-2031
- 9.1. Market Analysis, Insights and Forecast - by UPS Type
- 9.1.1. Standby
- 9.1.2. Line Interactive
- 9.1.3. Double Conversion on Line
- 9.1.4. Other UPS Types
- 9.2. Market Analysis, Insights and Forecast - by Size of Data Center
- 9.2.1. Small
- 9.2.2. Medium
- 9.2.3. Large
- 9.3. Market Analysis, Insights and Forecast - by End-user Vertical
- 9.3.1. Banking and Financial Services
- 9.3.2. Manufacturing
- 9.3.3. Information Technology
- 9.3.4. Energy
- 9.3.5. Healthcare
- 9.3.6. Government
- 9.3.7. Entertainment and Media
- 9.3.8. Other End-user Verticals
- 9.1. Market Analysis, Insights and Forecast - by UPS Type
- 10. Latin America Data Center UPS Market Analysis, Insights and Forecast, 2019-2031
- 10.1. Market Analysis, Insights and Forecast - by UPS Type
- 10.1.1. Standby
- 10.1.2. Line Interactive
- 10.1.3. Double Conversion on Line
- 10.1.4. Other UPS Types
- 10.2. Market Analysis, Insights and Forecast - by Size of Data Center
- 10.2.1. Small
- 10.2.2. Medium
- 10.2.3. Large
- 10.3. Market Analysis, Insights and Forecast - by End-user Vertical
- 10.3.1. Banking and Financial Services
- 10.3.2. Manufacturing
- 10.3.3. Information Technology
- 10.3.4. Energy
- 10.3.5. Healthcare
- 10.3.6. Government
- 10.3.7. Entertainment and Media
- 10.3.8. Other End-user Verticals
- 10.1. Market Analysis, Insights and Forecast - by UPS Type
- 11. Middle East and Africa Data Center UPS Market Analysis, Insights and Forecast, 2019-2031
- 11.1. Market Analysis, Insights and Forecast - by UPS Type
- 11.1.1. Standby
- 11.1.2. Line Interactive
- 11.1.3. Double Conversion on Line
- 11.1.4. Other UPS Types
- 11.2. Market Analysis, Insights and Forecast - by Size of Data Center
- 11.2.1. Small
- 11.2.2. Medium
- 11.2.3. Large
- 11.3. Market Analysis, Insights and Forecast - by End-user Vertical
- 11.3.1. Banking and Financial Services
- 11.3.2. Manufacturing
- 11.3.3. Information Technology
- 11.3.4. Energy
- 11.3.5. Healthcare
- 11.3.6. Government
- 11.3.7. Entertainment and Media
- 11.3.8. Other End-user Verticals
- 11.1. Market Analysis, Insights and Forecast - by UPS Type
- 12. North America Data Center UPS Market Analysis, Insights and Forecast, 2019-2031
- 12.1. Market Analysis, Insights and Forecast - By Country/Sub-region
- 12.1.1. undefined
- 13. Europe Data Center UPS Market Analysis, Insights and Forecast, 2019-2031
- 13.1. Market Analysis, Insights and Forecast - By Country/Sub-region
- 13.1.1. undefined
- 14. Asia Pacific Data Center UPS Market Analysis, Insights and Forecast, 2019-2031
- 14.1. Market Analysis, Insights and Forecast - By Country/Sub-region
- 14.1.1. undefined
- 15. South America Data Center UPS Market Analysis, Insights and Forecast, 2019-2031
- 15.1. Market Analysis, Insights and Forecast - By Country/Sub-region
- 15.1.1. undefined
- 16. North America Data Center UPS Market Analysis, Insights and Forecast, 2019-2031
- 16.1. Market Analysis, Insights and Forecast - By Country/Sub-region
- 16.1.1. undefined
- 17. MEA Data Center UPS Market Analysis, Insights and Forecast, 2019-2031
- 17.1. Market Analysis, Insights and Forecast - By Country/Sub-region
- 17.1.1. undefined
- 18. Competitive Analysis
- 18.1. Global Market Share Analysis 2024
- 18.2. Company Profiles
- 18.2.1 Toshiba Corporatio
- 18.2.1.1. Overview
- 18.2.1.2. Products
- 18.2.1.3. SWOT Analysis
- 18.2.1.4. Recent Developments
- 18.2.1.5. Financials (Based on Availability)
- 18.2.2 SolarEdge Technologies Inc (Gamatronic Electronic Industries)
- 18.2.2.1. Overview
- 18.2.2.2. Products
- 18.2.2.3. SWOT Analysis
- 18.2.2.4. Recent Developments
- 18.2.2.5. Financials (Based on Availability)
- 18.2.3 Mitsubishi Electric Corpration
- 18.2.3.1. Overview
- 18.2.3.2. Products
- 18.2.3.3. SWOT Analysis
- 18.2.3.4. Recent Developments
- 18.2.3.5. Financials (Based on Availability)
- 18.2.4 Vertiv Holdings Co
- 18.2.4.1. Overview
- 18.2.4.2. Products
- 18.2.4.3. SWOT Analysis
- 18.2.4.4. Recent Developments
- 18.2.4.5. Financials (Based on Availability)
- 18.2.5 Piller Group
- 18.2.5.1. Overview
- 18.2.5.2. Products
- 18.2.5.3. SWOT Analysis
- 18.2.5.4. Recent Developments
- 18.2.5.5. Financials (Based on Availability)
- 18.2.6 SOCOMEC Group
- 18.2.6.1. Overview
- 18.2.6.2. Products
- 18.2.6.3. SWOT Analysis
- 18.2.6.4. Recent Developments
- 18.2.6.5. Financials (Based on Availability)
- 18.2.7 Riello SPA
- 18.2.7.1. Overview
- 18.2.7.2. Products
- 18.2.7.3. SWOT Analysis
- 18.2.7.4. Recent Developments
- 18.2.7.5. Financials (Based on Availability)
- 18.2.8 Schneider Electric SE
- 18.2.8.1. Overview
- 18.2.8.2. Products
- 18.2.8.3. SWOT Analysis
- 18.2.8.4. Recent Developments
- 18.2.8.5. Financials (Based on Availability)
- 18.2.9 Power Innovations International
- 18.2.9.1. Overview
- 18.2.9.2. Products
- 18.2.9.3. SWOT Analysis
- 18.2.9.4. Recent Developments
- 18.2.9.5. Financials (Based on Availability)
- 18.2.10 ABB Group
- 18.2.10.1. Overview
- 18.2.10.2. Products
- 18.2.10.3. SWOT Analysis
- 18.2.10.4. Recent Developments
- 18.2.10.5. Financials (Based on Availability)
- 18.2.11 Eaton Corporation
- 18.2.11.1. Overview
- 18.2.11.2. Products
- 18.2.11.3. SWOT Analysis
- 18.2.11.4. Recent Developments
- 18.2.11.5. Financials (Based on Availability)
- 18.2.1 Toshiba Corporatio
List of Figures
- Figure 1: Global Data Center UPS Market Revenue Breakdown (Million, %) by Region 2024 & 2032
- Figure 2: Global Data Center UPS Market Volume Breakdown (K Unit, %) by Region 2024 & 2032
- Figure 3: North America Data Center UPS Market Revenue (Million), by Country 2024 & 2032
- Figure 4: North America Data Center UPS Market Volume (K Unit), by Country 2024 & 2032
- Figure 5: North America Data Center UPS Market Revenue Share (%), by Country 2024 & 2032
- Figure 6: North America Data Center UPS Market Volume Share (%), by Country 2024 & 2032
- Figure 7: Europe Data Center UPS Market Revenue (Million), by Country 2024 & 2032
- Figure 8: Europe Data Center UPS Market Volume (K Unit), by Country 2024 & 2032
- Figure 9: Europe Data Center UPS Market Revenue Share (%), by Country 2024 & 2032
- Figure 10: Europe Data Center UPS Market Volume Share (%), by Country 2024 & 2032
- Figure 11: Asia Pacific Data Center UPS Market Revenue (Million), by Country 2024 & 2032
- Figure 12: Asia Pacific Data Center UPS Market Volume (K Unit), by Country 2024 & 2032
- Figure 13: Asia Pacific Data Center UPS Market Revenue Share (%), by Country 2024 & 2032
- Figure 14: Asia Pacific Data Center UPS Market Volume Share (%), by Country 2024 & 2032
- Figure 15: South America Data Center UPS Market Revenue (Million), by Country 2024 & 2032
- Figure 16: South America Data Center UPS Market Volume (K Unit), by Country 2024 & 2032
- Figure 17: South America Data Center UPS Market Revenue Share (%), by Country 2024 & 2032
- Figure 18: South America Data Center UPS Market Volume Share (%), by Country 2024 & 2032
- Figure 19: North America Data Center UPS Market Revenue (Million), by Country 2024 & 2032
- Figure 20: North America Data Center UPS Market Volume (K Unit), by Country 2024 & 2032
- Figure 21: North America Data Center UPS Market Revenue Share (%), by Country 2024 & 2032
- Figure 22: North America Data Center UPS Market Volume Share (%), by Country 2024 & 2032
- Figure 23: MEA Data Center UPS Market Revenue (Million), by Country 2024 & 2032
- Figure 24: MEA Data Center UPS Market Volume (K Unit), by Country 2024 & 2032
- Figure 25: MEA Data Center UPS Market Revenue Share (%), by Country 2024 & 2032
- Figure 26: MEA Data Center UPS Market Volume Share (%), by Country 2024 & 2032
- Figure 27: North America Data Center UPS Market Revenue (Million), by UPS Type 2024 & 2032
- Figure 28: North America Data Center UPS Market Volume (K Unit), by UPS Type 2024 & 2032
- Figure 29: North America Data Center UPS Market Revenue Share (%), by UPS Type 2024 & 2032
- Figure 30: North America Data Center UPS Market Volume Share (%), by UPS Type 2024 & 2032
- Figure 31: North America Data Center UPS Market Revenue (Million), by Size of Data Center 2024 & 2032
- Figure 32: North America Data Center UPS Market Volume (K Unit), by Size of Data Center 2024 & 2032
- Figure 33: North America Data Center UPS Market Revenue Share (%), by Size of Data Center 2024 & 2032
- Figure 34: North America Data Center UPS Market Volume Share (%), by Size of Data Center 2024 & 2032
- Figure 35: North America Data Center UPS Market Revenue (Million), by End-user Vertical 2024 & 2032
- Figure 36: North America Data Center UPS Market Volume (K Unit), by End-user Vertical 2024 & 2032
- Figure 37: North America Data Center UPS Market Revenue Share (%), by End-user Vertical 2024 & 2032
- Figure 38: North America Data Center UPS Market Volume Share (%), by End-user Vertical 2024 & 2032
- Figure 39: North America Data Center UPS Market Revenue (Million), by Country 2024 & 2032
- Figure 40: North America Data Center UPS Market Volume (K Unit), by Country 2024 & 2032
- Figure 41: North America Data Center UPS Market Revenue Share (%), by Country 2024 & 2032
- Figure 42: North America Data Center UPS Market Volume Share (%), by Country 2024 & 2032
- Figure 43: Europe Data Center UPS Market Revenue (Million), by UPS Type 2024 & 2032
- Figure 44: Europe Data Center UPS Market Volume (K Unit), by UPS Type 2024 & 2032
- Figure 45: Europe Data Center UPS Market Revenue Share (%), by UPS Type 2024 & 2032
- Figure 46: Europe Data Center UPS Market Volume Share (%), by UPS Type 2024 & 2032
- Figure 47: Europe Data Center UPS Market Revenue (Million), by Size of Data Center 2024 & 2032
- Figure 48: Europe Data Center UPS Market Volume (K Unit), by Size of Data Center 2024 & 2032
- Figure 49: Europe Data Center UPS Market Revenue Share (%), by Size of Data Center 2024 & 2032
- Figure 50: Europe Data Center UPS Market Volume Share (%), by Size of Data Center 2024 & 2032
- Figure 51: Europe Data Center UPS Market Revenue (Million), by End-user Vertical 2024 & 2032
- Figure 52: Europe Data Center UPS Market Volume (K Unit), by End-user Vertical 2024 & 2032
- Figure 53: Europe Data Center UPS Market Revenue Share (%), by End-user Vertical 2024 & 2032
- Figure 54: Europe Data Center UPS Market Volume Share (%), by End-user Vertical 2024 & 2032
- Figure 55: Europe Data Center UPS Market Revenue (Million), by Country 2024 & 2032
- Figure 56: Europe Data Center UPS Market Volume (K Unit), by Country 2024 & 2032
- Figure 57: Europe Data Center UPS Market Revenue Share (%), by Country 2024 & 2032
- Figure 58: Europe Data Center UPS Market Volume Share (%), by Country 2024 & 2032
- Figure 59: Asia Data Center UPS Market Revenue (Million), by UPS Type 2024 & 2032
- Figure 60: Asia Data Center UPS Market Volume (K Unit), by UPS Type 2024 & 2032
- Figure 61: Asia Data Center UPS Market Revenue Share (%), by UPS Type 2024 & 2032
- Figure 62: Asia Data Center UPS Market Volume Share (%), by UPS Type 2024 & 2032
- Figure 63: Asia Data Center UPS Market Revenue (Million), by Size of Data Center 2024 & 2032
- Figure 64: Asia Data Center UPS Market Volume (K Unit), by Size of Data Center 2024 & 2032
- Figure 65: Asia Data Center UPS Market Revenue Share (%), by Size of Data Center 2024 & 2032
- Figure 66: Asia Data Center UPS Market Volume Share (%), by Size of Data Center 2024 & 2032
- Figure 67: Asia Data Center UPS Market Revenue (Million), by End-user Vertical 2024 & 2032
- Figure 68: Asia Data Center UPS Market Volume (K Unit), by End-user Vertical 2024 & 2032
- Figure 69: Asia Data Center UPS Market Revenue Share (%), by End-user Vertical 2024 & 2032
- Figure 70: Asia Data Center UPS Market Volume Share (%), by End-user Vertical 2024 & 2032
- Figure 71: Asia Data Center UPS Market Revenue (Million), by Country 2024 & 2032
- Figure 72: Asia Data Center UPS Market Volume (K Unit), by Country 2024 & 2032
- Figure 73: Asia Data Center UPS Market Revenue Share (%), by Country 2024 & 2032
- Figure 74: Asia Data Center UPS Market Volume Share (%), by Country 2024 & 2032
- Figure 75: Australia and New Zealand Data Center UPS Market Revenue (Million), by UPS Type 2024 & 2032
- Figure 76: Australia and New Zealand Data Center UPS Market Volume (K Unit), by UPS Type 2024 & 2032
- Figure 77: Australia and New Zealand Data Center UPS Market Revenue Share (%), by UPS Type 2024 & 2032
- Figure 78: Australia and New Zealand Data Center UPS Market Volume Share (%), by UPS Type 2024 & 2032
- Figure 79: Australia and New Zealand Data Center UPS Market Revenue (Million), by Size of Data Center 2024 & 2032
- Figure 80: Australia and New Zealand Data Center UPS Market Volume (K Unit), by Size of Data Center 2024 & 2032
- Figure 81: Australia and New Zealand Data Center UPS Market Revenue Share (%), by Size of Data Center 2024 & 2032
- Figure 82: Australia and New Zealand Data Center UPS Market Volume Share (%), by Size of Data Center 2024 & 2032
- Figure 83: Australia and New Zealand Data Center UPS Market Revenue (Million), by End-user Vertical 2024 & 2032
- Figure 84: Australia and New Zealand Data Center UPS Market Volume (K Unit), by End-user Vertical 2024 & 2032
- Figure 85: Australia and New Zealand Data Center UPS Market Revenue Share (%), by End-user Vertical 2024 & 2032
- Figure 86: Australia and New Zealand Data Center UPS Market Volume Share (%), by End-user Vertical 2024 & 2032
- Figure 87: Australia and New Zealand Data Center UPS Market Revenue (Million), by Country 2024 & 2032
- Figure 88: Australia and New Zealand Data Center UPS Market Volume (K Unit), by Country 2024 & 2032
- Figure 89: Australia and New Zealand Data Center UPS Market Revenue Share (%), by Country 2024 & 2032
- Figure 90: Australia and New Zealand Data Center UPS Market Volume Share (%), by Country 2024 & 2032
- Figure 91: Latin America Data Center UPS Market Revenue (Million), by UPS Type 2024 & 2032
- Figure 92: Latin America Data Center UPS Market Volume (K Unit), by UPS Type 2024 & 2032
- Figure 93: Latin America Data Center UPS Market Revenue Share (%), by UPS Type 2024 & 2032
- Figure 94: Latin America Data Center UPS Market Volume Share (%), by UPS Type 2024 & 2032
- Figure 95: Latin America Data Center UPS Market Revenue (Million), by Size of Data Center 2024 & 2032
- Figure 96: Latin America Data Center UPS Market Volume (K Unit), by Size of Data Center 2024 & 2032
- Figure 97: Latin America Data Center UPS Market Revenue Share (%), by Size of Data Center 2024 & 2032
- Figure 98: Latin America Data Center UPS Market Volume Share (%), by Size of Data Center 2024 & 2032
- Figure 99: Latin America Data Center UPS Market Revenue (Million), by End-user Vertical 2024 & 2032
- Figure 100: Latin America Data Center UPS Market Volume (K Unit), by End-user Vertical 2024 & 2032
- Figure 101: Latin America Data Center UPS Market Revenue Share (%), by End-user Vertical 2024 & 2032
- Figure 102: Latin America Data Center UPS Market Volume Share (%), by End-user Vertical 2024 & 2032
- Figure 103: Latin America Data Center UPS Market Revenue (Million), by Country 2024 & 2032
- Figure 104: Latin America Data Center UPS Market Volume (K Unit), by Country 2024 & 2032
- Figure 105: Latin America Data Center UPS Market Revenue Share (%), by Country 2024 & 2032
- Figure 106: Latin America Data Center UPS Market Volume Share (%), by Country 2024 & 2032
- Figure 107: Middle East and Africa Data Center UPS Market Revenue (Million), by UPS Type 2024 & 2032
- Figure 108: Middle East and Africa Data Center UPS Market Volume (K Unit), by UPS Type 2024 & 2032
- Figure 109: Middle East and Africa Data Center UPS Market Revenue Share (%), by UPS Type 2024 & 2032
- Figure 110: Middle East and Africa Data Center UPS Market Volume Share (%), by UPS Type 2024 & 2032
- Figure 111: Middle East and Africa Data Center UPS Market Revenue (Million), by Size of Data Center 2024 & 2032
- Figure 112: Middle East and Africa Data Center UPS Market Volume (K Unit), by Size of Data Center 2024 & 2032
- Figure 113: Middle East and Africa Data Center UPS Market Revenue Share (%), by Size of Data Center 2024 & 2032
- Figure 114: Middle East and Africa Data Center UPS Market Volume Share (%), by Size of Data Center 2024 & 2032
- Figure 115: Middle East and Africa Data Center UPS Market Revenue (Million), by End-user Vertical 2024 & 2032
- Figure 116: Middle East and Africa Data Center UPS Market Volume (K Unit), by End-user Vertical 2024 & 2032
- Figure 117: Middle East and Africa Data Center UPS Market Revenue Share (%), by End-user Vertical 2024 & 2032
- Figure 118: Middle East and Africa Data Center UPS Market Volume Share (%), by End-user Vertical 2024 & 2032
- Figure 119: Middle East and Africa Data Center UPS Market Revenue (Million), by Country 2024 & 2032
- Figure 120: Middle East and Africa Data Center UPS Market Volume (K Unit), by Country 2024 & 2032
- Figure 121: Middle East and Africa Data Center UPS Market Revenue Share (%), by Country 2024 & 2032
- Figure 122: Middle East and Africa Data Center UPS Market Volume Share (%), by Country 2024 & 2032
List of Tables
- Table 1: Global Data Center UPS Market Revenue Million Forecast, by Region 2019 & 2032
- Table 2: Global Data Center UPS Market Volume K Unit Forecast, by Region 2019 & 2032
- Table 3: Global Data Center UPS Market Revenue Million Forecast, by UPS Type 2019 & 2032
- Table 4: Global Data Center UPS Market Volume K Unit Forecast, by UPS Type 2019 & 2032
- Table 5: Global Data Center UPS Market Revenue Million Forecast, by Size of Data Center 2019 & 2032
- Table 6: Global Data Center UPS Market Volume K Unit Forecast, by Size of Data Center 2019 & 2032
- Table 7: Global Data Center UPS Market Revenue Million Forecast, by End-user Vertical 2019 & 2032
- Table 8: Global Data Center UPS Market Volume K Unit Forecast, by End-user Vertical 2019 & 2032
- Table 9: Global Data Center UPS Market Revenue Million Forecast, by Region 2019 & 2032
- Table 10: Global Data Center UPS Market Volume K Unit Forecast, by Region 2019 & 2032
- Table 11: Global Data Center UPS Market Revenue Million Forecast, by Country 2019 & 2032
- Table 12: Global Data Center UPS Market Volume K Unit Forecast, by Country 2019 & 2032
- Table 13: Global Data Center UPS Market Revenue Million Forecast, by Country 2019 & 2032
- Table 14: Global Data Center UPS Market Volume K Unit Forecast, by Country 2019 & 2032
- Table 15: Global Data Center UPS Market Revenue Million Forecast, by Country 2019 & 2032
- Table 16: Global Data Center UPS Market Volume K Unit Forecast, by Country 2019 & 2032
- Table 17: Global Data Center UPS Market Revenue Million Forecast, by Country 2019 & 2032
- Table 18: Global Data Center UPS Market Volume K Unit Forecast, by Country 2019 & 2032
- Table 19: Global Data Center UPS Market Revenue Million Forecast, by Country 2019 & 2032
- Table 20: Global Data Center UPS Market Volume K Unit Forecast, by Country 2019 & 2032
- Table 21: Global Data Center UPS Market Revenue Million Forecast, by Country 2019 & 2032
- Table 22: Global Data Center UPS Market Volume K Unit Forecast, by Country 2019 & 2032
- Table 23: Global Data Center UPS Market Revenue Million Forecast, by UPS Type 2019 & 2032
- Table 24: Global Data Center UPS Market Volume K Unit Forecast, by UPS Type 2019 & 2032
- Table 25: Global Data Center UPS Market Revenue Million Forecast, by Size of Data Center 2019 & 2032
- Table 26: Global Data Center UPS Market Volume K Unit Forecast, by Size of Data Center 2019 & 2032
- Table 27: Global Data Center UPS Market Revenue Million Forecast, by End-user Vertical 2019 & 2032
- Table 28: Global Data Center UPS Market Volume K Unit Forecast, by End-user Vertical 2019 & 2032
- Table 29: Global Data Center UPS Market Revenue Million Forecast, by Country 2019 & 2032
- Table 30: Global Data Center UPS Market Volume K Unit Forecast, by Country 2019 & 2032
- Table 31: Global Data Center UPS Market Revenue Million Forecast, by UPS Type 2019 & 2032
- Table 32: Global Data Center UPS Market Volume K Unit Forecast, by UPS Type 2019 & 2032
- Table 33: Global Data Center UPS Market Revenue Million Forecast, by Size of Data Center 2019 & 2032
- Table 34: Global Data Center UPS Market Volume K Unit Forecast, by Size of Data Center 2019 & 2032
- Table 35: Global Data Center UPS Market Revenue Million Forecast, by End-user Vertical 2019 & 2032
- Table 36: Global Data Center UPS Market Volume K Unit Forecast, by End-user Vertical 2019 & 2032
- Table 37: Global Data Center UPS Market Revenue Million Forecast, by Country 2019 & 2032
- Table 38: Global Data Center UPS Market Volume K Unit Forecast, by Country 2019 & 2032
- Table 39: Global Data Center UPS Market Revenue Million Forecast, by UPS Type 2019 & 2032
- Table 40: Global Data Center UPS Market Volume K Unit Forecast, by UPS Type 2019 & 2032
- Table 41: Global Data Center UPS Market Revenue Million Forecast, by Size of Data Center 2019 & 2032
- Table 42: Global Data Center UPS Market Volume K Unit Forecast, by Size of Data Center 2019 & 2032
- Table 43: Global Data Center UPS Market Revenue Million Forecast, by End-user Vertical 2019 & 2032
- Table 44: Global Data Center UPS Market Volume K Unit Forecast, by End-user Vertical 2019 & 2032
- Table 45: Global Data Center UPS Market Revenue Million Forecast, by Country 2019 & 2032
- Table 46: Global Data Center UPS Market Volume K Unit Forecast, by Country 2019 & 2032
- Table 47: Global Data Center UPS Market Revenue Million Forecast, by UPS Type 2019 & 2032
- Table 48: Global Data Center UPS Market Volume K Unit Forecast, by UPS Type 2019 & 2032
- Table 49: Global Data Center UPS Market Revenue Million Forecast, by Size of Data Center 2019 & 2032
- Table 50: Global Data Center UPS Market Volume K Unit Forecast, by Size of Data Center 2019 & 2032
- Table 51: Global Data Center UPS Market Revenue Million Forecast, by End-user Vertical 2019 & 2032
- Table 52: Global Data Center UPS Market Volume K Unit Forecast, by End-user Vertical 2019 & 2032
- Table 53: Global Data Center UPS Market Revenue Million Forecast, by Country 2019 & 2032
- Table 54: Global Data Center UPS Market Volume K Unit Forecast, by Country 2019 & 2032
- Table 55: Global Data Center UPS Market Revenue Million Forecast, by UPS Type 2019 & 2032
- Table 56: Global Data Center UPS Market Volume K Unit Forecast, by UPS Type 2019 & 2032
- Table 57: Global Data Center UPS Market Revenue Million Forecast, by Size of Data Center 2019 & 2032
- Table 58: Global Data Center UPS Market Volume K Unit Forecast, by Size of Data Center 2019 & 2032
- Table 59: Global Data Center UPS Market Revenue Million Forecast, by End-user Vertical 2019 & 2032
- Table 60: Global Data Center UPS Market Volume K Unit Forecast, by End-user Vertical 2019 & 2032
- Table 61: Global Data Center UPS Market Revenue Million Forecast, by Country 2019 & 2032
- Table 62: Global Data Center UPS Market Volume K Unit Forecast, by Country 2019 & 2032
- Table 63: Global Data Center UPS Market Revenue Million Forecast, by UPS Type 2019 & 2032
- Table 64: Global Data Center UPS Market Volume K Unit Forecast, by UPS Type 2019 & 2032
- Table 65: Global Data Center UPS Market Revenue Million Forecast, by Size of Data Center 2019 & 2032
- Table 66: Global Data Center UPS Market Volume K Unit Forecast, by Size of Data Center 2019 & 2032
- Table 67: Global Data Center UPS Market Revenue Million Forecast, by End-user Vertical 2019 & 2032
- Table 68: Global Data Center UPS Market Volume K Unit Forecast, by End-user Vertical 2019 & 2032
- Table 69: Global Data Center UPS Market Revenue Million Forecast, by Country 2019 & 2032
- Table 70: Global Data Center UPS Market Volume K Unit Forecast, by Country 2019 & 2032
Frequently Asked Questions
1. What is the projected Compound Annual Growth Rate (CAGR) of the Data Center UPS Market?
The projected CAGR is approximately 7.05%.
2. Which companies are prominent players in the Data Center UPS Market?
Key companies in the market include Toshiba Corporatio, SolarEdge Technologies Inc (Gamatronic Electronic Industries), Mitsubishi Electric Corpration, Vertiv Holdings Co, Piller Group, SOCOMEC Group, Riello SPA, Schneider Electric SE, Power Innovations International, ABB Group, Eaton Corporation.
3. What are the main segments of the Data Center UPS Market?
The market segments include UPS Type, Size of Data Center, End-user Vertical.
4. Can you provide details about the market size?
The market size is estimated to be USD XX Million as of 2022.
5. What are some drivers contributing to market growth?
Demand in Renewable Energy Commercialization; Growing Trend of Digitization and Adoption of Connected Solution.
6. What are the notable trends driving market growth?
Double Conversion Online Accounts for a Significant Market Share.
7. Are there any restraints impacting market growth?
Volatile Raw Material Prices.
8. Can you provide examples of recent developments in the market?
Apr 2022: Numeric, a UPS manufacturer and a company of Legrand Group, announced the launch of its new 3 Phase UPS, Keor XPE 3, for Data Centres. The company's Keor XPE 3 is a high-power modular and scalable UPS with a 500 KW – 2.1 MW power rating. It can have a maximum of 7 power units, each with a power rating of 250-300 KW.
9. What pricing options are available for accessing the report?
Pricing options include single-user, multi-user, and enterprise licenses priced at USD 4750, USD 5250, and USD 8750 respectively.
10. Is the market size provided in terms of value or volume?
The market size is provided in terms of value, measured in Million and volume, measured in K Unit.
11. Are there any specific market keywords associated with the report?
Yes, the market keyword associated with the report is "Data Center UPS Market," which aids in identifying and referencing the specific market segment covered.
12. How do I determine which pricing option suits my needs best?
The pricing options vary based on user requirements and access needs. Individual users may opt for single-user licenses, while businesses requiring broader access may choose multi-user or enterprise licenses for cost-effective access to the report.
13. Are there any additional resources or data provided in the Data Center UPS Market report?
While the report offers comprehensive insights, it's advisable to review the specific contents or supplementary materials provided to ascertain if additional resources or data are available.
14. How can I stay updated on further developments or reports in the Data Center UPS Market?
To stay informed about further developments, trends, and reports in the Data Center UPS Market, consider subscribing to industry newsletters, following relevant companies and organizations, or regularly checking reputable industry news sources and publications.
Methodology
Step 1 - Identification of Relevant Samples Size from Population Database


Step 2 - Approaches for Defining Global Market Size (Value, Volume* & Price*)

Note*: In applicable scenarios
Step 3 - Data Sources
Primary Research
- Web Analytics
- Survey Reports
- Research Institute
- Latest Research Reports
- Opinion Leaders
Secondary Research
- Annual Reports
- White Paper
- Latest Press Release
- Industry Association
- Paid Database
- Investor Presentations

Step 4 - Data Triangulation
Involves using different sources of information in order to increase the validity of a study
These sources are likely to be stakeholders in a program - participants, other researchers, program staff, other community members, and so on.
Then we put all data in single framework & apply various statistical tools to find out the dynamic on the market.
During the analysis stage, feedback from the stakeholder groups would be compared to determine areas of agreement as well as areas of divergence


