
Key Insights
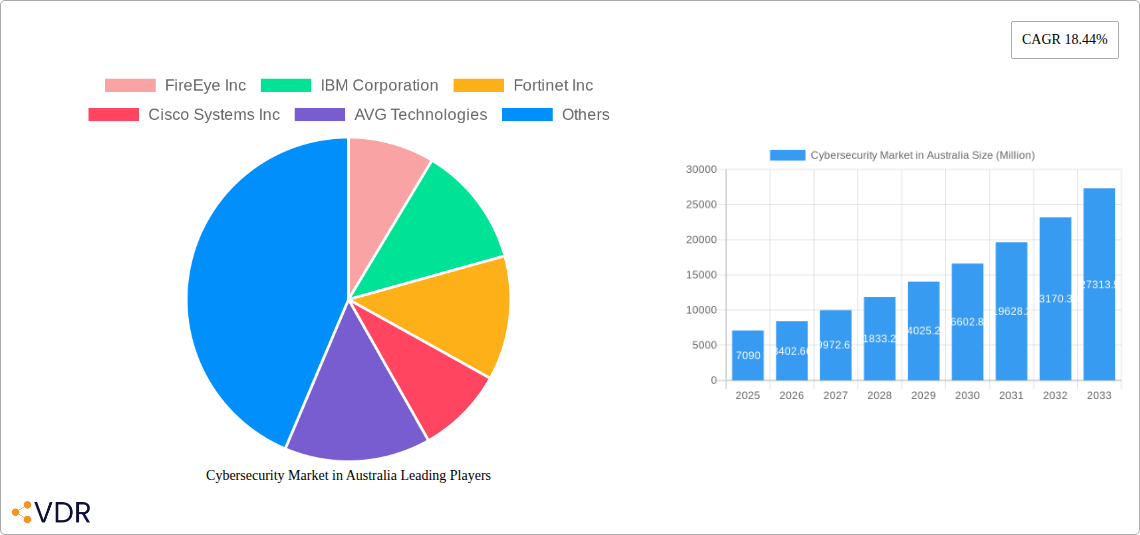
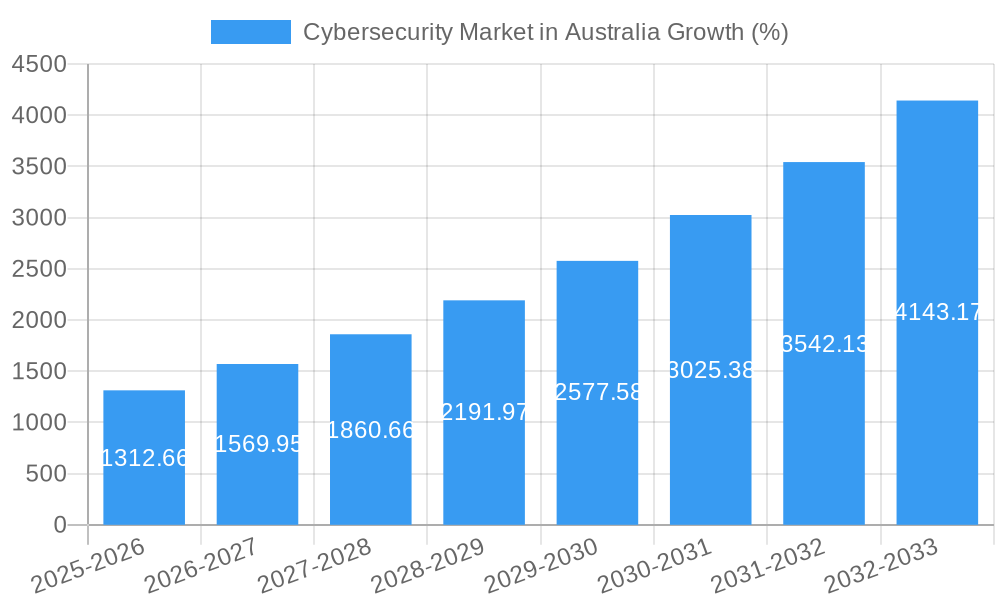
The Australian cybersecurity market, valued at $7.09 billion in 2025, is experiencing robust growth, projected to expand at a compound annual growth rate (CAGR) of 18.44% from 2025 to 2033. This significant expansion is fueled by several key drivers. Increasing digitalization across various sectors, including BFSI (Banking, Financial Services, and Insurance), healthcare, and government, is creating a surge in demand for robust security solutions. The rising frequency and sophistication of cyberattacks, coupled with stringent government regulations aimed at data protection (like the Notifiable Data Breaches scheme), are compelling organizations to invest heavily in cybersecurity measures. Furthermore, the adoption of cloud computing and the expanding Internet of Things (IoT) ecosystem are introducing new attack vectors, further driving market growth. The market is segmented by end-user industry, product type (including application security, cloud security, and network security equipment), service (professional and managed services), and deployment (on-premise and cloud). The strong presence of established players like IBM, Cisco, and Fortinet, alongside specialized cybersecurity firms, ensures a competitive and innovative landscape.
Looking ahead, several trends will shape the market's trajectory. The increasing adoption of artificial intelligence (AI) and machine learning (ML) in cybersecurity solutions will improve threat detection and response capabilities. Furthermore, the growing emphasis on zero trust security models and proactive threat intelligence will redefine security architectures. Despite the positive outlook, the market faces some challenges. The skills shortage in cybersecurity professionals poses a significant hurdle, hindering the effective implementation and management of security solutions. Also, the high cost of advanced security technologies can be a barrier to entry for smaller businesses. However, government initiatives promoting cybersecurity awareness and skills development, coupled with the rising cost of cyber breaches, will likely mitigate these restraints in the long term. The Australian cybersecurity market is poised for continued expansion, driven by a combination of technological advancements, regulatory pressures, and a growing awareness of cyber risks.
Cybersecurity Market in Australia: A Comprehensive Market Report (2019-2033)
This comprehensive report provides an in-depth analysis of the Australian cybersecurity market, covering market dynamics, growth trends, key players, and future outlook. With a study period spanning 2019-2033, a base year of 2025, and a forecast period of 2025-2033, this report is an essential resource for industry professionals, investors, and strategic decision-makers. The report segments the market by end-user industry, product type, service type, and deployment model, offering granular insights into various market facets. The total market value in 2025 is estimated at xx Million.
Cybersecurity Market in Australia Market Dynamics & Structure
The Australian cybersecurity market is characterized by a moderately consolidated structure, with several major players holding significant market share. The market is driven by increasing technological innovation, particularly in areas like AI-driven threat detection and cloud security. Stringent regulatory frameworks, such as the Notifiable Data Breaches scheme, are driving adoption of advanced security solutions. The market also sees competition from various product substitutes, such as open-source security tools. The end-user demographic is expanding to include SMEs, alongside large enterprises and government entities. M&A activity has been relatively moderate, with xx deals recorded between 2019 and 2024, representing a xx% increase compared to the previous period.
- Market Concentration: Moderately consolidated, with top 5 players holding approximately xx% market share in 2024.
- Technological Innovation: AI-driven threat detection, advanced endpoint protection, and cloud security solutions are key drivers.
- Regulatory Framework: Notifiable Data Breaches scheme, and other privacy regulations, are influencing market growth.
- Competitive Substitutes: Open-source security tools and DIY solutions pose a competitive threat to commercial offerings.
- End-User Demographics: Expanding beyond large enterprises to include SMEs and government agencies.
- M&A Activity: xx M&A deals recorded between 2019 and 2024, indicating a growing interest in market consolidation.
Cybersecurity Market in Australia Growth Trends & Insights
The Australian cybersecurity market has witnessed robust growth over the past few years, driven by the increasing frequency and sophistication of cyberattacks. The market size expanded from xx Million in 2019 to an estimated xx Million in 2024, exhibiting a CAGR of xx%. This growth is expected to continue, with the market projected to reach xx Million by 2033, driven by factors such as rising digitalization, adoption of cloud technologies, and increased government initiatives to enhance cybersecurity posture. Market penetration of advanced security solutions is also increasing, particularly in sectors like BFSI and government. Technological disruptions, including the rise of AI and IoT, are also reshaping the market landscape. Consumer behavior is shifting towards increased awareness and adoption of proactive security measures.
Dominant Regions, Countries, or Segments in Cybersecurity Market in Australia
The Australian cybersecurity market is relatively geographically concentrated, with major cities like Sydney and Melbourne exhibiting higher adoption rates due to the presence of a larger number of businesses and government agencies. By end-user industry, BFSI and government sectors are currently the largest contributors to market revenue, primarily driven by their stringent regulatory requirements and the critical nature of their data. Within product types, Network Security Equipment and Cloud Security are leading segments, while in services, Managed Security Services are gaining significant traction.
- By End-User Industry:
- BFSI: High growth due to stringent regulatory compliance and sensitive data.
- Government: Strong demand for robust security solutions to protect critical infrastructure.
- Healthcare: Increasing focus on data privacy and patient information security.
- By Product Type:
- Network Security Equipment: High demand driven by increasing network complexity.
- Cloud Security: Rapid growth driven by the increasing adoption of cloud services.
- By Service Type:
- Managed Security Services: Growing adoption due to the need for cost-effective and scalable solutions.
Cybersecurity Market in Australia Product Landscape
The Australian cybersecurity market is characterized by a diverse product landscape, including solutions such as advanced endpoint protection, next-generation firewalls, cloud security platforms, data loss prevention (DLP) tools, and security information and event management (SIEM) systems. The key focus is on delivering solutions with enhanced capabilities, such as AI-powered threat detection and automated incident response. Vendors are also focusing on providing integrated solutions that address multiple security needs, improving ease of management and reducing complexity.
Key Drivers, Barriers & Challenges in Cybersecurity Market in Australia
Key Drivers: Increased cyber threats, growing digitalization, stringent data privacy regulations (like the Notifiable Data Breaches scheme), and government initiatives promoting cybersecurity awareness.
Key Challenges: High cost of implementation for advanced security solutions for SMEs, skills shortage in the cybersecurity workforce, complex regulatory landscape, and the emergence of sophisticated cyberattacks that can bypass traditional security measures. The impact of these challenges is estimated to reduce the market growth by approximately xx% in the forecast period.
Emerging Opportunities in Cybersecurity Market in Australia
Emerging opportunities include the growth of the IoT security market, increasing demand for managed security services (MSS), expansion into the SME segment, and adoption of blockchain technology for enhanced security. Furthermore, the rise of AI and machine learning is creating opportunities for advanced threat detection and response capabilities.
Growth Accelerators in the Cybersecurity Market in Australia Industry
Technological advancements, strategic partnerships between security vendors and technology providers, and government initiatives promoting cybersecurity are key growth accelerators. Expanding awareness and adoption of proactive security measures amongst businesses will also fuel market expansion in the coming years.
Key Players Shaping the Cybersecurity Market in Australia Market
- FireEye Inc
- IBM Corporation
- Fortinet Inc
- Cisco Systems Inc
- AVG Technologies
- CyberArk Software Ltd
- Dell Technologies Inc
- Check Point Software Technologies Ltd
- Imperva Inc
Notable Milestones in Cybersecurity Market in Australia Sector
- February 2022: Joint Cybersecurity Advisory issued by ACSC, CISA, FBI, and NSA highlighting the growing ransomware threat.
- February 2022: IBM announced a multi-million dollar investment in cybersecurity resources for the APAC region, including Australia.
- August 2022: Wipro launched Wipro Shelde Australia, a sovereign cybersecurity offering for the Australian government.
- December 2022: Navitas launched a private bug bounty program to improve its cybersecurity posture.
In-Depth Cybersecurity Market in Australia Market Outlook
The Australian cybersecurity market is poised for significant growth in the coming years, driven by the increasing adoption of digital technologies, rising cyber threats, and stringent regulatory requirements. Strategic partnerships and technological innovations will continue to shape the market landscape, presenting opportunities for both established players and emerging vendors. The focus on proactive security measures, advanced threat detection, and integrated solutions will further drive market expansion.
Cybersecurity Market in Australia Segmentation
-
1. Product Type
- 1.1. Application Security
- 1.2. Cloud Security
- 1.3. Consumer Security Software
- 1.4. Data Security
- 1.5. Identity Access Management
- 1.6. Infrastructure Protection
- 1.7. Integrated Risk Management
- 1.8. Network Security Equipment
- 1.9. Other Solution Types
-
2. Service
- 2.1. Professional
- 2.2. Managed
-
3. Deployment
- 3.1. On-Premise
- 3.2. Cloud
-
4. End-User Industry
- 4.1. BFSI
- 4.2. Healthcare
- 4.3. Aerospace and Defense
- 4.4. IT and Telecommunication
- 4.5. Government
- 4.6. Retail
- 4.7. Manufacturing
- 4.8. Other End-user Industries
Cybersecurity Market in Australia Segmentation By Geography
-
1. North America
- 1.1. United States
- 1.2. Canada
- 1.3. Mexico
-
2. South America
- 2.1. Brazil
- 2.2. Argentina
- 2.3. Rest of South America
-
3. Europe
- 3.1. United Kingdom
- 3.2. Germany
- 3.3. France
- 3.4. Italy
- 3.5. Spain
- 3.6. Russia
- 3.7. Benelux
- 3.8. Nordics
- 3.9. Rest of Europe
-
4. Middle East & Africa
- 4.1. Turkey
- 4.2. Israel
- 4.3. GCC
- 4.4. North Africa
- 4.5. South Africa
- 4.6. Rest of Middle East & Africa
-
5. Asia Pacific
- 5.1. China
- 5.2. India
- 5.3. Japan
- 5.4. South Korea
- 5.5. ASEAN
- 5.6. Oceania
- 5.7. Rest of Asia Pacific
Cybersecurity Market in Australia REPORT HIGHLIGHTS
| Aspects | Details |
|---|---|
| Study Period | 2019-2033 |
| Base Year | 2024 |
| Estimated Year | 2025 |
| Forecast Period | 2025-2033 |
| Historical Period | 2019-2024 |
| Growth Rate | CAGR of 18.44% from 2019-2033 |
| Segmentation |
|
Table of Contents
- 1. Introduction
- 1.1. Research Scope
- 1.2. Market Segmentation
- 1.3. Research Methodology
- 1.4. Definitions and Assumptions
- 2. Executive Summary
- 2.1. Introduction
- 3. Market Dynamics
- 3.1. Introduction
- 3.2. Market Drivers
- 3.2.1. Rapidly Increasing Cybersecurity Incidents and Regulations Requiring their Reporting; Growing M2M/IoT Connections Demanding Strengthened Cybersecurity in Enterprises
- 3.3. Market Restrains
- 3.3.1. Lack of 3D Content Development; Cost-Intensive 3D Displays
- 3.4. Market Trends
- 3.4.1. Data Security to Show Significant Growth
- 4. Market Factor Analysis
- 4.1. Porters Five Forces
- 4.2. Supply/Value Chain
- 4.3. PESTEL analysis
- 4.4. Market Entropy
- 4.5. Patent/Trademark Analysis
- 5. Global Cybersecurity Market in Australia Analysis, Insights and Forecast, 2019-2031
- 5.1. Market Analysis, Insights and Forecast - by Product Type
- 5.1.1. Application Security
- 5.1.2. Cloud Security
- 5.1.3. Consumer Security Software
- 5.1.4. Data Security
- 5.1.5. Identity Access Management
- 5.1.6. Infrastructure Protection
- 5.1.7. Integrated Risk Management
- 5.1.8. Network Security Equipment
- 5.1.9. Other Solution Types
- 5.2. Market Analysis, Insights and Forecast - by Service
- 5.2.1. Professional
- 5.2.2. Managed
- 5.3. Market Analysis, Insights and Forecast - by Deployment
- 5.3.1. On-Premise
- 5.3.2. Cloud
- 5.4. Market Analysis, Insights and Forecast - by End-User Industry
- 5.4.1. BFSI
- 5.4.2. Healthcare
- 5.4.3. Aerospace and Defense
- 5.4.4. IT and Telecommunication
- 5.4.5. Government
- 5.4.6. Retail
- 5.4.7. Manufacturing
- 5.4.8. Other End-user Industries
- 5.5. Market Analysis, Insights and Forecast - by Region
- 5.5.1. North America
- 5.5.2. South America
- 5.5.3. Europe
- 5.5.4. Middle East & Africa
- 5.5.5. Asia Pacific
- 5.1. Market Analysis, Insights and Forecast - by Product Type
- 6. North America Cybersecurity Market in Australia Analysis, Insights and Forecast, 2019-2031
- 6.1. Market Analysis, Insights and Forecast - by Product Type
- 6.1.1. Application Security
- 6.1.2. Cloud Security
- 6.1.3. Consumer Security Software
- 6.1.4. Data Security
- 6.1.5. Identity Access Management
- 6.1.6. Infrastructure Protection
- 6.1.7. Integrated Risk Management
- 6.1.8. Network Security Equipment
- 6.1.9. Other Solution Types
- 6.2. Market Analysis, Insights and Forecast - by Service
- 6.2.1. Professional
- 6.2.2. Managed
- 6.3. Market Analysis, Insights and Forecast - by Deployment
- 6.3.1. On-Premise
- 6.3.2. Cloud
- 6.4. Market Analysis, Insights and Forecast - by End-User Industry
- 6.4.1. BFSI
- 6.4.2. Healthcare
- 6.4.3. Aerospace and Defense
- 6.4.4. IT and Telecommunication
- 6.4.5. Government
- 6.4.6. Retail
- 6.4.7. Manufacturing
- 6.4.8. Other End-user Industries
- 6.1. Market Analysis, Insights and Forecast - by Product Type
- 7. South America Cybersecurity Market in Australia Analysis, Insights and Forecast, 2019-2031
- 7.1. Market Analysis, Insights and Forecast - by Product Type
- 7.1.1. Application Security
- 7.1.2. Cloud Security
- 7.1.3. Consumer Security Software
- 7.1.4. Data Security
- 7.1.5. Identity Access Management
- 7.1.6. Infrastructure Protection
- 7.1.7. Integrated Risk Management
- 7.1.8. Network Security Equipment
- 7.1.9. Other Solution Types
- 7.2. Market Analysis, Insights and Forecast - by Service
- 7.2.1. Professional
- 7.2.2. Managed
- 7.3. Market Analysis, Insights and Forecast - by Deployment
- 7.3.1. On-Premise
- 7.3.2. Cloud
- 7.4. Market Analysis, Insights and Forecast - by End-User Industry
- 7.4.1. BFSI
- 7.4.2. Healthcare
- 7.4.3. Aerospace and Defense
- 7.4.4. IT and Telecommunication
- 7.4.5. Government
- 7.4.6. Retail
- 7.4.7. Manufacturing
- 7.4.8. Other End-user Industries
- 7.1. Market Analysis, Insights and Forecast - by Product Type
- 8. Europe Cybersecurity Market in Australia Analysis, Insights and Forecast, 2019-2031
- 8.1. Market Analysis, Insights and Forecast - by Product Type
- 8.1.1. Application Security
- 8.1.2. Cloud Security
- 8.1.3. Consumer Security Software
- 8.1.4. Data Security
- 8.1.5. Identity Access Management
- 8.1.6. Infrastructure Protection
- 8.1.7. Integrated Risk Management
- 8.1.8. Network Security Equipment
- 8.1.9. Other Solution Types
- 8.2. Market Analysis, Insights and Forecast - by Service
- 8.2.1. Professional
- 8.2.2. Managed
- 8.3. Market Analysis, Insights and Forecast - by Deployment
- 8.3.1. On-Premise
- 8.3.2. Cloud
- 8.4. Market Analysis, Insights and Forecast - by End-User Industry
- 8.4.1. BFSI
- 8.4.2. Healthcare
- 8.4.3. Aerospace and Defense
- 8.4.4. IT and Telecommunication
- 8.4.5. Government
- 8.4.6. Retail
- 8.4.7. Manufacturing
- 8.4.8. Other End-user Industries
- 8.1. Market Analysis, Insights and Forecast - by Product Type
- 9. Middle East & Africa Cybersecurity Market in Australia Analysis, Insights and Forecast, 2019-2031
- 9.1. Market Analysis, Insights and Forecast - by Product Type
- 9.1.1. Application Security
- 9.1.2. Cloud Security
- 9.1.3. Consumer Security Software
- 9.1.4. Data Security
- 9.1.5. Identity Access Management
- 9.1.6. Infrastructure Protection
- 9.1.7. Integrated Risk Management
- 9.1.8. Network Security Equipment
- 9.1.9. Other Solution Types
- 9.2. Market Analysis, Insights and Forecast - by Service
- 9.2.1. Professional
- 9.2.2. Managed
- 9.3. Market Analysis, Insights and Forecast - by Deployment
- 9.3.1. On-Premise
- 9.3.2. Cloud
- 9.4. Market Analysis, Insights and Forecast - by End-User Industry
- 9.4.1. BFSI
- 9.4.2. Healthcare
- 9.4.3. Aerospace and Defense
- 9.4.4. IT and Telecommunication
- 9.4.5. Government
- 9.4.6. Retail
- 9.4.7. Manufacturing
- 9.4.8. Other End-user Industries
- 9.1. Market Analysis, Insights and Forecast - by Product Type
- 10. Asia Pacific Cybersecurity Market in Australia Analysis, Insights and Forecast, 2019-2031
- 10.1. Market Analysis, Insights and Forecast - by Product Type
- 10.1.1. Application Security
- 10.1.2. Cloud Security
- 10.1.3. Consumer Security Software
- 10.1.4. Data Security
- 10.1.5. Identity Access Management
- 10.1.6. Infrastructure Protection
- 10.1.7. Integrated Risk Management
- 10.1.8. Network Security Equipment
- 10.1.9. Other Solution Types
- 10.2. Market Analysis, Insights and Forecast - by Service
- 10.2.1. Professional
- 10.2.2. Managed
- 10.3. Market Analysis, Insights and Forecast - by Deployment
- 10.3.1. On-Premise
- 10.3.2. Cloud
- 10.4. Market Analysis, Insights and Forecast - by End-User Industry
- 10.4.1. BFSI
- 10.4.2. Healthcare
- 10.4.3. Aerospace and Defense
- 10.4.4. IT and Telecommunication
- 10.4.5. Government
- 10.4.6. Retail
- 10.4.7. Manufacturing
- 10.4.8. Other End-user Industries
- 10.1. Market Analysis, Insights and Forecast - by Product Type
- 11. Competitive Analysis
- 11.1. Global Market Share Analysis 2024
- 11.2. Company Profiles
- 11.2.1 FireEye Inc
- 11.2.1.1. Overview
- 11.2.1.2. Products
- 11.2.1.3. SWOT Analysis
- 11.2.1.4. Recent Developments
- 11.2.1.5. Financials (Based on Availability)
- 11.2.2 IBM Corporation
- 11.2.2.1. Overview
- 11.2.2.2. Products
- 11.2.2.3. SWOT Analysis
- 11.2.2.4. Recent Developments
- 11.2.2.5. Financials (Based on Availability)
- 11.2.3 Fortinet Inc
- 11.2.3.1. Overview
- 11.2.3.2. Products
- 11.2.3.3. SWOT Analysis
- 11.2.3.4. Recent Developments
- 11.2.3.5. Financials (Based on Availability)
- 11.2.4 Cisco Systems Inc
- 11.2.4.1. Overview
- 11.2.4.2. Products
- 11.2.4.3. SWOT Analysis
- 11.2.4.4. Recent Developments
- 11.2.4.5. Financials (Based on Availability)
- 11.2.5 AVG Technologies
- 11.2.5.1. Overview
- 11.2.5.2. Products
- 11.2.5.3. SWOT Analysis
- 11.2.5.4. Recent Developments
- 11.2.5.5. Financials (Based on Availability)
- 11.2.6 Cyber Ark Software Ltd
- 11.2.6.1. Overview
- 11.2.6.2. Products
- 11.2.6.3. SWOT Analysis
- 11.2.6.4. Recent Developments
- 11.2.6.5. Financials (Based on Availability)
- 11.2.7 Dell Technologies Inc
- 11.2.7.1. Overview
- 11.2.7.2. Products
- 11.2.7.3. SWOT Analysis
- 11.2.7.4. Recent Developments
- 11.2.7.5. Financials (Based on Availability)
- 11.2.8 Check Point Software Technologies Ltd?
- 11.2.8.1. Overview
- 11.2.8.2. Products
- 11.2.8.3. SWOT Analysis
- 11.2.8.4. Recent Developments
- 11.2.8.5. Financials (Based on Availability)
- 11.2.9 Imperva Inc
- 11.2.9.1. Overview
- 11.2.9.2. Products
- 11.2.9.3. SWOT Analysis
- 11.2.9.4. Recent Developments
- 11.2.9.5. Financials (Based on Availability)
- 11.2.1 FireEye Inc
List of Figures
- Figure 1: Global Cybersecurity Market in Australia Revenue Breakdown (Million, %) by Region 2024 & 2032
- Figure 2: Global Cybersecurity Market in Australia Volume Breakdown (K Unit, %) by Region 2024 & 2032
- Figure 3: Australia Cybersecurity Market in Australia Revenue (Million), by Country 2024 & 2032
- Figure 4: Australia Cybersecurity Market in Australia Volume (K Unit), by Country 2024 & 2032
- Figure 5: Australia Cybersecurity Market in Australia Revenue Share (%), by Country 2024 & 2032
- Figure 6: Australia Cybersecurity Market in Australia Volume Share (%), by Country 2024 & 2032
- Figure 7: North America Cybersecurity Market in Australia Revenue (Million), by Product Type 2024 & 2032
- Figure 8: North America Cybersecurity Market in Australia Volume (K Unit), by Product Type 2024 & 2032
- Figure 9: North America Cybersecurity Market in Australia Revenue Share (%), by Product Type 2024 & 2032
- Figure 10: North America Cybersecurity Market in Australia Volume Share (%), by Product Type 2024 & 2032
- Figure 11: North America Cybersecurity Market in Australia Revenue (Million), by Service 2024 & 2032
- Figure 12: North America Cybersecurity Market in Australia Volume (K Unit), by Service 2024 & 2032
- Figure 13: North America Cybersecurity Market in Australia Revenue Share (%), by Service 2024 & 2032
- Figure 14: North America Cybersecurity Market in Australia Volume Share (%), by Service 2024 & 2032
- Figure 15: North America Cybersecurity Market in Australia Revenue (Million), by Deployment 2024 & 2032
- Figure 16: North America Cybersecurity Market in Australia Volume (K Unit), by Deployment 2024 & 2032
- Figure 17: North America Cybersecurity Market in Australia Revenue Share (%), by Deployment 2024 & 2032
- Figure 18: North America Cybersecurity Market in Australia Volume Share (%), by Deployment 2024 & 2032
- Figure 19: North America Cybersecurity Market in Australia Revenue (Million), by End-User Industry 2024 & 2032
- Figure 20: North America Cybersecurity Market in Australia Volume (K Unit), by End-User Industry 2024 & 2032
- Figure 21: North America Cybersecurity Market in Australia Revenue Share (%), by End-User Industry 2024 & 2032
- Figure 22: North America Cybersecurity Market in Australia Volume Share (%), by End-User Industry 2024 & 2032
- Figure 23: North America Cybersecurity Market in Australia Revenue (Million), by Country 2024 & 2032
- Figure 24: North America Cybersecurity Market in Australia Volume (K Unit), by Country 2024 & 2032
- Figure 25: North America Cybersecurity Market in Australia Revenue Share (%), by Country 2024 & 2032
- Figure 26: North America Cybersecurity Market in Australia Volume Share (%), by Country 2024 & 2032
- Figure 27: South America Cybersecurity Market in Australia Revenue (Million), by Product Type 2024 & 2032
- Figure 28: South America Cybersecurity Market in Australia Volume (K Unit), by Product Type 2024 & 2032
- Figure 29: South America Cybersecurity Market in Australia Revenue Share (%), by Product Type 2024 & 2032
- Figure 30: South America Cybersecurity Market in Australia Volume Share (%), by Product Type 2024 & 2032
- Figure 31: South America Cybersecurity Market in Australia Revenue (Million), by Service 2024 & 2032
- Figure 32: South America Cybersecurity Market in Australia Volume (K Unit), by Service 2024 & 2032
- Figure 33: South America Cybersecurity Market in Australia Revenue Share (%), by Service 2024 & 2032
- Figure 34: South America Cybersecurity Market in Australia Volume Share (%), by Service 2024 & 2032
- Figure 35: South America Cybersecurity Market in Australia Revenue (Million), by Deployment 2024 & 2032
- Figure 36: South America Cybersecurity Market in Australia Volume (K Unit), by Deployment 2024 & 2032
- Figure 37: South America Cybersecurity Market in Australia Revenue Share (%), by Deployment 2024 & 2032
- Figure 38: South America Cybersecurity Market in Australia Volume Share (%), by Deployment 2024 & 2032
- Figure 39: South America Cybersecurity Market in Australia Revenue (Million), by End-User Industry 2024 & 2032
- Figure 40: South America Cybersecurity Market in Australia Volume (K Unit), by End-User Industry 2024 & 2032
- Figure 41: South America Cybersecurity Market in Australia Revenue Share (%), by End-User Industry 2024 & 2032
- Figure 42: South America Cybersecurity Market in Australia Volume Share (%), by End-User Industry 2024 & 2032
- Figure 43: South America Cybersecurity Market in Australia Revenue (Million), by Country 2024 & 2032
- Figure 44: South America Cybersecurity Market in Australia Volume (K Unit), by Country 2024 & 2032
- Figure 45: South America Cybersecurity Market in Australia Revenue Share (%), by Country 2024 & 2032
- Figure 46: South America Cybersecurity Market in Australia Volume Share (%), by Country 2024 & 2032
- Figure 47: Europe Cybersecurity Market in Australia Revenue (Million), by Product Type 2024 & 2032
- Figure 48: Europe Cybersecurity Market in Australia Volume (K Unit), by Product Type 2024 & 2032
- Figure 49: Europe Cybersecurity Market in Australia Revenue Share (%), by Product Type 2024 & 2032
- Figure 50: Europe Cybersecurity Market in Australia Volume Share (%), by Product Type 2024 & 2032
- Figure 51: Europe Cybersecurity Market in Australia Revenue (Million), by Service 2024 & 2032
- Figure 52: Europe Cybersecurity Market in Australia Volume (K Unit), by Service 2024 & 2032
- Figure 53: Europe Cybersecurity Market in Australia Revenue Share (%), by Service 2024 & 2032
- Figure 54: Europe Cybersecurity Market in Australia Volume Share (%), by Service 2024 & 2032
- Figure 55: Europe Cybersecurity Market in Australia Revenue (Million), by Deployment 2024 & 2032
- Figure 56: Europe Cybersecurity Market in Australia Volume (K Unit), by Deployment 2024 & 2032
- Figure 57: Europe Cybersecurity Market in Australia Revenue Share (%), by Deployment 2024 & 2032
- Figure 58: Europe Cybersecurity Market in Australia Volume Share (%), by Deployment 2024 & 2032
- Figure 59: Europe Cybersecurity Market in Australia Revenue (Million), by End-User Industry 2024 & 2032
- Figure 60: Europe Cybersecurity Market in Australia Volume (K Unit), by End-User Industry 2024 & 2032
- Figure 61: Europe Cybersecurity Market in Australia Revenue Share (%), by End-User Industry 2024 & 2032
- Figure 62: Europe Cybersecurity Market in Australia Volume Share (%), by End-User Industry 2024 & 2032
- Figure 63: Europe Cybersecurity Market in Australia Revenue (Million), by Country 2024 & 2032
- Figure 64: Europe Cybersecurity Market in Australia Volume (K Unit), by Country 2024 & 2032
- Figure 65: Europe Cybersecurity Market in Australia Revenue Share (%), by Country 2024 & 2032
- Figure 66: Europe Cybersecurity Market in Australia Volume Share (%), by Country 2024 & 2032
- Figure 67: Middle East & Africa Cybersecurity Market in Australia Revenue (Million), by Product Type 2024 & 2032
- Figure 68: Middle East & Africa Cybersecurity Market in Australia Volume (K Unit), by Product Type 2024 & 2032
- Figure 69: Middle East & Africa Cybersecurity Market in Australia Revenue Share (%), by Product Type 2024 & 2032
- Figure 70: Middle East & Africa Cybersecurity Market in Australia Volume Share (%), by Product Type 2024 & 2032
- Figure 71: Middle East & Africa Cybersecurity Market in Australia Revenue (Million), by Service 2024 & 2032
- Figure 72: Middle East & Africa Cybersecurity Market in Australia Volume (K Unit), by Service 2024 & 2032
- Figure 73: Middle East & Africa Cybersecurity Market in Australia Revenue Share (%), by Service 2024 & 2032
- Figure 74: Middle East & Africa Cybersecurity Market in Australia Volume Share (%), by Service 2024 & 2032
- Figure 75: Middle East & Africa Cybersecurity Market in Australia Revenue (Million), by Deployment 2024 & 2032
- Figure 76: Middle East & Africa Cybersecurity Market in Australia Volume (K Unit), by Deployment 2024 & 2032
- Figure 77: Middle East & Africa Cybersecurity Market in Australia Revenue Share (%), by Deployment 2024 & 2032
- Figure 78: Middle East & Africa Cybersecurity Market in Australia Volume Share (%), by Deployment 2024 & 2032
- Figure 79: Middle East & Africa Cybersecurity Market in Australia Revenue (Million), by End-User Industry 2024 & 2032
- Figure 80: Middle East & Africa Cybersecurity Market in Australia Volume (K Unit), by End-User Industry 2024 & 2032
- Figure 81: Middle East & Africa Cybersecurity Market in Australia Revenue Share (%), by End-User Industry 2024 & 2032
- Figure 82: Middle East & Africa Cybersecurity Market in Australia Volume Share (%), by End-User Industry 2024 & 2032
- Figure 83: Middle East & Africa Cybersecurity Market in Australia Revenue (Million), by Country 2024 & 2032
- Figure 84: Middle East & Africa Cybersecurity Market in Australia Volume (K Unit), by Country 2024 & 2032
- Figure 85: Middle East & Africa Cybersecurity Market in Australia Revenue Share (%), by Country 2024 & 2032
- Figure 86: Middle East & Africa Cybersecurity Market in Australia Volume Share (%), by Country 2024 & 2032
- Figure 87: Asia Pacific Cybersecurity Market in Australia Revenue (Million), by Product Type 2024 & 2032
- Figure 88: Asia Pacific Cybersecurity Market in Australia Volume (K Unit), by Product Type 2024 & 2032
- Figure 89: Asia Pacific Cybersecurity Market in Australia Revenue Share (%), by Product Type 2024 & 2032
- Figure 90: Asia Pacific Cybersecurity Market in Australia Volume Share (%), by Product Type 2024 & 2032
- Figure 91: Asia Pacific Cybersecurity Market in Australia Revenue (Million), by Service 2024 & 2032
- Figure 92: Asia Pacific Cybersecurity Market in Australia Volume (K Unit), by Service 2024 & 2032
- Figure 93: Asia Pacific Cybersecurity Market in Australia Revenue Share (%), by Service 2024 & 2032
- Figure 94: Asia Pacific Cybersecurity Market in Australia Volume Share (%), by Service 2024 & 2032
- Figure 95: Asia Pacific Cybersecurity Market in Australia Revenue (Million), by Deployment 2024 & 2032
- Figure 96: Asia Pacific Cybersecurity Market in Australia Volume (K Unit), by Deployment 2024 & 2032
- Figure 97: Asia Pacific Cybersecurity Market in Australia Revenue Share (%), by Deployment 2024 & 2032
- Figure 98: Asia Pacific Cybersecurity Market in Australia Volume Share (%), by Deployment 2024 & 2032
- Figure 99: Asia Pacific Cybersecurity Market in Australia Revenue (Million), by End-User Industry 2024 & 2032
- Figure 100: Asia Pacific Cybersecurity Market in Australia Volume (K Unit), by End-User Industry 2024 & 2032
- Figure 101: Asia Pacific Cybersecurity Market in Australia Revenue Share (%), by End-User Industry 2024 & 2032
- Figure 102: Asia Pacific Cybersecurity Market in Australia Volume Share (%), by End-User Industry 2024 & 2032
- Figure 103: Asia Pacific Cybersecurity Market in Australia Revenue (Million), by Country 2024 & 2032
- Figure 104: Asia Pacific Cybersecurity Market in Australia Volume (K Unit), by Country 2024 & 2032
- Figure 105: Asia Pacific Cybersecurity Market in Australia Revenue Share (%), by Country 2024 & 2032
- Figure 106: Asia Pacific Cybersecurity Market in Australia Volume Share (%), by Country 2024 & 2032
List of Tables
- Table 1: Global Cybersecurity Market in Australia Revenue Million Forecast, by Region 2019 & 2032
- Table 2: Global Cybersecurity Market in Australia Volume K Unit Forecast, by Region 2019 & 2032
- Table 3: Global Cybersecurity Market in Australia Revenue Million Forecast, by Product Type 2019 & 2032
- Table 4: Global Cybersecurity Market in Australia Volume K Unit Forecast, by Product Type 2019 & 2032
- Table 5: Global Cybersecurity Market in Australia Revenue Million Forecast, by Service 2019 & 2032
- Table 6: Global Cybersecurity Market in Australia Volume K Unit Forecast, by Service 2019 & 2032
- Table 7: Global Cybersecurity Market in Australia Revenue Million Forecast, by Deployment 2019 & 2032
- Table 8: Global Cybersecurity Market in Australia Volume K Unit Forecast, by Deployment 2019 & 2032
- Table 9: Global Cybersecurity Market in Australia Revenue Million Forecast, by End-User Industry 2019 & 2032
- Table 10: Global Cybersecurity Market in Australia Volume K Unit Forecast, by End-User Industry 2019 & 2032
- Table 11: Global Cybersecurity Market in Australia Revenue Million Forecast, by Region 2019 & 2032
- Table 12: Global Cybersecurity Market in Australia Volume K Unit Forecast, by Region 2019 & 2032
- Table 13: Global Cybersecurity Market in Australia Revenue Million Forecast, by Country 2019 & 2032
- Table 14: Global Cybersecurity Market in Australia Volume K Unit Forecast, by Country 2019 & 2032
- Table 15: Global Cybersecurity Market in Australia Revenue Million Forecast, by Product Type 2019 & 2032
- Table 16: Global Cybersecurity Market in Australia Volume K Unit Forecast, by Product Type 2019 & 2032
- Table 17: Global Cybersecurity Market in Australia Revenue Million Forecast, by Service 2019 & 2032
- Table 18: Global Cybersecurity Market in Australia Volume K Unit Forecast, by Service 2019 & 2032
- Table 19: Global Cybersecurity Market in Australia Revenue Million Forecast, by Deployment 2019 & 2032
- Table 20: Global Cybersecurity Market in Australia Volume K Unit Forecast, by Deployment 2019 & 2032
- Table 21: Global Cybersecurity Market in Australia Revenue Million Forecast, by End-User Industry 2019 & 2032
- Table 22: Global Cybersecurity Market in Australia Volume K Unit Forecast, by End-User Industry 2019 & 2032
- Table 23: Global Cybersecurity Market in Australia Revenue Million Forecast, by Country 2019 & 2032
- Table 24: Global Cybersecurity Market in Australia Volume K Unit Forecast, by Country 2019 & 2032
- Table 25: United States Cybersecurity Market in Australia Revenue (Million) Forecast, by Application 2019 & 2032
- Table 26: United States Cybersecurity Market in Australia Volume (K Unit) Forecast, by Application 2019 & 2032
- Table 27: Canada Cybersecurity Market in Australia Revenue (Million) Forecast, by Application 2019 & 2032
- Table 28: Canada Cybersecurity Market in Australia Volume (K Unit) Forecast, by Application 2019 & 2032
- Table 29: Mexico Cybersecurity Market in Australia Revenue (Million) Forecast, by Application 2019 & 2032
- Table 30: Mexico Cybersecurity Market in Australia Volume (K Unit) Forecast, by Application 2019 & 2032
- Table 31: Global Cybersecurity Market in Australia Revenue Million Forecast, by Product Type 2019 & 2032
- Table 32: Global Cybersecurity Market in Australia Volume K Unit Forecast, by Product Type 2019 & 2032
- Table 33: Global Cybersecurity Market in Australia Revenue Million Forecast, by Service 2019 & 2032
- Table 34: Global Cybersecurity Market in Australia Volume K Unit Forecast, by Service 2019 & 2032
- Table 35: Global Cybersecurity Market in Australia Revenue Million Forecast, by Deployment 2019 & 2032
- Table 36: Global Cybersecurity Market in Australia Volume K Unit Forecast, by Deployment 2019 & 2032
- Table 37: Global Cybersecurity Market in Australia Revenue Million Forecast, by End-User Industry 2019 & 2032
- Table 38: Global Cybersecurity Market in Australia Volume K Unit Forecast, by End-User Industry 2019 & 2032
- Table 39: Global Cybersecurity Market in Australia Revenue Million Forecast, by Country 2019 & 2032
- Table 40: Global Cybersecurity Market in Australia Volume K Unit Forecast, by Country 2019 & 2032
- Table 41: Brazil Cybersecurity Market in Australia Revenue (Million) Forecast, by Application 2019 & 2032
- Table 42: Brazil Cybersecurity Market in Australia Volume (K Unit) Forecast, by Application 2019 & 2032
- Table 43: Argentina Cybersecurity Market in Australia Revenue (Million) Forecast, by Application 2019 & 2032
- Table 44: Argentina Cybersecurity Market in Australia Volume (K Unit) Forecast, by Application 2019 & 2032
- Table 45: Rest of South America Cybersecurity Market in Australia Revenue (Million) Forecast, by Application 2019 & 2032
- Table 46: Rest of South America Cybersecurity Market in Australia Volume (K Unit) Forecast, by Application 2019 & 2032
- Table 47: Global Cybersecurity Market in Australia Revenue Million Forecast, by Product Type 2019 & 2032
- Table 48: Global Cybersecurity Market in Australia Volume K Unit Forecast, by Product Type 2019 & 2032
- Table 49: Global Cybersecurity Market in Australia Revenue Million Forecast, by Service 2019 & 2032
- Table 50: Global Cybersecurity Market in Australia Volume K Unit Forecast, by Service 2019 & 2032
- Table 51: Global Cybersecurity Market in Australia Revenue Million Forecast, by Deployment 2019 & 2032
- Table 52: Global Cybersecurity Market in Australia Volume K Unit Forecast, by Deployment 2019 & 2032
- Table 53: Global Cybersecurity Market in Australia Revenue Million Forecast, by End-User Industry 2019 & 2032
- Table 54: Global Cybersecurity Market in Australia Volume K Unit Forecast, by End-User Industry 2019 & 2032
- Table 55: Global Cybersecurity Market in Australia Revenue Million Forecast, by Country 2019 & 2032
- Table 56: Global Cybersecurity Market in Australia Volume K Unit Forecast, by Country 2019 & 2032
- Table 57: United Kingdom Cybersecurity Market in Australia Revenue (Million) Forecast, by Application 2019 & 2032
- Table 58: United Kingdom Cybersecurity Market in Australia Volume (K Unit) Forecast, by Application 2019 & 2032
- Table 59: Germany Cybersecurity Market in Australia Revenue (Million) Forecast, by Application 2019 & 2032
- Table 60: Germany Cybersecurity Market in Australia Volume (K Unit) Forecast, by Application 2019 & 2032
- Table 61: France Cybersecurity Market in Australia Revenue (Million) Forecast, by Application 2019 & 2032
- Table 62: France Cybersecurity Market in Australia Volume (K Unit) Forecast, by Application 2019 & 2032
- Table 63: Italy Cybersecurity Market in Australia Revenue (Million) Forecast, by Application 2019 & 2032
- Table 64: Italy Cybersecurity Market in Australia Volume (K Unit) Forecast, by Application 2019 & 2032
- Table 65: Spain Cybersecurity Market in Australia Revenue (Million) Forecast, by Application 2019 & 2032
- Table 66: Spain Cybersecurity Market in Australia Volume (K Unit) Forecast, by Application 2019 & 2032
- Table 67: Russia Cybersecurity Market in Australia Revenue (Million) Forecast, by Application 2019 & 2032
- Table 68: Russia Cybersecurity Market in Australia Volume (K Unit) Forecast, by Application 2019 & 2032
- Table 69: Benelux Cybersecurity Market in Australia Revenue (Million) Forecast, by Application 2019 & 2032
- Table 70: Benelux Cybersecurity Market in Australia Volume (K Unit) Forecast, by Application 2019 & 2032
- Table 71: Nordics Cybersecurity Market in Australia Revenue (Million) Forecast, by Application 2019 & 2032
- Table 72: Nordics Cybersecurity Market in Australia Volume (K Unit) Forecast, by Application 2019 & 2032
- Table 73: Rest of Europe Cybersecurity Market in Australia Revenue (Million) Forecast, by Application 2019 & 2032
- Table 74: Rest of Europe Cybersecurity Market in Australia Volume (K Unit) Forecast, by Application 2019 & 2032
- Table 75: Global Cybersecurity Market in Australia Revenue Million Forecast, by Product Type 2019 & 2032
- Table 76: Global Cybersecurity Market in Australia Volume K Unit Forecast, by Product Type 2019 & 2032
- Table 77: Global Cybersecurity Market in Australia Revenue Million Forecast, by Service 2019 & 2032
- Table 78: Global Cybersecurity Market in Australia Volume K Unit Forecast, by Service 2019 & 2032
- Table 79: Global Cybersecurity Market in Australia Revenue Million Forecast, by Deployment 2019 & 2032
- Table 80: Global Cybersecurity Market in Australia Volume K Unit Forecast, by Deployment 2019 & 2032
- Table 81: Global Cybersecurity Market in Australia Revenue Million Forecast, by End-User Industry 2019 & 2032
- Table 82: Global Cybersecurity Market in Australia Volume K Unit Forecast, by End-User Industry 2019 & 2032
- Table 83: Global Cybersecurity Market in Australia Revenue Million Forecast, by Country 2019 & 2032
- Table 84: Global Cybersecurity Market in Australia Volume K Unit Forecast, by Country 2019 & 2032
- Table 85: Turkey Cybersecurity Market in Australia Revenue (Million) Forecast, by Application 2019 & 2032
- Table 86: Turkey Cybersecurity Market in Australia Volume (K Unit) Forecast, by Application 2019 & 2032
- Table 87: Israel Cybersecurity Market in Australia Revenue (Million) Forecast, by Application 2019 & 2032
- Table 88: Israel Cybersecurity Market in Australia Volume (K Unit) Forecast, by Application 2019 & 2032
- Table 89: GCC Cybersecurity Market in Australia Revenue (Million) Forecast, by Application 2019 & 2032
- Table 90: GCC Cybersecurity Market in Australia Volume (K Unit) Forecast, by Application 2019 & 2032
- Table 91: North Africa Cybersecurity Market in Australia Revenue (Million) Forecast, by Application 2019 & 2032
- Table 92: North Africa Cybersecurity Market in Australia Volume (K Unit) Forecast, by Application 2019 & 2032
- Table 93: South Africa Cybersecurity Market in Australia Revenue (Million) Forecast, by Application 2019 & 2032
- Table 94: South Africa Cybersecurity Market in Australia Volume (K Unit) Forecast, by Application 2019 & 2032
- Table 95: Rest of Middle East & Africa Cybersecurity Market in Australia Revenue (Million) Forecast, by Application 2019 & 2032
- Table 96: Rest of Middle East & Africa Cybersecurity Market in Australia Volume (K Unit) Forecast, by Application 2019 & 2032
- Table 97: Global Cybersecurity Market in Australia Revenue Million Forecast, by Product Type 2019 & 2032
- Table 98: Global Cybersecurity Market in Australia Volume K Unit Forecast, by Product Type 2019 & 2032
- Table 99: Global Cybersecurity Market in Australia Revenue Million Forecast, by Service 2019 & 2032
- Table 100: Global Cybersecurity Market in Australia Volume K Unit Forecast, by Service 2019 & 2032
- Table 101: Global Cybersecurity Market in Australia Revenue Million Forecast, by Deployment 2019 & 2032
- Table 102: Global Cybersecurity Market in Australia Volume K Unit Forecast, by Deployment 2019 & 2032
- Table 103: Global Cybersecurity Market in Australia Revenue Million Forecast, by End-User Industry 2019 & 2032
- Table 104: Global Cybersecurity Market in Australia Volume K Unit Forecast, by End-User Industry 2019 & 2032
- Table 105: Global Cybersecurity Market in Australia Revenue Million Forecast, by Country 2019 & 2032
- Table 106: Global Cybersecurity Market in Australia Volume K Unit Forecast, by Country 2019 & 2032
- Table 107: China Cybersecurity Market in Australia Revenue (Million) Forecast, by Application 2019 & 2032
- Table 108: China Cybersecurity Market in Australia Volume (K Unit) Forecast, by Application 2019 & 2032
- Table 109: India Cybersecurity Market in Australia Revenue (Million) Forecast, by Application 2019 & 2032
- Table 110: India Cybersecurity Market in Australia Volume (K Unit) Forecast, by Application 2019 & 2032
- Table 111: Japan Cybersecurity Market in Australia Revenue (Million) Forecast, by Application 2019 & 2032
- Table 112: Japan Cybersecurity Market in Australia Volume (K Unit) Forecast, by Application 2019 & 2032
- Table 113: South Korea Cybersecurity Market in Australia Revenue (Million) Forecast, by Application 2019 & 2032
- Table 114: South Korea Cybersecurity Market in Australia Volume (K Unit) Forecast, by Application 2019 & 2032
- Table 115: ASEAN Cybersecurity Market in Australia Revenue (Million) Forecast, by Application 2019 & 2032
- Table 116: ASEAN Cybersecurity Market in Australia Volume (K Unit) Forecast, by Application 2019 & 2032
- Table 117: Oceania Cybersecurity Market in Australia Revenue (Million) Forecast, by Application 2019 & 2032
- Table 118: Oceania Cybersecurity Market in Australia Volume (K Unit) Forecast, by Application 2019 & 2032
- Table 119: Rest of Asia Pacific Cybersecurity Market in Australia Revenue (Million) Forecast, by Application 2019 & 2032
- Table 120: Rest of Asia Pacific Cybersecurity Market in Australia Volume (K Unit) Forecast, by Application 2019 & 2032
Frequently Asked Questions
1. What is the projected Compound Annual Growth Rate (CAGR) of the Cybersecurity Market in Australia?
The projected CAGR is approximately 18.44%.
2. Which companies are prominent players in the Cybersecurity Market in Australia?
Key companies in the market include FireEye Inc, IBM Corporation, Fortinet Inc, Cisco Systems Inc, AVG Technologies, Cyber Ark Software Ltd, Dell Technologies Inc, Check Point Software Technologies Ltd?, Imperva Inc .
3. What are the main segments of the Cybersecurity Market in Australia?
The market segments include Product Type, Service, Deployment, End-User Industry.
4. Can you provide details about the market size?
The market size is estimated to be USD 7.09 Million as of 2022.
5. What are some drivers contributing to market growth?
Rapidly Increasing Cybersecurity Incidents and Regulations Requiring their Reporting; Growing M2M/IoT Connections Demanding Strengthened Cybersecurity in Enterprises.
6. What are the notable trends driving market growth?
Data Security to Show Significant Growth.
7. Are there any restraints impacting market growth?
Lack of 3D Content Development; Cost-Intensive 3D Displays.
8. Can you provide examples of recent developments in the market?
February 2022 : Australian Cyber Security Centre (ACSC), the Cybersecurity and Infrastructure Security Agency (CISA), along with the Federal Bureau of Investigation (FBI), National Security Agency (NSA), among others, issued a joint Cybersecurity Advisory outlining the growing international threat posed by ransomware over the past year.
9. What pricing options are available for accessing the report?
Pricing options include single-user, multi-user, and enterprise licenses priced at USD 3800, USD 4500, and USD 5800 respectively.
10. Is the market size provided in terms of value or volume?
The market size is provided in terms of value, measured in Million and volume, measured in K Unit.
11. Are there any specific market keywords associated with the report?
Yes, the market keyword associated with the report is "Cybersecurity Market in Australia," which aids in identifying and referencing the specific market segment covered.
12. How do I determine which pricing option suits my needs best?
The pricing options vary based on user requirements and access needs. Individual users may opt for single-user licenses, while businesses requiring broader access may choose multi-user or enterprise licenses for cost-effective access to the report.
13. Are there any additional resources or data provided in the Cybersecurity Market in Australia report?
While the report offers comprehensive insights, it's advisable to review the specific contents or supplementary materials provided to ascertain if additional resources or data are available.
14. How can I stay updated on further developments or reports in the Cybersecurity Market in Australia?
To stay informed about further developments, trends, and reports in the Cybersecurity Market in Australia, consider subscribing to industry newsletters, following relevant companies and organizations, or regularly checking reputable industry news sources and publications.
Methodology
Step 1 - Identification of Relevant Samples Size from Population Database


Step 2 - Approaches for Defining Global Market Size (Value, Volume* & Price*)

Note*: In applicable scenarios
Step 3 - Data Sources
Primary Research
- Web Analytics
- Survey Reports
- Research Institute
- Latest Research Reports
- Opinion Leaders
Secondary Research
- Annual Reports
- White Paper
- Latest Press Release
- Industry Association
- Paid Database
- Investor Presentations

Step 4 - Data Triangulation
Involves using different sources of information in order to increase the validity of a study
These sources are likely to be stakeholders in a program - participants, other researchers, program staff, other community members, and so on.
Then we put all data in single framework & apply various statistical tools to find out the dynamic on the market.
During the analysis stage, feedback from the stakeholder groups would be compared to determine areas of agreement as well as areas of divergence


