
Key Insights
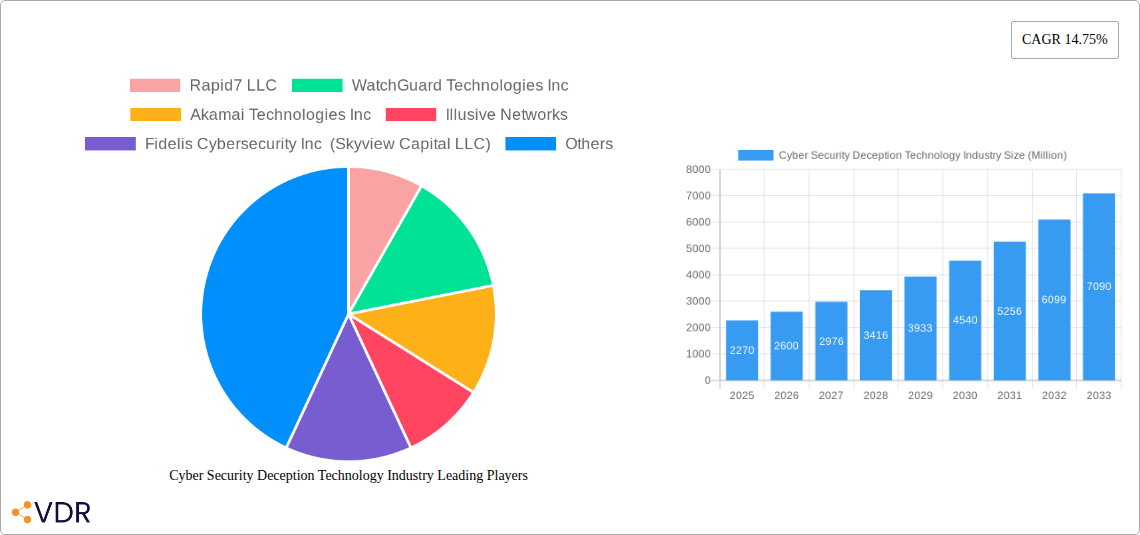
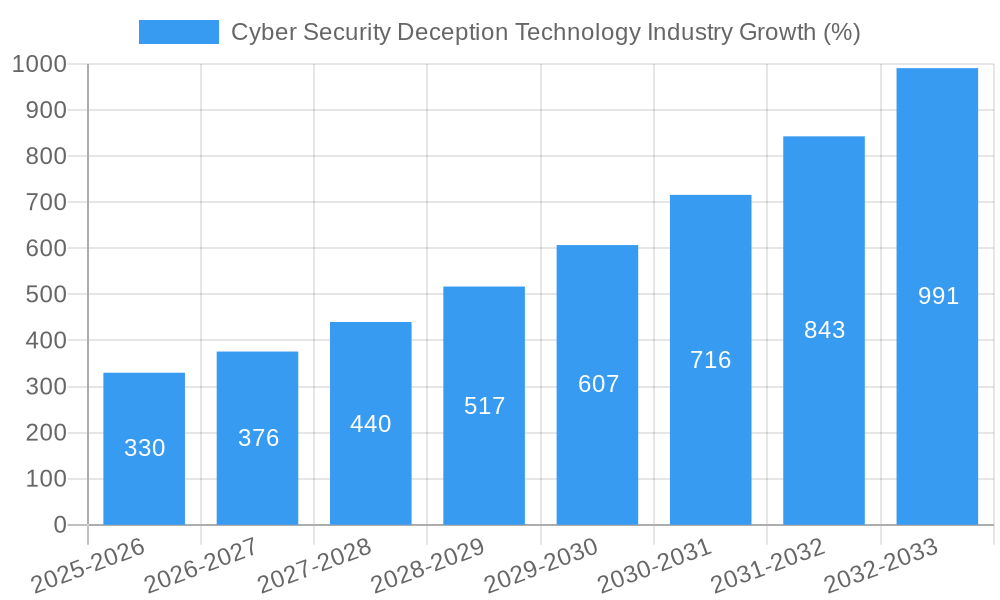
The cybersecurity deception technology market, valued at $2.27 billion in 2025, is experiencing robust growth, projected to expand at a Compound Annual Growth Rate (CAGR) of 14.75% from 2025 to 2033. This surge is driven by the escalating sophistication of cyberattacks, increasing reliance on cloud and hybrid infrastructures, and stringent regulatory compliance mandates across sectors like BFSI, government, and healthcare. The market's segmentation reveals significant opportunities across various service types, including managed and professional services, catering to diverse organizational sizes (SMEs and large enterprises). Endpoint, network, application, and data security remain key focus areas, highlighting the multi-layered approach needed to effectively combat evolving threats. The adoption of cloud-based deception technologies is a key trend, offering scalability and enhanced threat detection capabilities. Geographic distribution indicates strong market presence in North America and Europe, but rapid growth is anticipated in the Asia-Pacific region driven by increasing digitalization and investment in cybersecurity infrastructure. While the market faces restraints like high implementation costs and the need for specialized expertise, the expanding attack surface and the demonstrated effectiveness of deception technologies in detecting advanced threats are overcoming these barriers, ensuring continued market expansion.
The competitive landscape is characterized by a mix of established players like Rapid7, WatchGuard, and Akamai, along with emerging innovative companies specializing in deception technology. These companies are constantly innovating to enhance the effectiveness of their offerings, integrating artificial intelligence and machine learning to improve threat detection and response capabilities. The increasing adoption of deception technology across various industries suggests a bright future for this market segment, driven by the growing need for proactive and sophisticated security measures to counteract the ever-evolving landscape of cyber threats. Future growth will likely be fueled by the development of more integrated and automated solutions, as well as a greater focus on providing comprehensive threat intelligence and incident response capabilities.
Cyber Security Deception Technology Industry Market Report: 2019-2033
This comprehensive report provides an in-depth analysis of the Cyber Security Deception Technology industry, encompassing market dynamics, growth trends, competitive landscape, and future outlook. The study period covers 2019-2033, with 2025 as the base and estimated year. The forecast period spans 2025-2033, and the historical period encompasses 2019-2024. This report is invaluable for industry professionals, investors, and strategists seeking to navigate this rapidly evolving sector. The market is segmented by organization size (SMEs and large enterprises), service (managed and professional services), deception stack (data, application, endpoint, and network security), end-user (government, medical, BFSI, defense, IT & telecommunication, and others), and deployment (cloud and on-premise). Key players analyzed include Rapid7 LLC, WatchGuard Technologies Inc, Akamai Technologies Inc, Illusive Networks, and others. The total market size is predicted to reach xx Million by 2033.
Cyber Security Deception Technology Industry Market Dynamics & Structure
The Cyber Security Deception Technology market exhibits a moderately consolidated structure, with several key players holding significant market share. Technological innovation, particularly in AI and machine learning, is a primary growth driver. Stringent regulatory frameworks like GDPR and CCPA influence adoption, while competitive pressures from alternative security solutions exist. Mergers and acquisitions (M&A) activity is significant, reflecting industry consolidation and the pursuit of advanced capabilities. The market is driven by increasing cyber threats and the need for advanced security solutions.
- Market Concentration: The top 5 players hold an estimated xx% market share in 2025.
- Technological Innovation: AI/ML integration is crucial, enhancing deception effectiveness and automation.
- Regulatory Landscape: Compliance requirements drive adoption, particularly in regulated sectors.
- Competitive Substitutes: Traditional security solutions pose competition, but deception technology offers unique advantages.
- M&A Activity: Significant M&A activity is observed, with xx deals recorded between 2019-2024. This trend is expected to continue.
- End-User Demographics: Large enterprises are the primary adopters, driven by their complex IT infrastructure and heightened risk exposure.
Cyber Security Deception Technology Industry Growth Trends & Insights
The Cyber Security Deception Technology market demonstrates robust growth, with a projected Compound Annual Growth Rate (CAGR) of xx% during the forecast period (2025-2033). Market penetration is increasing across various segments, driven by heightened cyber threats, rising awareness of deception technology's effectiveness, and the growing adoption of cloud computing. Technological disruptions, such as the increasing sophistication of cyberattacks, are driving demand for advanced deception solutions. Consumer behavior shifts towards proactive security measures are further fueling market expansion. Market size is estimated at xx Million in 2025 and is projected to reach xx Million by 2033. Adoption rates are highest in the BFSI and government sectors, driven by stringent regulatory compliance and high-value assets.
Dominant Regions, Countries, or Segments in Cyber Security Deception Technology Industry
North America currently holds the largest market share, driven by high technological advancements, strong cybersecurity awareness, and the presence of major players. However, the Asia-Pacific region is expected to witness the fastest growth due to increasing digitalization and rising government investments in cybersecurity infrastructure. Large enterprises dominate the market owing to their higher budgets and sophisticated IT systems. Managed services are the leading service segment, providing ease of adoption and cost-effectiveness. Network security forms a major component of the deception stack due to its crucial role in preventing initial intrusion. The government and BFSI sectors are leading end-users due to strict regulatory compliance and high-value data assets. Cloud deployment is increasingly popular, aligning with the trend of cloud adoption.
- Key Drivers: Government initiatives, robust IT infrastructure, and high cyber threat levels.
- North America: Largest market share, driven by established players and advanced technology.
- Asia-Pacific: Fastest-growing region, fueled by digital transformation and government investments.
- Large Enterprises: Highest adoption rate due to complex IT infrastructure and budget.
- Managed Services: Leading service segment, offering cost-effectiveness and ease of implementation.
- Network Security: Largest segment within the deception stack, focusing on perimeter protection.
- Government & BFSI: Largest end-user segments, driven by regulatory compliance and sensitive data.
- Cloud Deployment: Rapid growth, driven by cloud computing adoption and scalability benefits.
Cyber Security Deception Technology Industry Product Landscape
The Cyber Security Deception Technology market features a diverse range of products, including decoy systems, honeypots, and deceptive user interfaces. These solutions are designed to lure attackers, gather intelligence, and enhance overall security posture. Key innovations include AI-powered deception platforms offering automation and improved detection capabilities. Performance is measured by metrics like detection rates, response times, and the amount of threat intelligence gathered. Unique selling propositions often emphasize automated threat detection, proactive defense strategies, and reduced reliance on reactive security measures.
Key Drivers, Barriers & Challenges in Cyber Security Deception Technology Industry
Key Drivers:
- Increasing sophistication and frequency of cyberattacks.
- Growing adoption of cloud computing and the associated security risks.
- Stringent data privacy regulations driving the need for robust security solutions.
Challenges & Restraints:
- High initial investment costs for implementing deception technology solutions.
- Complexity of integration with existing security infrastructure.
- Skilled workforce shortage for managing and interpreting deception data.
- Difficulty in measuring ROI and demonstrating effectiveness. Estimated cost of this impact on the market is xx Million annually.
Emerging Opportunities in Cyber Security Deception Technology Industry
- Expanding into untapped markets, such as small and medium-sized enterprises (SMEs).
- Development of specialized deception technologies for IoT and industrial control systems.
- Integration of deception technology with other security solutions to create comprehensive security platforms.
- Increased focus on threat intelligence gathering and analysis through deception techniques.
Growth Accelerators in the Cyber Security Deception Technology Industry
Technological breakthroughs in AI and machine learning are fueling the development of more sophisticated and effective deception technologies. Strategic partnerships between deception technology providers and other cybersecurity firms are expanding market reach and creating integrated solutions. Market expansion strategies, such as targeting new geographic regions and vertical industries, are driving growth. The increasing awareness of cybersecurity risks among organizations is also a significant growth driver.
Key Players Shaping the Cyber Security Deception Technology Market
- Rapid7 LLC
- WatchGuard Technologies Inc
- Akamai Technologies Inc
- Illusive Networks
- Fidelis Cybersecurity Inc (Skyview Capital LLC)
- Broadcom Inc (Symantec Corporation)
- Ridgeback Network Defense Inc
- Smokescreen Technologies Pvt Ltd
- LogRhythm Inc
- Attivo Networks Inc (Sentinelone Inc)
- NTT Security Limited (Nippon Telegraph and Telephone Corporation)
- Acalvio Technologies Inc
- CyberTrap Software GmbH
- CounterCraft SL
- Commvault Systems Inc
Notable Milestones in Cyber Security Deception Technology Industry Sector
- March 2023: Rapid7 announced the acquisition of Minerva Labs Ltd., expanding its anti-evasion and ransomware prevention capabilities.
- March 2023: Akamai Technologies announced an agreement to acquire Ondat, strengthening its cloud-based storage and Kubernetes-native platform offerings.
- March 2023: Acalvio Technologies partnered with Carahsoft Technology Corp., gaining access to the public sector market through Carahsoft's Master Government Aggregator status.
In-Depth Cyber Security Deception Technology Industry Market Outlook
The Cyber Security Deception Technology market is poised for significant growth, driven by the escalating sophistication of cyber threats, increasing digital transformation, and rising awareness of the need for proactive security solutions. The integration of AI/ML, strategic partnerships, and expansion into new markets will create substantial opportunities for industry players. The market's future potential is significant, offering lucrative prospects for those who can innovate and adapt to the evolving landscape.
Cyber Security Deception Technology Industry Segmentation
-
1. Deployment
- 1.1. Cloud
- 1.2. On-premise
-
2. Organization Size
- 2.1. Small and Medium Enterprises
- 2.2. Large Enterprises
-
3. Service
- 3.1. Managed Services
- 3.2. Professional Services
-
4. Deception Stack
- 4.1. Data Security
- 4.2. Application Security
- 4.3. Endpoint Security
- 4.4. Network Security
-
5. End-User
- 5.1. Government
- 5.2. Medical
- 5.3. BFSI
- 5.4. Defense
- 5.5. IT and Telecommunication
- 5.6. Other End-Users
Cyber Security Deception Technology Industry Segmentation By Geography
- 1. North America
- 2. Europe
- 3. Asia Pacific
- 4. Latin America
- 5. Middle East and Africa
Cyber Security Deception Technology Industry REPORT HIGHLIGHTS
| Aspects | Details |
|---|---|
| Study Period | 2019-2033 |
| Base Year | 2024 |
| Estimated Year | 2025 |
| Forecast Period | 2025-2033 |
| Historical Period | 2019-2024 |
| Growth Rate | CAGR of 14.75% from 2019-2033 |
| Segmentation |
|
Table of Contents
- 1. Introduction
- 1.1. Research Scope
- 1.2. Market Segmentation
- 1.3. Research Methodology
- 1.4. Definitions and Assumptions
- 2. Executive Summary
- 2.1. Introduction
- 3. Market Dynamics
- 3.1. Introduction
- 3.2. Market Drivers
- 3.2.1. Growing Number of Zero-day and Targeted APT's; Need of Effective Solutions for Early Detection of Attackers
- 3.3. Market Restrains
- 3.3.1. High Usage of Legacy Honeypots
- 3.4. Market Trends
- 3.4.1. Network Security is expected to grow at a higher pace
- 4. Market Factor Analysis
- 4.1. Porters Five Forces
- 4.2. Supply/Value Chain
- 4.3. PESTEL analysis
- 4.4. Market Entropy
- 4.5. Patent/Trademark Analysis
- 5. Global Cyber Security Deception Technology Industry Analysis, Insights and Forecast, 2019-2031
- 5.1. Market Analysis, Insights and Forecast - by Deployment
- 5.1.1. Cloud
- 5.1.2. On-premise
- 5.2. Market Analysis, Insights and Forecast - by Organization Size
- 5.2.1. Small and Medium Enterprises
- 5.2.2. Large Enterprises
- 5.3. Market Analysis, Insights and Forecast - by Service
- 5.3.1. Managed Services
- 5.3.2. Professional Services
- 5.4. Market Analysis, Insights and Forecast - by Deception Stack
- 5.4.1. Data Security
- 5.4.2. Application Security
- 5.4.3. Endpoint Security
- 5.4.4. Network Security
- 5.5. Market Analysis, Insights and Forecast - by End-User
- 5.5.1. Government
- 5.5.2. Medical
- 5.5.3. BFSI
- 5.5.4. Defense
- 5.5.5. IT and Telecommunication
- 5.5.6. Other End-Users
- 5.6. Market Analysis, Insights and Forecast - by Region
- 5.6.1. North America
- 5.6.2. Europe
- 5.6.3. Asia Pacific
- 5.6.4. Latin America
- 5.6.5. Middle East and Africa
- 5.1. Market Analysis, Insights and Forecast - by Deployment
- 6. North America Cyber Security Deception Technology Industry Analysis, Insights and Forecast, 2019-2031
- 6.1. Market Analysis, Insights and Forecast - by Deployment
- 6.1.1. Cloud
- 6.1.2. On-premise
- 6.2. Market Analysis, Insights and Forecast - by Organization Size
- 6.2.1. Small and Medium Enterprises
- 6.2.2. Large Enterprises
- 6.3. Market Analysis, Insights and Forecast - by Service
- 6.3.1. Managed Services
- 6.3.2. Professional Services
- 6.4. Market Analysis, Insights and Forecast - by Deception Stack
- 6.4.1. Data Security
- 6.4.2. Application Security
- 6.4.3. Endpoint Security
- 6.4.4. Network Security
- 6.5. Market Analysis, Insights and Forecast - by End-User
- 6.5.1. Government
- 6.5.2. Medical
- 6.5.3. BFSI
- 6.5.4. Defense
- 6.5.5. IT and Telecommunication
- 6.5.6. Other End-Users
- 6.1. Market Analysis, Insights and Forecast - by Deployment
- 7. Europe Cyber Security Deception Technology Industry Analysis, Insights and Forecast, 2019-2031
- 7.1. Market Analysis, Insights and Forecast - by Deployment
- 7.1.1. Cloud
- 7.1.2. On-premise
- 7.2. Market Analysis, Insights and Forecast - by Organization Size
- 7.2.1. Small and Medium Enterprises
- 7.2.2. Large Enterprises
- 7.3. Market Analysis, Insights and Forecast - by Service
- 7.3.1. Managed Services
- 7.3.2. Professional Services
- 7.4. Market Analysis, Insights and Forecast - by Deception Stack
- 7.4.1. Data Security
- 7.4.2. Application Security
- 7.4.3. Endpoint Security
- 7.4.4. Network Security
- 7.5. Market Analysis, Insights and Forecast - by End-User
- 7.5.1. Government
- 7.5.2. Medical
- 7.5.3. BFSI
- 7.5.4. Defense
- 7.5.5. IT and Telecommunication
- 7.5.6. Other End-Users
- 7.1. Market Analysis, Insights and Forecast - by Deployment
- 8. Asia Pacific Cyber Security Deception Technology Industry Analysis, Insights and Forecast, 2019-2031
- 8.1. Market Analysis, Insights and Forecast - by Deployment
- 8.1.1. Cloud
- 8.1.2. On-premise
- 8.2. Market Analysis, Insights and Forecast - by Organization Size
- 8.2.1. Small and Medium Enterprises
- 8.2.2. Large Enterprises
- 8.3. Market Analysis, Insights and Forecast - by Service
- 8.3.1. Managed Services
- 8.3.2. Professional Services
- 8.4. Market Analysis, Insights and Forecast - by Deception Stack
- 8.4.1. Data Security
- 8.4.2. Application Security
- 8.4.3. Endpoint Security
- 8.4.4. Network Security
- 8.5. Market Analysis, Insights and Forecast - by End-User
- 8.5.1. Government
- 8.5.2. Medical
- 8.5.3. BFSI
- 8.5.4. Defense
- 8.5.5. IT and Telecommunication
- 8.5.6. Other End-Users
- 8.1. Market Analysis, Insights and Forecast - by Deployment
- 9. Latin America Cyber Security Deception Technology Industry Analysis, Insights and Forecast, 2019-2031
- 9.1. Market Analysis, Insights and Forecast - by Deployment
- 9.1.1. Cloud
- 9.1.2. On-premise
- 9.2. Market Analysis, Insights and Forecast - by Organization Size
- 9.2.1. Small and Medium Enterprises
- 9.2.2. Large Enterprises
- 9.3. Market Analysis, Insights and Forecast - by Service
- 9.3.1. Managed Services
- 9.3.2. Professional Services
- 9.4. Market Analysis, Insights and Forecast - by Deception Stack
- 9.4.1. Data Security
- 9.4.2. Application Security
- 9.4.3. Endpoint Security
- 9.4.4. Network Security
- 9.5. Market Analysis, Insights and Forecast - by End-User
- 9.5.1. Government
- 9.5.2. Medical
- 9.5.3. BFSI
- 9.5.4. Defense
- 9.5.5. IT and Telecommunication
- 9.5.6. Other End-Users
- 9.1. Market Analysis, Insights and Forecast - by Deployment
- 10. Middle East and Africa Cyber Security Deception Technology Industry Analysis, Insights and Forecast, 2019-2031
- 10.1. Market Analysis, Insights and Forecast - by Deployment
- 10.1.1. Cloud
- 10.1.2. On-premise
- 10.2. Market Analysis, Insights and Forecast - by Organization Size
- 10.2.1. Small and Medium Enterprises
- 10.2.2. Large Enterprises
- 10.3. Market Analysis, Insights and Forecast - by Service
- 10.3.1. Managed Services
- 10.3.2. Professional Services
- 10.4. Market Analysis, Insights and Forecast - by Deception Stack
- 10.4.1. Data Security
- 10.4.2. Application Security
- 10.4.3. Endpoint Security
- 10.4.4. Network Security
- 10.5. Market Analysis, Insights and Forecast - by End-User
- 10.5.1. Government
- 10.5.2. Medical
- 10.5.3. BFSI
- 10.5.4. Defense
- 10.5.5. IT and Telecommunication
- 10.5.6. Other End-Users
- 10.1. Market Analysis, Insights and Forecast - by Deployment
- 11. North America Cyber Security Deception Technology Industry Analysis, Insights and Forecast, 2019-2031
- 11.1. Market Analysis, Insights and Forecast - By Country/Sub-region
- 11.1.1.
- 12. Europe Cyber Security Deception Technology Industry Analysis, Insights and Forecast, 2019-2031
- 12.1. Market Analysis, Insights and Forecast - By Country/Sub-region
- 12.1.1.
- 13. Asia Pacific Cyber Security Deception Technology Industry Analysis, Insights and Forecast, 2019-2031
- 13.1. Market Analysis, Insights and Forecast - By Country/Sub-region
- 13.1.1.
- 14. Latin America Cyber Security Deception Technology Industry Analysis, Insights and Forecast, 2019-2031
- 14.1. Market Analysis, Insights and Forecast - By Country/Sub-region
- 14.1.1.
- 15. Middle East and Africa Cyber Security Deception Technology Industry Analysis, Insights and Forecast, 2019-2031
- 15.1. Market Analysis, Insights and Forecast - By Country/Sub-region
- 15.1.1.
- 16. Competitive Analysis
- 16.1. Global Market Share Analysis 2024
- 16.2. Company Profiles
- 16.2.1 Rapid7 LLC
- 16.2.1.1. Overview
- 16.2.1.2. Products
- 16.2.1.3. SWOT Analysis
- 16.2.1.4. Recent Developments
- 16.2.1.5. Financials (Based on Availability)
- 16.2.2 WatchGuard Technologies Inc
- 16.2.2.1. Overview
- 16.2.2.2. Products
- 16.2.2.3. SWOT Analysis
- 16.2.2.4. Recent Developments
- 16.2.2.5. Financials (Based on Availability)
- 16.2.3 Akamai Technologies Inc
- 16.2.3.1. Overview
- 16.2.3.2. Products
- 16.2.3.3. SWOT Analysis
- 16.2.3.4. Recent Developments
- 16.2.3.5. Financials (Based on Availability)
- 16.2.4 Illusive Networks
- 16.2.4.1. Overview
- 16.2.4.2. Products
- 16.2.4.3. SWOT Analysis
- 16.2.4.4. Recent Developments
- 16.2.4.5. Financials (Based on Availability)
- 16.2.5 Fidelis Cybersecurity Inc (Skyview Capital LLC)
- 16.2.5.1. Overview
- 16.2.5.2. Products
- 16.2.5.3. SWOT Analysis
- 16.2.5.4. Recent Developments
- 16.2.5.5. Financials (Based on Availability)
- 16.2.6 Broadcom Inc (Symantec Corporation
- 16.2.6.1. Overview
- 16.2.6.2. Products
- 16.2.6.3. SWOT Analysis
- 16.2.6.4. Recent Developments
- 16.2.6.5. Financials (Based on Availability)
- 16.2.7 Ridgeback Network Defense Inc
- 16.2.7.1. Overview
- 16.2.7.2. Products
- 16.2.7.3. SWOT Analysis
- 16.2.7.4. Recent Developments
- 16.2.7.5. Financials (Based on Availability)
- 16.2.8 Smokescreen Technologies Pvt Ltd
- 16.2.8.1. Overview
- 16.2.8.2. Products
- 16.2.8.3. SWOT Analysis
- 16.2.8.4. Recent Developments
- 16.2.8.5. Financials (Based on Availability)
- 16.2.9 LogRhythm Inc
- 16.2.9.1. Overview
- 16.2.9.2. Products
- 16.2.9.3. SWOT Analysis
- 16.2.9.4. Recent Developments
- 16.2.9.5. Financials (Based on Availability)
- 16.2.10 Attivo Networks Inc (Sentinelone Inc )
- 16.2.10.1. Overview
- 16.2.10.2. Products
- 16.2.10.3. SWOT Analysis
- 16.2.10.4. Recent Developments
- 16.2.10.5. Financials (Based on Availability)
- 16.2.11 NTT Security Limited (Nippon Telegraph and Telephone Corporation)
- 16.2.11.1. Overview
- 16.2.11.2. Products
- 16.2.11.3. SWOT Analysis
- 16.2.11.4. Recent Developments
- 16.2.11.5. Financials (Based on Availability)
- 16.2.12 Acalvio Technologies Inc
- 16.2.12.1. Overview
- 16.2.12.2. Products
- 16.2.12.3. SWOT Analysis
- 16.2.12.4. Recent Developments
- 16.2.12.5. Financials (Based on Availability)
- 16.2.13 CyberTrap Software GmbH
- 16.2.13.1. Overview
- 16.2.13.2. Products
- 16.2.13.3. SWOT Analysis
- 16.2.13.4. Recent Developments
- 16.2.13.5. Financials (Based on Availability)
- 16.2.14 CounterCraft SL
- 16.2.14.1. Overview
- 16.2.14.2. Products
- 16.2.14.3. SWOT Analysis
- 16.2.14.4. Recent Developments
- 16.2.14.5. Financials (Based on Availability)
- 16.2.15 Commvault Systems Inc
- 16.2.15.1. Overview
- 16.2.15.2. Products
- 16.2.15.3. SWOT Analysis
- 16.2.15.4. Recent Developments
- 16.2.15.5. Financials (Based on Availability)
- 16.2.1 Rapid7 LLC
List of Figures
- Figure 1: Global Cyber Security Deception Technology Industry Revenue Breakdown (Million, %) by Region 2024 & 2032
- Figure 2: North America Cyber Security Deception Technology Industry Revenue (Million), by Country 2024 & 2032
- Figure 3: North America Cyber Security Deception Technology Industry Revenue Share (%), by Country 2024 & 2032
- Figure 4: Europe Cyber Security Deception Technology Industry Revenue (Million), by Country 2024 & 2032
- Figure 5: Europe Cyber Security Deception Technology Industry Revenue Share (%), by Country 2024 & 2032
- Figure 6: Asia Pacific Cyber Security Deception Technology Industry Revenue (Million), by Country 2024 & 2032
- Figure 7: Asia Pacific Cyber Security Deception Technology Industry Revenue Share (%), by Country 2024 & 2032
- Figure 8: Latin America Cyber Security Deception Technology Industry Revenue (Million), by Country 2024 & 2032
- Figure 9: Latin America Cyber Security Deception Technology Industry Revenue Share (%), by Country 2024 & 2032
- Figure 10: Middle East and Africa Cyber Security Deception Technology Industry Revenue (Million), by Country 2024 & 2032
- Figure 11: Middle East and Africa Cyber Security Deception Technology Industry Revenue Share (%), by Country 2024 & 2032
- Figure 12: North America Cyber Security Deception Technology Industry Revenue (Million), by Deployment 2024 & 2032
- Figure 13: North America Cyber Security Deception Technology Industry Revenue Share (%), by Deployment 2024 & 2032
- Figure 14: North America Cyber Security Deception Technology Industry Revenue (Million), by Organization Size 2024 & 2032
- Figure 15: North America Cyber Security Deception Technology Industry Revenue Share (%), by Organization Size 2024 & 2032
- Figure 16: North America Cyber Security Deception Technology Industry Revenue (Million), by Service 2024 & 2032
- Figure 17: North America Cyber Security Deception Technology Industry Revenue Share (%), by Service 2024 & 2032
- Figure 18: North America Cyber Security Deception Technology Industry Revenue (Million), by Deception Stack 2024 & 2032
- Figure 19: North America Cyber Security Deception Technology Industry Revenue Share (%), by Deception Stack 2024 & 2032
- Figure 20: North America Cyber Security Deception Technology Industry Revenue (Million), by End-User 2024 & 2032
- Figure 21: North America Cyber Security Deception Technology Industry Revenue Share (%), by End-User 2024 & 2032
- Figure 22: North America Cyber Security Deception Technology Industry Revenue (Million), by Country 2024 & 2032
- Figure 23: North America Cyber Security Deception Technology Industry Revenue Share (%), by Country 2024 & 2032
- Figure 24: Europe Cyber Security Deception Technology Industry Revenue (Million), by Deployment 2024 & 2032
- Figure 25: Europe Cyber Security Deception Technology Industry Revenue Share (%), by Deployment 2024 & 2032
- Figure 26: Europe Cyber Security Deception Technology Industry Revenue (Million), by Organization Size 2024 & 2032
- Figure 27: Europe Cyber Security Deception Technology Industry Revenue Share (%), by Organization Size 2024 & 2032
- Figure 28: Europe Cyber Security Deception Technology Industry Revenue (Million), by Service 2024 & 2032
- Figure 29: Europe Cyber Security Deception Technology Industry Revenue Share (%), by Service 2024 & 2032
- Figure 30: Europe Cyber Security Deception Technology Industry Revenue (Million), by Deception Stack 2024 & 2032
- Figure 31: Europe Cyber Security Deception Technology Industry Revenue Share (%), by Deception Stack 2024 & 2032
- Figure 32: Europe Cyber Security Deception Technology Industry Revenue (Million), by End-User 2024 & 2032
- Figure 33: Europe Cyber Security Deception Technology Industry Revenue Share (%), by End-User 2024 & 2032
- Figure 34: Europe Cyber Security Deception Technology Industry Revenue (Million), by Country 2024 & 2032
- Figure 35: Europe Cyber Security Deception Technology Industry Revenue Share (%), by Country 2024 & 2032
- Figure 36: Asia Pacific Cyber Security Deception Technology Industry Revenue (Million), by Deployment 2024 & 2032
- Figure 37: Asia Pacific Cyber Security Deception Technology Industry Revenue Share (%), by Deployment 2024 & 2032
- Figure 38: Asia Pacific Cyber Security Deception Technology Industry Revenue (Million), by Organization Size 2024 & 2032
- Figure 39: Asia Pacific Cyber Security Deception Technology Industry Revenue Share (%), by Organization Size 2024 & 2032
- Figure 40: Asia Pacific Cyber Security Deception Technology Industry Revenue (Million), by Service 2024 & 2032
- Figure 41: Asia Pacific Cyber Security Deception Technology Industry Revenue Share (%), by Service 2024 & 2032
- Figure 42: Asia Pacific Cyber Security Deception Technology Industry Revenue (Million), by Deception Stack 2024 & 2032
- Figure 43: Asia Pacific Cyber Security Deception Technology Industry Revenue Share (%), by Deception Stack 2024 & 2032
- Figure 44: Asia Pacific Cyber Security Deception Technology Industry Revenue (Million), by End-User 2024 & 2032
- Figure 45: Asia Pacific Cyber Security Deception Technology Industry Revenue Share (%), by End-User 2024 & 2032
- Figure 46: Asia Pacific Cyber Security Deception Technology Industry Revenue (Million), by Country 2024 & 2032
- Figure 47: Asia Pacific Cyber Security Deception Technology Industry Revenue Share (%), by Country 2024 & 2032
- Figure 48: Latin America Cyber Security Deception Technology Industry Revenue (Million), by Deployment 2024 & 2032
- Figure 49: Latin America Cyber Security Deception Technology Industry Revenue Share (%), by Deployment 2024 & 2032
- Figure 50: Latin America Cyber Security Deception Technology Industry Revenue (Million), by Organization Size 2024 & 2032
- Figure 51: Latin America Cyber Security Deception Technology Industry Revenue Share (%), by Organization Size 2024 & 2032
- Figure 52: Latin America Cyber Security Deception Technology Industry Revenue (Million), by Service 2024 & 2032
- Figure 53: Latin America Cyber Security Deception Technology Industry Revenue Share (%), by Service 2024 & 2032
- Figure 54: Latin America Cyber Security Deception Technology Industry Revenue (Million), by Deception Stack 2024 & 2032
- Figure 55: Latin America Cyber Security Deception Technology Industry Revenue Share (%), by Deception Stack 2024 & 2032
- Figure 56: Latin America Cyber Security Deception Technology Industry Revenue (Million), by End-User 2024 & 2032
- Figure 57: Latin America Cyber Security Deception Technology Industry Revenue Share (%), by End-User 2024 & 2032
- Figure 58: Latin America Cyber Security Deception Technology Industry Revenue (Million), by Country 2024 & 2032
- Figure 59: Latin America Cyber Security Deception Technology Industry Revenue Share (%), by Country 2024 & 2032
- Figure 60: Middle East and Africa Cyber Security Deception Technology Industry Revenue (Million), by Deployment 2024 & 2032
- Figure 61: Middle East and Africa Cyber Security Deception Technology Industry Revenue Share (%), by Deployment 2024 & 2032
- Figure 62: Middle East and Africa Cyber Security Deception Technology Industry Revenue (Million), by Organization Size 2024 & 2032
- Figure 63: Middle East and Africa Cyber Security Deception Technology Industry Revenue Share (%), by Organization Size 2024 & 2032
- Figure 64: Middle East and Africa Cyber Security Deception Technology Industry Revenue (Million), by Service 2024 & 2032
- Figure 65: Middle East and Africa Cyber Security Deception Technology Industry Revenue Share (%), by Service 2024 & 2032
- Figure 66: Middle East and Africa Cyber Security Deception Technology Industry Revenue (Million), by Deception Stack 2024 & 2032
- Figure 67: Middle East and Africa Cyber Security Deception Technology Industry Revenue Share (%), by Deception Stack 2024 & 2032
- Figure 68: Middle East and Africa Cyber Security Deception Technology Industry Revenue (Million), by End-User 2024 & 2032
- Figure 69: Middle East and Africa Cyber Security Deception Technology Industry Revenue Share (%), by End-User 2024 & 2032
- Figure 70: Middle East and Africa Cyber Security Deception Technology Industry Revenue (Million), by Country 2024 & 2032
- Figure 71: Middle East and Africa Cyber Security Deception Technology Industry Revenue Share (%), by Country 2024 & 2032
List of Tables
- Table 1: Global Cyber Security Deception Technology Industry Revenue Million Forecast, by Region 2019 & 2032
- Table 2: Global Cyber Security Deception Technology Industry Revenue Million Forecast, by Deployment 2019 & 2032
- Table 3: Global Cyber Security Deception Technology Industry Revenue Million Forecast, by Organization Size 2019 & 2032
- Table 4: Global Cyber Security Deception Technology Industry Revenue Million Forecast, by Service 2019 & 2032
- Table 5: Global Cyber Security Deception Technology Industry Revenue Million Forecast, by Deception Stack 2019 & 2032
- Table 6: Global Cyber Security Deception Technology Industry Revenue Million Forecast, by End-User 2019 & 2032
- Table 7: Global Cyber Security Deception Technology Industry Revenue Million Forecast, by Region 2019 & 2032
- Table 8: Global Cyber Security Deception Technology Industry Revenue Million Forecast, by Country 2019 & 2032
- Table 9: Cyber Security Deception Technology Industry Revenue (Million) Forecast, by Application 2019 & 2032
- Table 10: Global Cyber Security Deception Technology Industry Revenue Million Forecast, by Country 2019 & 2032
- Table 11: Cyber Security Deception Technology Industry Revenue (Million) Forecast, by Application 2019 & 2032
- Table 12: Global Cyber Security Deception Technology Industry Revenue Million Forecast, by Country 2019 & 2032
- Table 13: Cyber Security Deception Technology Industry Revenue (Million) Forecast, by Application 2019 & 2032
- Table 14: Global Cyber Security Deception Technology Industry Revenue Million Forecast, by Country 2019 & 2032
- Table 15: Cyber Security Deception Technology Industry Revenue (Million) Forecast, by Application 2019 & 2032
- Table 16: Global Cyber Security Deception Technology Industry Revenue Million Forecast, by Country 2019 & 2032
- Table 17: Cyber Security Deception Technology Industry Revenue (Million) Forecast, by Application 2019 & 2032
- Table 18: Global Cyber Security Deception Technology Industry Revenue Million Forecast, by Deployment 2019 & 2032
- Table 19: Global Cyber Security Deception Technology Industry Revenue Million Forecast, by Organization Size 2019 & 2032
- Table 20: Global Cyber Security Deception Technology Industry Revenue Million Forecast, by Service 2019 & 2032
- Table 21: Global Cyber Security Deception Technology Industry Revenue Million Forecast, by Deception Stack 2019 & 2032
- Table 22: Global Cyber Security Deception Technology Industry Revenue Million Forecast, by End-User 2019 & 2032
- Table 23: Global Cyber Security Deception Technology Industry Revenue Million Forecast, by Country 2019 & 2032
- Table 24: Global Cyber Security Deception Technology Industry Revenue Million Forecast, by Deployment 2019 & 2032
- Table 25: Global Cyber Security Deception Technology Industry Revenue Million Forecast, by Organization Size 2019 & 2032
- Table 26: Global Cyber Security Deception Technology Industry Revenue Million Forecast, by Service 2019 & 2032
- Table 27: Global Cyber Security Deception Technology Industry Revenue Million Forecast, by Deception Stack 2019 & 2032
- Table 28: Global Cyber Security Deception Technology Industry Revenue Million Forecast, by End-User 2019 & 2032
- Table 29: Global Cyber Security Deception Technology Industry Revenue Million Forecast, by Country 2019 & 2032
- Table 30: Global Cyber Security Deception Technology Industry Revenue Million Forecast, by Deployment 2019 & 2032
- Table 31: Global Cyber Security Deception Technology Industry Revenue Million Forecast, by Organization Size 2019 & 2032
- Table 32: Global Cyber Security Deception Technology Industry Revenue Million Forecast, by Service 2019 & 2032
- Table 33: Global Cyber Security Deception Technology Industry Revenue Million Forecast, by Deception Stack 2019 & 2032
- Table 34: Global Cyber Security Deception Technology Industry Revenue Million Forecast, by End-User 2019 & 2032
- Table 35: Global Cyber Security Deception Technology Industry Revenue Million Forecast, by Country 2019 & 2032
- Table 36: Global Cyber Security Deception Technology Industry Revenue Million Forecast, by Deployment 2019 & 2032
- Table 37: Global Cyber Security Deception Technology Industry Revenue Million Forecast, by Organization Size 2019 & 2032
- Table 38: Global Cyber Security Deception Technology Industry Revenue Million Forecast, by Service 2019 & 2032
- Table 39: Global Cyber Security Deception Technology Industry Revenue Million Forecast, by Deception Stack 2019 & 2032
- Table 40: Global Cyber Security Deception Technology Industry Revenue Million Forecast, by End-User 2019 & 2032
- Table 41: Global Cyber Security Deception Technology Industry Revenue Million Forecast, by Country 2019 & 2032
- Table 42: Global Cyber Security Deception Technology Industry Revenue Million Forecast, by Deployment 2019 & 2032
- Table 43: Global Cyber Security Deception Technology Industry Revenue Million Forecast, by Organization Size 2019 & 2032
- Table 44: Global Cyber Security Deception Technology Industry Revenue Million Forecast, by Service 2019 & 2032
- Table 45: Global Cyber Security Deception Technology Industry Revenue Million Forecast, by Deception Stack 2019 & 2032
- Table 46: Global Cyber Security Deception Technology Industry Revenue Million Forecast, by End-User 2019 & 2032
- Table 47: Global Cyber Security Deception Technology Industry Revenue Million Forecast, by Country 2019 & 2032
Frequently Asked Questions
1. What is the projected Compound Annual Growth Rate (CAGR) of the Cyber Security Deception Technology Industry?
The projected CAGR is approximately 14.75%.
2. Which companies are prominent players in the Cyber Security Deception Technology Industry?
Key companies in the market include Rapid7 LLC, WatchGuard Technologies Inc, Akamai Technologies Inc, Illusive Networks, Fidelis Cybersecurity Inc (Skyview Capital LLC), Broadcom Inc (Symantec Corporation, Ridgeback Network Defense Inc, Smokescreen Technologies Pvt Ltd, LogRhythm Inc, Attivo Networks Inc (Sentinelone Inc ), NTT Security Limited (Nippon Telegraph and Telephone Corporation), Acalvio Technologies Inc, CyberTrap Software GmbH, CounterCraft SL, Commvault Systems Inc.
3. What are the main segments of the Cyber Security Deception Technology Industry?
The market segments include Deployment, Organization Size, Service, Deception Stack, End-User.
4. Can you provide details about the market size?
The market size is estimated to be USD 2.27 Million as of 2022.
5. What are some drivers contributing to market growth?
Growing Number of Zero-day and Targeted APT's; Need of Effective Solutions for Early Detection of Attackers.
6. What are the notable trends driving market growth?
Network Security is expected to grow at a higher pace.
7. Are there any restraints impacting market growth?
High Usage of Legacy Honeypots.
8. Can you provide examples of recent developments in the market?
March 2023: Rapid7 announced the acquisition of Minerva Labs Ltd., which is a leading provider of anti-evasion and ransomware prevention technology.
9. What pricing options are available for accessing the report?
Pricing options include single-user, multi-user, and enterprise licenses priced at USD 4750, USD 5250, and USD 8750 respectively.
10. Is the market size provided in terms of value or volume?
The market size is provided in terms of value, measured in Million.
11. Are there any specific market keywords associated with the report?
Yes, the market keyword associated with the report is "Cyber Security Deception Technology Industry," which aids in identifying and referencing the specific market segment covered.
12. How do I determine which pricing option suits my needs best?
The pricing options vary based on user requirements and access needs. Individual users may opt for single-user licenses, while businesses requiring broader access may choose multi-user or enterprise licenses for cost-effective access to the report.
13. Are there any additional resources or data provided in the Cyber Security Deception Technology Industry report?
While the report offers comprehensive insights, it's advisable to review the specific contents or supplementary materials provided to ascertain if additional resources or data are available.
14. How can I stay updated on further developments or reports in the Cyber Security Deception Technology Industry?
To stay informed about further developments, trends, and reports in the Cyber Security Deception Technology Industry, consider subscribing to industry newsletters, following relevant companies and organizations, or regularly checking reputable industry news sources and publications.
Methodology
Step 1 - Identification of Relevant Samples Size from Population Database


Step 2 - Approaches for Defining Global Market Size (Value, Volume* & Price*)

Note*: In applicable scenarios
Step 3 - Data Sources
Primary Research
- Web Analytics
- Survey Reports
- Research Institute
- Latest Research Reports
- Opinion Leaders
Secondary Research
- Annual Reports
- White Paper
- Latest Press Release
- Industry Association
- Paid Database
- Investor Presentations

Step 4 - Data Triangulation
Involves using different sources of information in order to increase the validity of a study
These sources are likely to be stakeholders in a program - participants, other researchers, program staff, other community members, and so on.
Then we put all data in single framework & apply various statistical tools to find out the dynamic on the market.
During the analysis stage, feedback from the stakeholder groups would be compared to determine areas of agreement as well as areas of divergence


