
Key Insights
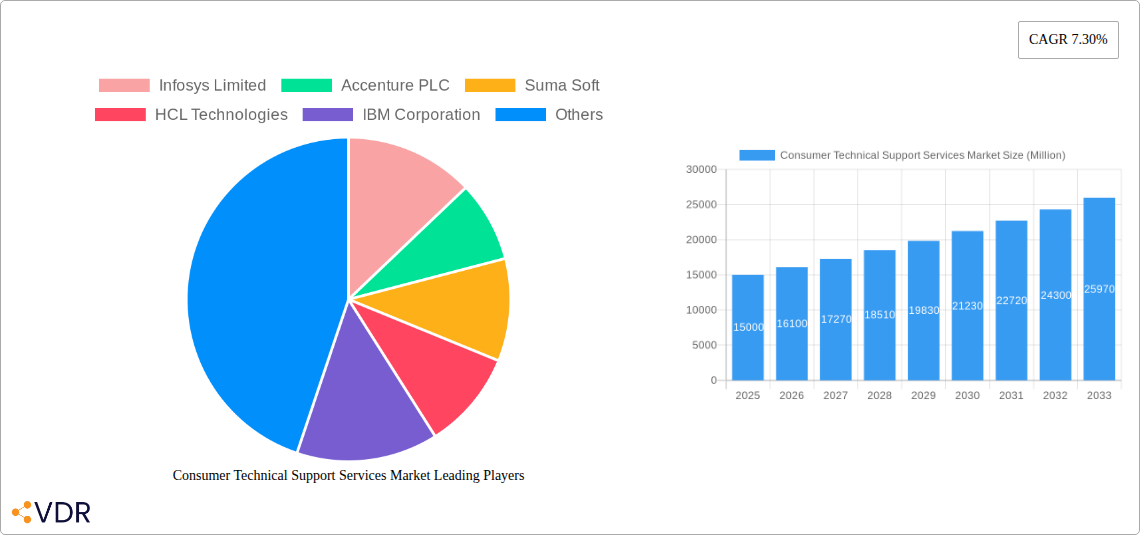
The global Consumer Technical Support Services market is experiencing robust growth, projected to reach a significant value by 2033. A CAGR of 7.30% indicates a consistently expanding market driven by several key factors. The increasing reliance on technology across all sectors – from IT and telecommunications to BFSI, education, and manufacturing – fuels the demand for reliable and efficient consumer technical support. The rise of e-commerce and the proliferation of smart devices further contribute to this growth. Consumers increasingly expect readily available, multi-channel support, demanding seamless integration across various platforms like phone, email, and chat. Market segmentation reveals a strong presence across diverse geographical regions, with North America and Europe currently holding significant market share due to high technology adoption and a mature support infrastructure. However, rapid technological advancements and rising internet penetration in Asia-Pacific and other emerging markets indicate substantial future growth potential in these regions. Competition within the market is fierce, with established players like Infosys, Accenture, and IBM competing alongside specialized service providers. The market's future trajectory is likely influenced by continuous innovation in support technologies, including AI-powered chatbots and remote diagnostics, alongside the evolving consumer expectations for personalized and proactive support.
While market restraints like the need for skilled support personnel and the complexities of integrating various support channels exist, the overall market outlook remains positive. The ongoing digital transformation across industries, coupled with increasing consumer demand for swift and effective technical assistance, suggests that the market will continue its upward trajectory throughout the forecast period. Growth strategies for market participants will likely focus on technological advancements, strategic partnerships, geographical expansion into high-growth regions, and continuous improvement in customer experience to maintain a competitive edge. The expansion into niche markets like hospitality, pharmaceuticals, and logistics will also present significant opportunities for market growth in the coming years. The emphasis on proactive and preventive support, rather than solely reactive measures, will likely become a key differentiator.
Consumer Technical Support Services Market: A Comprehensive Report (2019-2033)
This in-depth report provides a comprehensive analysis of the Consumer Technical Support Services Market, encompassing market dynamics, growth trends, regional segmentation, product landscape, key players, and future outlook. The study period spans from 2019 to 2033, with 2025 serving as the base and estimated year. The report utilizes data from the historical period (2019-2024) and forecasts market trends from 2025 to 2033. The total market size is projected to reach xx Million by 2033.
Consumer Technical Support Services Market Dynamics & Structure
This section delves into the intricate structure of the consumer technical support services market, analyzing its concentration, technological advancements, regulatory influences, competitive dynamics, and end-user demographics. The market is characterized by a moderately consolidated structure with several large players and numerous smaller niche providers. Technological innovations, such as AI-powered chatbots and remote diagnostics, are key drivers of growth, although implementation faces barriers like high initial investment and integration complexities. Regulatory frameworks vary across regions, influencing data privacy, security, and service standards.
- Market Concentration: The top 5 players hold an estimated xx% market share in 2025.
- Technological Innovation: AI, machine learning, and automation are reshaping the landscape, increasing efficiency and reducing costs.
- Regulatory Landscape: GDPR, CCPA, and other data privacy regulations significantly impact service delivery and data handling practices.
- Competitive Substitutes: Self-service portals, online forums, and community-based support present alternative solutions.
- End-User Demographics: Significant growth is expected from the IT & Telecommunication, BFSI, and Ecommerce sectors.
- M&A Activity: The market has witnessed xx M&A deals in the last five years, reflecting consolidation efforts and expansion strategies.
Consumer Technical Support Services Market Growth Trends & Insights
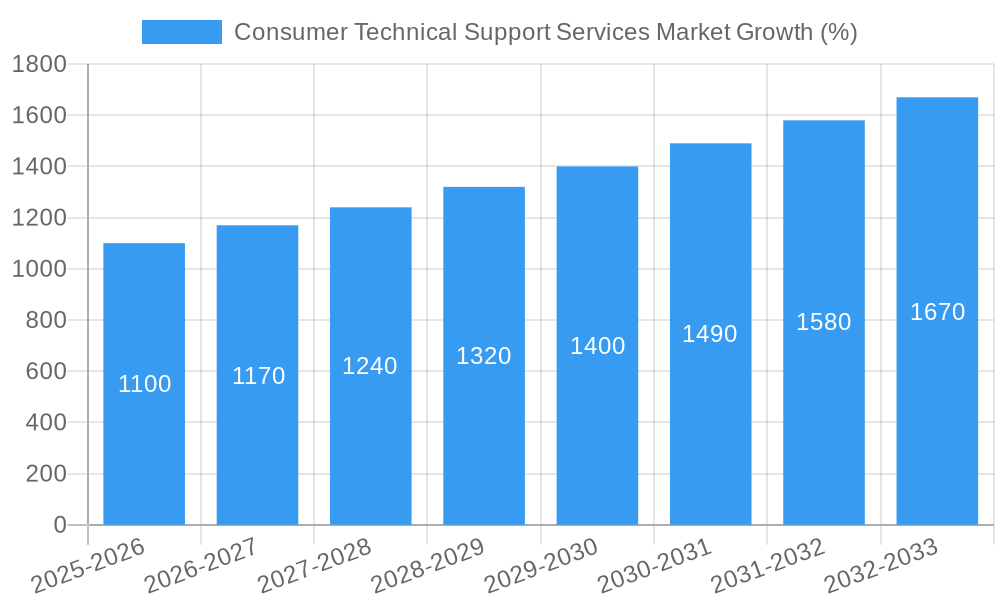
The Consumer Technical Support Services market exhibits robust growth, driven by increasing consumer reliance on technology, the expanding adoption of digital devices and services, and the growing complexity of technological products and services. The market size is projected to experience a CAGR of xx% during the forecast period (2025-2033), propelled by factors such as rising disposable incomes, increased internet penetration, and escalating demand for seamless customer experiences. Technological disruptions, such as the widespread adoption of cloud computing and the Internet of Things (IoT), continue to fuel market expansion. Consumer behavior is shifting towards an expectation of immediate and personalized support, thereby creating opportunities for innovative service delivery models. Market penetration rates vary significantly across regions, with developed economies exhibiting higher saturation levels compared to emerging markets, which present significant untapped potential.
Dominant Regions, Countries, or Segments in Consumer Technical Support Services Market
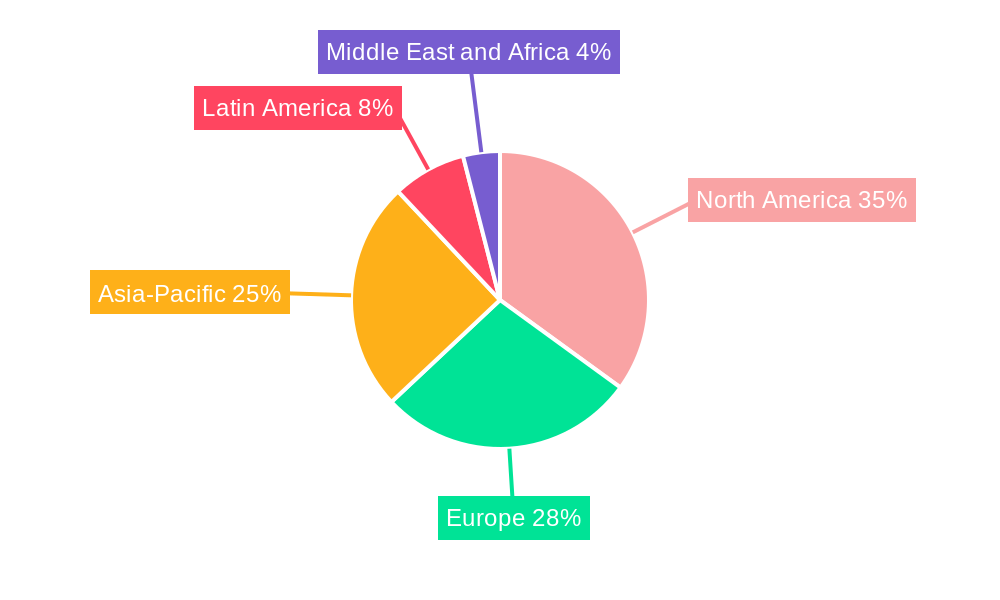
North America currently dominates the Consumer Technical Support Services market, accounting for an estimated xx% market share in 2025, primarily due to high technology adoption rates and a large consumer base. However, the Asia-Pacific region is poised for significant growth, driven by rapid economic expansion, increasing internet penetration, and a burgeoning middle class. Within market segments, IT and Telecommunications and the BFSI sectors are prominent drivers of market demand.
North America: High per capita income, strong technological infrastructure, and a mature market contribute to its dominance.
Asia-Pacific: Rapid economic growth, increasing internet and smartphone penetration, and a large population are key growth drivers.
Europe: Stringent data privacy regulations and a focus on customer experience are shaping market dynamics.
Leading Segments: IT and Telecommunication and BFSI are the largest segments, driven by high dependence on technology and stringent regulatory compliance.
Key Drivers:
- Economic growth in developing regions
- Increasing internet and smartphone penetration
- Growing demand for personalized and efficient customer service
- Expansion of the e-commerce sector
Consumer Technical Support Services Market Product Landscape
The consumer technical support services market offers a range of solutions, from basic help desk assistance to advanced remote diagnostics and AI-powered chatbots. These solutions are tailored to specific end-user needs and technical expertise levels, ranging from simple troubleshooting guides to comprehensive remote assistance services. A key focus is on providing seamless, omnichannel support, integrating various channels like phone, email, chat, and social media. Key technological advancements include AI-driven automation, predictive analytics for proactive support, and augmented reality for remote guidance. The emphasis is on user-friendly interfaces, intuitive navigation, and personalized support experiences that enhance customer satisfaction.
Key Drivers, Barriers & Challenges in Consumer Technical Support Services Market
Key Drivers: Increasing consumer reliance on technology, the rise of e-commerce and digital services, and the growing complexity of technological products fuel market growth. Government initiatives promoting digital literacy also contribute.
Key Challenges: Maintaining high levels of customer satisfaction amidst escalating demands for instant support poses a major challenge. Competition, rising labor costs, and the need for continuous upskilling to keep pace with technological advancements also present significant hurdles. Supply chain disruptions can impact service delivery, while data privacy and security regulations impose significant compliance costs.
Emerging Opportunities in Consumer Technical Support Services Market
Untapped markets in emerging economies and specialized sectors (healthcare, education) represent considerable growth opportunities. The integration of AI and machine learning in support systems promises enhanced efficiency and personalized services. Increased demand for proactive and predictive support offers opportunities to develop innovative solutions that anticipate user issues and provide timely assistance. Developing multi-lingual support capabilities and culturally sensitive service models will be crucial for expanding into global markets.
Growth Accelerators in the Consumer Technical Support Services Market Industry
Technological breakthroughs in AI, machine learning, and automation are driving the market forward, enabling proactive support and personalized customer interactions. Strategic partnerships among technology providers and support service companies promote innovation and expansion. The shift towards cloud-based support platforms enhances scalability and accessibility. Market expansion into underserved regions and the development of specialized support solutions for niche industries will further accelerate growth.
Key Players Shaping the Consumer Technical Support Services Market Market
- Infosys Limited www.infosys.com
- Accenture PLC www.accenture.com
- Suma Soft
- HCL Technologies www.hcltech.com
- IBM Corporation www.ibm.com
- Flatworld Solutions Pvt Ltd
- Qcom Outsourcing Ltd
- Collabera Inc
- Genpact www.genpact.com
- Aegis Plc(Essar)
- Worldwide Call Centers Inc
- Tata Consultancy Services Limited www.tcs.com
- Wipro Limited www.wipro.com
Notable Milestones in Consumer Technical Support Services Market Sector
- November 2022: Infosys BPM and IBM opened an AI and automation center in Poland, signifying a strategic partnership focusing on hybrid cloud solutions.
- September 2022: TCS became the sole strategic IT partner for Zurich Insurance's life insurance operations, demonstrating the growing demand for comprehensive IT support within the BFSI sector.
In-Depth Consumer Technical Support Services Market Market Outlook
The future of the consumer technical support services market is bright, with continued growth driven by technological advancements, evolving consumer expectations, and expansion into new markets. Strategic partnerships, investments in AI and automation, and a focus on personalized and omnichannel support will be crucial for success. The market presents significant opportunities for companies to capitalize on the increasing demand for seamless and efficient technical assistance in an increasingly technology-driven world.
Consumer Technical Support Services Market Segmentation
-
1. Type
- 1.1. Help Desk
- 1.2. Call Centre
-
2. End-User
- 2.1. IT and Telecommunication
- 2.2. BFSI
- 2.3. Education
- 2.4. Manufacturing
- 2.5. Automotive
- 2.6. Other
Consumer Technical Support Services Market Segmentation By Geography
-
1. North America
- 1.1. United States
- 1.2. Canada
- 1.3. Mexico
-
2. South America
- 2.1. Brazil
- 2.2. Argentina
- 2.3. Rest of South America
-
3. Europe
- 3.1. United Kingdom
- 3.2. Germany
- 3.3. France
- 3.4. Italy
- 3.5. Spain
- 3.6. Russia
- 3.7. Benelux
- 3.8. Nordics
- 3.9. Rest of Europe
-
4. Middle East & Africa
- 4.1. Turkey
- 4.2. Israel
- 4.3. GCC
- 4.4. North Africa
- 4.5. South Africa
- 4.6. Rest of Middle East & Africa
-
5. Asia Pacific
- 5.1. China
- 5.2. India
- 5.3. Japan
- 5.4. South Korea
- 5.5. ASEAN
- 5.6. Oceania
- 5.7. Rest of Asia Pacific
Consumer Technical Support Services Market REPORT HIGHLIGHTS
| Aspects | Details |
|---|---|
| Study Period | 2019-2033 |
| Base Year | 2024 |
| Estimated Year | 2025 |
| Forecast Period | 2025-2033 |
| Historical Period | 2019-2024 |
| Growth Rate | CAGR of 7.30% from 2019-2033 |
| Segmentation |
|
Table of Contents
- 1. Introduction
- 1.1. Research Scope
- 1.2. Market Segmentation
- 1.3. Research Methodology
- 1.4. Definitions and Assumptions
- 2. Executive Summary
- 2.1. Introduction
- 3. Market Dynamics
- 3.1. Introduction
- 3.2. Market Drivers
- 3.2.1. Increase in Automation in the Industry; Digital Transformation and Industry 4.0 Practices
- 3.3. Market Restrains
- 3.3.1. High Initial Costs and Low ROI; Design and Upgradation of Platforms
- 3.4. Market Trends
- 3.4.1. Help Desk Holds the Major Market Share
- 4. Market Factor Analysis
- 4.1. Porters Five Forces
- 4.2. Supply/Value Chain
- 4.3. PESTEL analysis
- 4.4. Market Entropy
- 4.5. Patent/Trademark Analysis
- 5. Global Consumer Technical Support Services Market Analysis, Insights and Forecast, 2019-2031
- 5.1. Market Analysis, Insights and Forecast - by Type
- 5.1.1. Help Desk
- 5.1.2. Call Centre
- 5.2. Market Analysis, Insights and Forecast - by End-User
- 5.2.1. IT and Telecommunication
- 5.2.2. BFSI
- 5.2.3. Education
- 5.2.4. Manufacturing
- 5.2.5. Automotive
- 5.2.6. Other
- 5.3. Market Analysis, Insights and Forecast - by Region
- 5.3.1. North America
- 5.3.2. South America
- 5.3.3. Europe
- 5.3.4. Middle East & Africa
- 5.3.5. Asia Pacific
- 5.1. Market Analysis, Insights and Forecast - by Type
- 6. North America Consumer Technical Support Services Market Analysis, Insights and Forecast, 2019-2031
- 6.1. Market Analysis, Insights and Forecast - by Type
- 6.1.1. Help Desk
- 6.1.2. Call Centre
- 6.2. Market Analysis, Insights and Forecast - by End-User
- 6.2.1. IT and Telecommunication
- 6.2.2. BFSI
- 6.2.3. Education
- 6.2.4. Manufacturing
- 6.2.5. Automotive
- 6.2.6. Other
- 6.1. Market Analysis, Insights and Forecast - by Type
- 7. South America Consumer Technical Support Services Market Analysis, Insights and Forecast, 2019-2031
- 7.1. Market Analysis, Insights and Forecast - by Type
- 7.1.1. Help Desk
- 7.1.2. Call Centre
- 7.2. Market Analysis, Insights and Forecast - by End-User
- 7.2.1. IT and Telecommunication
- 7.2.2. BFSI
- 7.2.3. Education
- 7.2.4. Manufacturing
- 7.2.5. Automotive
- 7.2.6. Other
- 7.1. Market Analysis, Insights and Forecast - by Type
- 8. Europe Consumer Technical Support Services Market Analysis, Insights and Forecast, 2019-2031
- 8.1. Market Analysis, Insights and Forecast - by Type
- 8.1.1. Help Desk
- 8.1.2. Call Centre
- 8.2. Market Analysis, Insights and Forecast - by End-User
- 8.2.1. IT and Telecommunication
- 8.2.2. BFSI
- 8.2.3. Education
- 8.2.4. Manufacturing
- 8.2.5. Automotive
- 8.2.6. Other
- 8.1. Market Analysis, Insights and Forecast - by Type
- 9. Middle East & Africa Consumer Technical Support Services Market Analysis, Insights and Forecast, 2019-2031
- 9.1. Market Analysis, Insights and Forecast - by Type
- 9.1.1. Help Desk
- 9.1.2. Call Centre
- 9.2. Market Analysis, Insights and Forecast - by End-User
- 9.2.1. IT and Telecommunication
- 9.2.2. BFSI
- 9.2.3. Education
- 9.2.4. Manufacturing
- 9.2.5. Automotive
- 9.2.6. Other
- 9.1. Market Analysis, Insights and Forecast - by Type
- 10. Asia Pacific Consumer Technical Support Services Market Analysis, Insights and Forecast, 2019-2031
- 10.1. Market Analysis, Insights and Forecast - by Type
- 10.1.1. Help Desk
- 10.1.2. Call Centre
- 10.2. Market Analysis, Insights and Forecast - by End-User
- 10.2.1. IT and Telecommunication
- 10.2.2. BFSI
- 10.2.3. Education
- 10.2.4. Manufacturing
- 10.2.5. Automotive
- 10.2.6. Other
- 10.1. Market Analysis, Insights and Forecast - by Type
- 11. North America Consumer Technical Support Services Market Analysis, Insights and Forecast, 2019-2031
- 11.1. Market Analysis, Insights and Forecast - By Country/Sub-region
- 11.1.1 United States
- 11.1.2 Canada
- 11.1.3 Mexico
- 12. Europe Consumer Technical Support Services Market Analysis, Insights and Forecast, 2019-2031
- 12.1. Market Analysis, Insights and Forecast - By Country/Sub-region
- 12.1.1 Germany
- 12.1.2 United Kingdom
- 12.1.3 France
- 12.1.4 Spain
- 12.1.5 Italy
- 12.1.6 Spain
- 12.1.7 Belgium
- 12.1.8 Netherland
- 12.1.9 Nordics
- 12.1.10 Rest of Europe
- 13. Asia Pacific Consumer Technical Support Services Market Analysis, Insights and Forecast, 2019-2031
- 13.1. Market Analysis, Insights and Forecast - By Country/Sub-region
- 13.1.1 China
- 13.1.2 Japan
- 13.1.3 India
- 13.1.4 South Korea
- 13.1.5 Southeast Asia
- 13.1.6 Australia
- 13.1.7 Indonesia
- 13.1.8 Phillipes
- 13.1.9 Singapore
- 13.1.10 Thailandc
- 13.1.11 Rest of Asia Pacific
- 14. South America Consumer Technical Support Services Market Analysis, Insights and Forecast, 2019-2031
- 14.1. Market Analysis, Insights and Forecast - By Country/Sub-region
- 14.1.1 Brazil
- 14.1.2 Argentina
- 14.1.3 Peru
- 14.1.4 Chile
- 14.1.5 Colombia
- 14.1.6 Ecuador
- 14.1.7 Venezuela
- 14.1.8 Rest of South America
- 15. North America Consumer Technical Support Services Market Analysis, Insights and Forecast, 2019-2031
- 15.1. Market Analysis, Insights and Forecast - By Country/Sub-region
- 15.1.1 United States
- 15.1.2 Canada
- 15.1.3 Mexico
- 16. MEA Consumer Technical Support Services Market Analysis, Insights and Forecast, 2019-2031
- 16.1. Market Analysis, Insights and Forecast - By Country/Sub-region
- 16.1.1 United Arab Emirates
- 16.1.2 Saudi Arabia
- 16.1.3 South Africa
- 16.1.4 Rest of Middle East and Africa
- 17. Competitive Analysis
- 17.1. Global Market Share Analysis 2024
- 17.2. Company Profiles
- 17.2.1 Infosys Limited
- 17.2.1.1. Overview
- 17.2.1.2. Products
- 17.2.1.3. SWOT Analysis
- 17.2.1.4. Recent Developments
- 17.2.1.5. Financials (Based on Availability)
- 17.2.2 Accenture PLC
- 17.2.2.1. Overview
- 17.2.2.2. Products
- 17.2.2.3. SWOT Analysis
- 17.2.2.4. Recent Developments
- 17.2.2.5. Financials (Based on Availability)
- 17.2.3 Suma Soft
- 17.2.3.1. Overview
- 17.2.3.2. Products
- 17.2.3.3. SWOT Analysis
- 17.2.3.4. Recent Developments
- 17.2.3.5. Financials (Based on Availability)
- 17.2.4 HCL Technologies
- 17.2.4.1. Overview
- 17.2.4.2. Products
- 17.2.4.3. SWOT Analysis
- 17.2.4.4. Recent Developments
- 17.2.4.5. Financials (Based on Availability)
- 17.2.5 IBM Corporation
- 17.2.5.1. Overview
- 17.2.5.2. Products
- 17.2.5.3. SWOT Analysis
- 17.2.5.4. Recent Developments
- 17.2.5.5. Financials (Based on Availability)
- 17.2.6 Flatworld Solutions Pvt Ltd
- 17.2.6.1. Overview
- 17.2.6.2. Products
- 17.2.6.3. SWOT Analysis
- 17.2.6.4. Recent Developments
- 17.2.6.5. Financials (Based on Availability)
- 17.2.7 Qcom Outsourcing Ltd
- 17.2.7.1. Overview
- 17.2.7.2. Products
- 17.2.7.3. SWOT Analysis
- 17.2.7.4. Recent Developments
- 17.2.7.5. Financials (Based on Availability)
- 17.2.8 Collabera Inc
- 17.2.8.1. Overview
- 17.2.8.2. Products
- 17.2.8.3. SWOT Analysis
- 17.2.8.4. Recent Developments
- 17.2.8.5. Financials (Based on Availability)
- 17.2.9 Genpact
- 17.2.9.1. Overview
- 17.2.9.2. Products
- 17.2.9.3. SWOT Analysis
- 17.2.9.4. Recent Developments
- 17.2.9.5. Financials (Based on Availability)
- 17.2.10 Aegis Plc(Essar)
- 17.2.10.1. Overview
- 17.2.10.2. Products
- 17.2.10.3. SWOT Analysis
- 17.2.10.4. Recent Developments
- 17.2.10.5. Financials (Based on Availability)
- 17.2.11 Worldwide Call Centers Inc
- 17.2.11.1. Overview
- 17.2.11.2. Products
- 17.2.11.3. SWOT Analysis
- 17.2.11.4. Recent Developments
- 17.2.11.5. Financials (Based on Availability)
- 17.2.12 Tata Consultancy Services Limited
- 17.2.12.1. Overview
- 17.2.12.2. Products
- 17.2.12.3. SWOT Analysis
- 17.2.12.4. Recent Developments
- 17.2.12.5. Financials (Based on Availability)
- 17.2.13 Wipro Limited
- 17.2.13.1. Overview
- 17.2.13.2. Products
- 17.2.13.3. SWOT Analysis
- 17.2.13.4. Recent Developments
- 17.2.13.5. Financials (Based on Availability)
- 17.2.1 Infosys Limited
List of Figures
- Figure 1: Global Consumer Technical Support Services Market Revenue Breakdown (Million, %) by Region 2024 & 2032
- Figure 2: Global Consumer Technical Support Services Market Volume Breakdown (K Unit, %) by Region 2024 & 2032
- Figure 3: North America Consumer Technical Support Services Market Revenue (Million), by Country 2024 & 2032
- Figure 4: North America Consumer Technical Support Services Market Volume (K Unit), by Country 2024 & 2032
- Figure 5: North America Consumer Technical Support Services Market Revenue Share (%), by Country 2024 & 2032
- Figure 6: North America Consumer Technical Support Services Market Volume Share (%), by Country 2024 & 2032
- Figure 7: Europe Consumer Technical Support Services Market Revenue (Million), by Country 2024 & 2032
- Figure 8: Europe Consumer Technical Support Services Market Volume (K Unit), by Country 2024 & 2032
- Figure 9: Europe Consumer Technical Support Services Market Revenue Share (%), by Country 2024 & 2032
- Figure 10: Europe Consumer Technical Support Services Market Volume Share (%), by Country 2024 & 2032
- Figure 11: Asia Pacific Consumer Technical Support Services Market Revenue (Million), by Country 2024 & 2032
- Figure 12: Asia Pacific Consumer Technical Support Services Market Volume (K Unit), by Country 2024 & 2032
- Figure 13: Asia Pacific Consumer Technical Support Services Market Revenue Share (%), by Country 2024 & 2032
- Figure 14: Asia Pacific Consumer Technical Support Services Market Volume Share (%), by Country 2024 & 2032
- Figure 15: South America Consumer Technical Support Services Market Revenue (Million), by Country 2024 & 2032
- Figure 16: South America Consumer Technical Support Services Market Volume (K Unit), by Country 2024 & 2032
- Figure 17: South America Consumer Technical Support Services Market Revenue Share (%), by Country 2024 & 2032
- Figure 18: South America Consumer Technical Support Services Market Volume Share (%), by Country 2024 & 2032
- Figure 19: North America Consumer Technical Support Services Market Revenue (Million), by Country 2024 & 2032
- Figure 20: North America Consumer Technical Support Services Market Volume (K Unit), by Country 2024 & 2032
- Figure 21: North America Consumer Technical Support Services Market Revenue Share (%), by Country 2024 & 2032
- Figure 22: North America Consumer Technical Support Services Market Volume Share (%), by Country 2024 & 2032
- Figure 23: MEA Consumer Technical Support Services Market Revenue (Million), by Country 2024 & 2032
- Figure 24: MEA Consumer Technical Support Services Market Volume (K Unit), by Country 2024 & 2032
- Figure 25: MEA Consumer Technical Support Services Market Revenue Share (%), by Country 2024 & 2032
- Figure 26: MEA Consumer Technical Support Services Market Volume Share (%), by Country 2024 & 2032
- Figure 27: North America Consumer Technical Support Services Market Revenue (Million), by Type 2024 & 2032
- Figure 28: North America Consumer Technical Support Services Market Volume (K Unit), by Type 2024 & 2032
- Figure 29: North America Consumer Technical Support Services Market Revenue Share (%), by Type 2024 & 2032
- Figure 30: North America Consumer Technical Support Services Market Volume Share (%), by Type 2024 & 2032
- Figure 31: North America Consumer Technical Support Services Market Revenue (Million), by End-User 2024 & 2032
- Figure 32: North America Consumer Technical Support Services Market Volume (K Unit), by End-User 2024 & 2032
- Figure 33: North America Consumer Technical Support Services Market Revenue Share (%), by End-User 2024 & 2032
- Figure 34: North America Consumer Technical Support Services Market Volume Share (%), by End-User 2024 & 2032
- Figure 35: North America Consumer Technical Support Services Market Revenue (Million), by Country 2024 & 2032
- Figure 36: North America Consumer Technical Support Services Market Volume (K Unit), by Country 2024 & 2032
- Figure 37: North America Consumer Technical Support Services Market Revenue Share (%), by Country 2024 & 2032
- Figure 38: North America Consumer Technical Support Services Market Volume Share (%), by Country 2024 & 2032
- Figure 39: South America Consumer Technical Support Services Market Revenue (Million), by Type 2024 & 2032
- Figure 40: South America Consumer Technical Support Services Market Volume (K Unit), by Type 2024 & 2032
- Figure 41: South America Consumer Technical Support Services Market Revenue Share (%), by Type 2024 & 2032
- Figure 42: South America Consumer Technical Support Services Market Volume Share (%), by Type 2024 & 2032
- Figure 43: South America Consumer Technical Support Services Market Revenue (Million), by End-User 2024 & 2032
- Figure 44: South America Consumer Technical Support Services Market Volume (K Unit), by End-User 2024 & 2032
- Figure 45: South America Consumer Technical Support Services Market Revenue Share (%), by End-User 2024 & 2032
- Figure 46: South America Consumer Technical Support Services Market Volume Share (%), by End-User 2024 & 2032
- Figure 47: South America Consumer Technical Support Services Market Revenue (Million), by Country 2024 & 2032
- Figure 48: South America Consumer Technical Support Services Market Volume (K Unit), by Country 2024 & 2032
- Figure 49: South America Consumer Technical Support Services Market Revenue Share (%), by Country 2024 & 2032
- Figure 50: South America Consumer Technical Support Services Market Volume Share (%), by Country 2024 & 2032
- Figure 51: Europe Consumer Technical Support Services Market Revenue (Million), by Type 2024 & 2032
- Figure 52: Europe Consumer Technical Support Services Market Volume (K Unit), by Type 2024 & 2032
- Figure 53: Europe Consumer Technical Support Services Market Revenue Share (%), by Type 2024 & 2032
- Figure 54: Europe Consumer Technical Support Services Market Volume Share (%), by Type 2024 & 2032
- Figure 55: Europe Consumer Technical Support Services Market Revenue (Million), by End-User 2024 & 2032
- Figure 56: Europe Consumer Technical Support Services Market Volume (K Unit), by End-User 2024 & 2032
- Figure 57: Europe Consumer Technical Support Services Market Revenue Share (%), by End-User 2024 & 2032
- Figure 58: Europe Consumer Technical Support Services Market Volume Share (%), by End-User 2024 & 2032
- Figure 59: Europe Consumer Technical Support Services Market Revenue (Million), by Country 2024 & 2032
- Figure 60: Europe Consumer Technical Support Services Market Volume (K Unit), by Country 2024 & 2032
- Figure 61: Europe Consumer Technical Support Services Market Revenue Share (%), by Country 2024 & 2032
- Figure 62: Europe Consumer Technical Support Services Market Volume Share (%), by Country 2024 & 2032
- Figure 63: Middle East & Africa Consumer Technical Support Services Market Revenue (Million), by Type 2024 & 2032
- Figure 64: Middle East & Africa Consumer Technical Support Services Market Volume (K Unit), by Type 2024 & 2032
- Figure 65: Middle East & Africa Consumer Technical Support Services Market Revenue Share (%), by Type 2024 & 2032
- Figure 66: Middle East & Africa Consumer Technical Support Services Market Volume Share (%), by Type 2024 & 2032
- Figure 67: Middle East & Africa Consumer Technical Support Services Market Revenue (Million), by End-User 2024 & 2032
- Figure 68: Middle East & Africa Consumer Technical Support Services Market Volume (K Unit), by End-User 2024 & 2032
- Figure 69: Middle East & Africa Consumer Technical Support Services Market Revenue Share (%), by End-User 2024 & 2032
- Figure 70: Middle East & Africa Consumer Technical Support Services Market Volume Share (%), by End-User 2024 & 2032
- Figure 71: Middle East & Africa Consumer Technical Support Services Market Revenue (Million), by Country 2024 & 2032
- Figure 72: Middle East & Africa Consumer Technical Support Services Market Volume (K Unit), by Country 2024 & 2032
- Figure 73: Middle East & Africa Consumer Technical Support Services Market Revenue Share (%), by Country 2024 & 2032
- Figure 74: Middle East & Africa Consumer Technical Support Services Market Volume Share (%), by Country 2024 & 2032
- Figure 75: Asia Pacific Consumer Technical Support Services Market Revenue (Million), by Type 2024 & 2032
- Figure 76: Asia Pacific Consumer Technical Support Services Market Volume (K Unit), by Type 2024 & 2032
- Figure 77: Asia Pacific Consumer Technical Support Services Market Revenue Share (%), by Type 2024 & 2032
- Figure 78: Asia Pacific Consumer Technical Support Services Market Volume Share (%), by Type 2024 & 2032
- Figure 79: Asia Pacific Consumer Technical Support Services Market Revenue (Million), by End-User 2024 & 2032
- Figure 80: Asia Pacific Consumer Technical Support Services Market Volume (K Unit), by End-User 2024 & 2032
- Figure 81: Asia Pacific Consumer Technical Support Services Market Revenue Share (%), by End-User 2024 & 2032
- Figure 82: Asia Pacific Consumer Technical Support Services Market Volume Share (%), by End-User 2024 & 2032
- Figure 83: Asia Pacific Consumer Technical Support Services Market Revenue (Million), by Country 2024 & 2032
- Figure 84: Asia Pacific Consumer Technical Support Services Market Volume (K Unit), by Country 2024 & 2032
- Figure 85: Asia Pacific Consumer Technical Support Services Market Revenue Share (%), by Country 2024 & 2032
- Figure 86: Asia Pacific Consumer Technical Support Services Market Volume Share (%), by Country 2024 & 2032
List of Tables
- Table 1: Global Consumer Technical Support Services Market Revenue Million Forecast, by Region 2019 & 2032
- Table 2: Global Consumer Technical Support Services Market Volume K Unit Forecast, by Region 2019 & 2032
- Table 3: Global Consumer Technical Support Services Market Revenue Million Forecast, by Type 2019 & 2032
- Table 4: Global Consumer Technical Support Services Market Volume K Unit Forecast, by Type 2019 & 2032
- Table 5: Global Consumer Technical Support Services Market Revenue Million Forecast, by End-User 2019 & 2032
- Table 6: Global Consumer Technical Support Services Market Volume K Unit Forecast, by End-User 2019 & 2032
- Table 7: Global Consumer Technical Support Services Market Revenue Million Forecast, by Region 2019 & 2032
- Table 8: Global Consumer Technical Support Services Market Volume K Unit Forecast, by Region 2019 & 2032
- Table 9: Global Consumer Technical Support Services Market Revenue Million Forecast, by Country 2019 & 2032
- Table 10: Global Consumer Technical Support Services Market Volume K Unit Forecast, by Country 2019 & 2032
- Table 11: United States Consumer Technical Support Services Market Revenue (Million) Forecast, by Application 2019 & 2032
- Table 12: United States Consumer Technical Support Services Market Volume (K Unit) Forecast, by Application 2019 & 2032
- Table 13: Canada Consumer Technical Support Services Market Revenue (Million) Forecast, by Application 2019 & 2032
- Table 14: Canada Consumer Technical Support Services Market Volume (K Unit) Forecast, by Application 2019 & 2032
- Table 15: Mexico Consumer Technical Support Services Market Revenue (Million) Forecast, by Application 2019 & 2032
- Table 16: Mexico Consumer Technical Support Services Market Volume (K Unit) Forecast, by Application 2019 & 2032
- Table 17: Global Consumer Technical Support Services Market Revenue Million Forecast, by Country 2019 & 2032
- Table 18: Global Consumer Technical Support Services Market Volume K Unit Forecast, by Country 2019 & 2032
- Table 19: Germany Consumer Technical Support Services Market Revenue (Million) Forecast, by Application 2019 & 2032
- Table 20: Germany Consumer Technical Support Services Market Volume (K Unit) Forecast, by Application 2019 & 2032
- Table 21: United Kingdom Consumer Technical Support Services Market Revenue (Million) Forecast, by Application 2019 & 2032
- Table 22: United Kingdom Consumer Technical Support Services Market Volume (K Unit) Forecast, by Application 2019 & 2032
- Table 23: France Consumer Technical Support Services Market Revenue (Million) Forecast, by Application 2019 & 2032
- Table 24: France Consumer Technical Support Services Market Volume (K Unit) Forecast, by Application 2019 & 2032
- Table 25: Spain Consumer Technical Support Services Market Revenue (Million) Forecast, by Application 2019 & 2032
- Table 26: Spain Consumer Technical Support Services Market Volume (K Unit) Forecast, by Application 2019 & 2032
- Table 27: Italy Consumer Technical Support Services Market Revenue (Million) Forecast, by Application 2019 & 2032
- Table 28: Italy Consumer Technical Support Services Market Volume (K Unit) Forecast, by Application 2019 & 2032
- Table 29: Spain Consumer Technical Support Services Market Revenue (Million) Forecast, by Application 2019 & 2032
- Table 30: Spain Consumer Technical Support Services Market Volume (K Unit) Forecast, by Application 2019 & 2032
- Table 31: Belgium Consumer Technical Support Services Market Revenue (Million) Forecast, by Application 2019 & 2032
- Table 32: Belgium Consumer Technical Support Services Market Volume (K Unit) Forecast, by Application 2019 & 2032
- Table 33: Netherland Consumer Technical Support Services Market Revenue (Million) Forecast, by Application 2019 & 2032
- Table 34: Netherland Consumer Technical Support Services Market Volume (K Unit) Forecast, by Application 2019 & 2032
- Table 35: Nordics Consumer Technical Support Services Market Revenue (Million) Forecast, by Application 2019 & 2032
- Table 36: Nordics Consumer Technical Support Services Market Volume (K Unit) Forecast, by Application 2019 & 2032
- Table 37: Rest of Europe Consumer Technical Support Services Market Revenue (Million) Forecast, by Application 2019 & 2032
- Table 38: Rest of Europe Consumer Technical Support Services Market Volume (K Unit) Forecast, by Application 2019 & 2032
- Table 39: Global Consumer Technical Support Services Market Revenue Million Forecast, by Country 2019 & 2032
- Table 40: Global Consumer Technical Support Services Market Volume K Unit Forecast, by Country 2019 & 2032
- Table 41: China Consumer Technical Support Services Market Revenue (Million) Forecast, by Application 2019 & 2032
- Table 42: China Consumer Technical Support Services Market Volume (K Unit) Forecast, by Application 2019 & 2032
- Table 43: Japan Consumer Technical Support Services Market Revenue (Million) Forecast, by Application 2019 & 2032
- Table 44: Japan Consumer Technical Support Services Market Volume (K Unit) Forecast, by Application 2019 & 2032
- Table 45: India Consumer Technical Support Services Market Revenue (Million) Forecast, by Application 2019 & 2032
- Table 46: India Consumer Technical Support Services Market Volume (K Unit) Forecast, by Application 2019 & 2032
- Table 47: South Korea Consumer Technical Support Services Market Revenue (Million) Forecast, by Application 2019 & 2032
- Table 48: South Korea Consumer Technical Support Services Market Volume (K Unit) Forecast, by Application 2019 & 2032
- Table 49: Southeast Asia Consumer Technical Support Services Market Revenue (Million) Forecast, by Application 2019 & 2032
- Table 50: Southeast Asia Consumer Technical Support Services Market Volume (K Unit) Forecast, by Application 2019 & 2032
- Table 51: Australia Consumer Technical Support Services Market Revenue (Million) Forecast, by Application 2019 & 2032
- Table 52: Australia Consumer Technical Support Services Market Volume (K Unit) Forecast, by Application 2019 & 2032
- Table 53: Indonesia Consumer Technical Support Services Market Revenue (Million) Forecast, by Application 2019 & 2032
- Table 54: Indonesia Consumer Technical Support Services Market Volume (K Unit) Forecast, by Application 2019 & 2032
- Table 55: Phillipes Consumer Technical Support Services Market Revenue (Million) Forecast, by Application 2019 & 2032
- Table 56: Phillipes Consumer Technical Support Services Market Volume (K Unit) Forecast, by Application 2019 & 2032
- Table 57: Singapore Consumer Technical Support Services Market Revenue (Million) Forecast, by Application 2019 & 2032
- Table 58: Singapore Consumer Technical Support Services Market Volume (K Unit) Forecast, by Application 2019 & 2032
- Table 59: Thailandc Consumer Technical Support Services Market Revenue (Million) Forecast, by Application 2019 & 2032
- Table 60: Thailandc Consumer Technical Support Services Market Volume (K Unit) Forecast, by Application 2019 & 2032
- Table 61: Rest of Asia Pacific Consumer Technical Support Services Market Revenue (Million) Forecast, by Application 2019 & 2032
- Table 62: Rest of Asia Pacific Consumer Technical Support Services Market Volume (K Unit) Forecast, by Application 2019 & 2032
- Table 63: Global Consumer Technical Support Services Market Revenue Million Forecast, by Country 2019 & 2032
- Table 64: Global Consumer Technical Support Services Market Volume K Unit Forecast, by Country 2019 & 2032
- Table 65: Brazil Consumer Technical Support Services Market Revenue (Million) Forecast, by Application 2019 & 2032
- Table 66: Brazil Consumer Technical Support Services Market Volume (K Unit) Forecast, by Application 2019 & 2032
- Table 67: Argentina Consumer Technical Support Services Market Revenue (Million) Forecast, by Application 2019 & 2032
- Table 68: Argentina Consumer Technical Support Services Market Volume (K Unit) Forecast, by Application 2019 & 2032
- Table 69: Peru Consumer Technical Support Services Market Revenue (Million) Forecast, by Application 2019 & 2032
- Table 70: Peru Consumer Technical Support Services Market Volume (K Unit) Forecast, by Application 2019 & 2032
- Table 71: Chile Consumer Technical Support Services Market Revenue (Million) Forecast, by Application 2019 & 2032
- Table 72: Chile Consumer Technical Support Services Market Volume (K Unit) Forecast, by Application 2019 & 2032
- Table 73: Colombia Consumer Technical Support Services Market Revenue (Million) Forecast, by Application 2019 & 2032
- Table 74: Colombia Consumer Technical Support Services Market Volume (K Unit) Forecast, by Application 2019 & 2032
- Table 75: Ecuador Consumer Technical Support Services Market Revenue (Million) Forecast, by Application 2019 & 2032
- Table 76: Ecuador Consumer Technical Support Services Market Volume (K Unit) Forecast, by Application 2019 & 2032
- Table 77: Venezuela Consumer Technical Support Services Market Revenue (Million) Forecast, by Application 2019 & 2032
- Table 78: Venezuela Consumer Technical Support Services Market Volume (K Unit) Forecast, by Application 2019 & 2032
- Table 79: Rest of South America Consumer Technical Support Services Market Revenue (Million) Forecast, by Application 2019 & 2032
- Table 80: Rest of South America Consumer Technical Support Services Market Volume (K Unit) Forecast, by Application 2019 & 2032
- Table 81: Global Consumer Technical Support Services Market Revenue Million Forecast, by Country 2019 & 2032
- Table 82: Global Consumer Technical Support Services Market Volume K Unit Forecast, by Country 2019 & 2032
- Table 83: United States Consumer Technical Support Services Market Revenue (Million) Forecast, by Application 2019 & 2032
- Table 84: United States Consumer Technical Support Services Market Volume (K Unit) Forecast, by Application 2019 & 2032
- Table 85: Canada Consumer Technical Support Services Market Revenue (Million) Forecast, by Application 2019 & 2032
- Table 86: Canada Consumer Technical Support Services Market Volume (K Unit) Forecast, by Application 2019 & 2032
- Table 87: Mexico Consumer Technical Support Services Market Revenue (Million) Forecast, by Application 2019 & 2032
- Table 88: Mexico Consumer Technical Support Services Market Volume (K Unit) Forecast, by Application 2019 & 2032
- Table 89: Global Consumer Technical Support Services Market Revenue Million Forecast, by Country 2019 & 2032
- Table 90: Global Consumer Technical Support Services Market Volume K Unit Forecast, by Country 2019 & 2032
- Table 91: United Arab Emirates Consumer Technical Support Services Market Revenue (Million) Forecast, by Application 2019 & 2032
- Table 92: United Arab Emirates Consumer Technical Support Services Market Volume (K Unit) Forecast, by Application 2019 & 2032
- Table 93: Saudi Arabia Consumer Technical Support Services Market Revenue (Million) Forecast, by Application 2019 & 2032
- Table 94: Saudi Arabia Consumer Technical Support Services Market Volume (K Unit) Forecast, by Application 2019 & 2032
- Table 95: South Africa Consumer Technical Support Services Market Revenue (Million) Forecast, by Application 2019 & 2032
- Table 96: South Africa Consumer Technical Support Services Market Volume (K Unit) Forecast, by Application 2019 & 2032
- Table 97: Rest of Middle East and Africa Consumer Technical Support Services Market Revenue (Million) Forecast, by Application 2019 & 2032
- Table 98: Rest of Middle East and Africa Consumer Technical Support Services Market Volume (K Unit) Forecast, by Application 2019 & 2032
- Table 99: Global Consumer Technical Support Services Market Revenue Million Forecast, by Type 2019 & 2032
- Table 100: Global Consumer Technical Support Services Market Volume K Unit Forecast, by Type 2019 & 2032
- Table 101: Global Consumer Technical Support Services Market Revenue Million Forecast, by End-User 2019 & 2032
- Table 102: Global Consumer Technical Support Services Market Volume K Unit Forecast, by End-User 2019 & 2032
- Table 103: Global Consumer Technical Support Services Market Revenue Million Forecast, by Country 2019 & 2032
- Table 104: Global Consumer Technical Support Services Market Volume K Unit Forecast, by Country 2019 & 2032
- Table 105: United States Consumer Technical Support Services Market Revenue (Million) Forecast, by Application 2019 & 2032
- Table 106: United States Consumer Technical Support Services Market Volume (K Unit) Forecast, by Application 2019 & 2032
- Table 107: Canada Consumer Technical Support Services Market Revenue (Million) Forecast, by Application 2019 & 2032
- Table 108: Canada Consumer Technical Support Services Market Volume (K Unit) Forecast, by Application 2019 & 2032
- Table 109: Mexico Consumer Technical Support Services Market Revenue (Million) Forecast, by Application 2019 & 2032
- Table 110: Mexico Consumer Technical Support Services Market Volume (K Unit) Forecast, by Application 2019 & 2032
- Table 111: Global Consumer Technical Support Services Market Revenue Million Forecast, by Type 2019 & 2032
- Table 112: Global Consumer Technical Support Services Market Volume K Unit Forecast, by Type 2019 & 2032
- Table 113: Global Consumer Technical Support Services Market Revenue Million Forecast, by End-User 2019 & 2032
- Table 114: Global Consumer Technical Support Services Market Volume K Unit Forecast, by End-User 2019 & 2032
- Table 115: Global Consumer Technical Support Services Market Revenue Million Forecast, by Country 2019 & 2032
- Table 116: Global Consumer Technical Support Services Market Volume K Unit Forecast, by Country 2019 & 2032
- Table 117: Brazil Consumer Technical Support Services Market Revenue (Million) Forecast, by Application 2019 & 2032
- Table 118: Brazil Consumer Technical Support Services Market Volume (K Unit) Forecast, by Application 2019 & 2032
- Table 119: Argentina Consumer Technical Support Services Market Revenue (Million) Forecast, by Application 2019 & 2032
- Table 120: Argentina Consumer Technical Support Services Market Volume (K Unit) Forecast, by Application 2019 & 2032
- Table 121: Rest of South America Consumer Technical Support Services Market Revenue (Million) Forecast, by Application 2019 & 2032
- Table 122: Rest of South America Consumer Technical Support Services Market Volume (K Unit) Forecast, by Application 2019 & 2032
- Table 123: Global Consumer Technical Support Services Market Revenue Million Forecast, by Type 2019 & 2032
- Table 124: Global Consumer Technical Support Services Market Volume K Unit Forecast, by Type 2019 & 2032
- Table 125: Global Consumer Technical Support Services Market Revenue Million Forecast, by End-User 2019 & 2032
- Table 126: Global Consumer Technical Support Services Market Volume K Unit Forecast, by End-User 2019 & 2032
- Table 127: Global Consumer Technical Support Services Market Revenue Million Forecast, by Country 2019 & 2032
- Table 128: Global Consumer Technical Support Services Market Volume K Unit Forecast, by Country 2019 & 2032
- Table 129: United Kingdom Consumer Technical Support Services Market Revenue (Million) Forecast, by Application 2019 & 2032
- Table 130: United Kingdom Consumer Technical Support Services Market Volume (K Unit) Forecast, by Application 2019 & 2032
- Table 131: Germany Consumer Technical Support Services Market Revenue (Million) Forecast, by Application 2019 & 2032
- Table 132: Germany Consumer Technical Support Services Market Volume (K Unit) Forecast, by Application 2019 & 2032
- Table 133: France Consumer Technical Support Services Market Revenue (Million) Forecast, by Application 2019 & 2032
- Table 134: France Consumer Technical Support Services Market Volume (K Unit) Forecast, by Application 2019 & 2032
- Table 135: Italy Consumer Technical Support Services Market Revenue (Million) Forecast, by Application 2019 & 2032
- Table 136: Italy Consumer Technical Support Services Market Volume (K Unit) Forecast, by Application 2019 & 2032
- Table 137: Spain Consumer Technical Support Services Market Revenue (Million) Forecast, by Application 2019 & 2032
- Table 138: Spain Consumer Technical Support Services Market Volume (K Unit) Forecast, by Application 2019 & 2032
- Table 139: Russia Consumer Technical Support Services Market Revenue (Million) Forecast, by Application 2019 & 2032
- Table 140: Russia Consumer Technical Support Services Market Volume (K Unit) Forecast, by Application 2019 & 2032
- Table 141: Benelux Consumer Technical Support Services Market Revenue (Million) Forecast, by Application 2019 & 2032
- Table 142: Benelux Consumer Technical Support Services Market Volume (K Unit) Forecast, by Application 2019 & 2032
- Table 143: Nordics Consumer Technical Support Services Market Revenue (Million) Forecast, by Application 2019 & 2032
- Table 144: Nordics Consumer Technical Support Services Market Volume (K Unit) Forecast, by Application 2019 & 2032
- Table 145: Rest of Europe Consumer Technical Support Services Market Revenue (Million) Forecast, by Application 2019 & 2032
- Table 146: Rest of Europe Consumer Technical Support Services Market Volume (K Unit) Forecast, by Application 2019 & 2032
- Table 147: Global Consumer Technical Support Services Market Revenue Million Forecast, by Type 2019 & 2032
- Table 148: Global Consumer Technical Support Services Market Volume K Unit Forecast, by Type 2019 & 2032
- Table 149: Global Consumer Technical Support Services Market Revenue Million Forecast, by End-User 2019 & 2032
- Table 150: Global Consumer Technical Support Services Market Volume K Unit Forecast, by End-User 2019 & 2032
- Table 151: Global Consumer Technical Support Services Market Revenue Million Forecast, by Country 2019 & 2032
- Table 152: Global Consumer Technical Support Services Market Volume K Unit Forecast, by Country 2019 & 2032
- Table 153: Turkey Consumer Technical Support Services Market Revenue (Million) Forecast, by Application 2019 & 2032
- Table 154: Turkey Consumer Technical Support Services Market Volume (K Unit) Forecast, by Application 2019 & 2032
- Table 155: Israel Consumer Technical Support Services Market Revenue (Million) Forecast, by Application 2019 & 2032
- Table 156: Israel Consumer Technical Support Services Market Volume (K Unit) Forecast, by Application 2019 & 2032
- Table 157: GCC Consumer Technical Support Services Market Revenue (Million) Forecast, by Application 2019 & 2032
- Table 158: GCC Consumer Technical Support Services Market Volume (K Unit) Forecast, by Application 2019 & 2032
- Table 159: North Africa Consumer Technical Support Services Market Revenue (Million) Forecast, by Application 2019 & 2032
- Table 160: North Africa Consumer Technical Support Services Market Volume (K Unit) Forecast, by Application 2019 & 2032
- Table 161: South Africa Consumer Technical Support Services Market Revenue (Million) Forecast, by Application 2019 & 2032
- Table 162: South Africa Consumer Technical Support Services Market Volume (K Unit) Forecast, by Application 2019 & 2032
- Table 163: Rest of Middle East & Africa Consumer Technical Support Services Market Revenue (Million) Forecast, by Application 2019 & 2032
- Table 164: Rest of Middle East & Africa Consumer Technical Support Services Market Volume (K Unit) Forecast, by Application 2019 & 2032
- Table 165: Global Consumer Technical Support Services Market Revenue Million Forecast, by Type 2019 & 2032
- Table 166: Global Consumer Technical Support Services Market Volume K Unit Forecast, by Type 2019 & 2032
- Table 167: Global Consumer Technical Support Services Market Revenue Million Forecast, by End-User 2019 & 2032
- Table 168: Global Consumer Technical Support Services Market Volume K Unit Forecast, by End-User 2019 & 2032
- Table 169: Global Consumer Technical Support Services Market Revenue Million Forecast, by Country 2019 & 2032
- Table 170: Global Consumer Technical Support Services Market Volume K Unit Forecast, by Country 2019 & 2032
- Table 171: China Consumer Technical Support Services Market Revenue (Million) Forecast, by Application 2019 & 2032
- Table 172: China Consumer Technical Support Services Market Volume (K Unit) Forecast, by Application 2019 & 2032
- Table 173: India Consumer Technical Support Services Market Revenue (Million) Forecast, by Application 2019 & 2032
- Table 174: India Consumer Technical Support Services Market Volume (K Unit) Forecast, by Application 2019 & 2032
- Table 175: Japan Consumer Technical Support Services Market Revenue (Million) Forecast, by Application 2019 & 2032
- Table 176: Japan Consumer Technical Support Services Market Volume (K Unit) Forecast, by Application 2019 & 2032
- Table 177: South Korea Consumer Technical Support Services Market Revenue (Million) Forecast, by Application 2019 & 2032
- Table 178: South Korea Consumer Technical Support Services Market Volume (K Unit) Forecast, by Application 2019 & 2032
- Table 179: ASEAN Consumer Technical Support Services Market Revenue (Million) Forecast, by Application 2019 & 2032
- Table 180: ASEAN Consumer Technical Support Services Market Volume (K Unit) Forecast, by Application 2019 & 2032
- Table 181: Oceania Consumer Technical Support Services Market Revenue (Million) Forecast, by Application 2019 & 2032
- Table 182: Oceania Consumer Technical Support Services Market Volume (K Unit) Forecast, by Application 2019 & 2032
- Table 183: Rest of Asia Pacific Consumer Technical Support Services Market Revenue (Million) Forecast, by Application 2019 & 2032
- Table 184: Rest of Asia Pacific Consumer Technical Support Services Market Volume (K Unit) Forecast, by Application 2019 & 2032
Frequently Asked Questions
1. What is the projected Compound Annual Growth Rate (CAGR) of the Consumer Technical Support Services Market?
The projected CAGR is approximately 7.30%.
2. Which companies are prominent players in the Consumer Technical Support Services Market?
Key companies in the market include Infosys Limited, Accenture PLC, Suma Soft, HCL Technologies, IBM Corporation, Flatworld Solutions Pvt Ltd, Qcom Outsourcing Ltd, Collabera Inc, Genpact, Aegis Plc(Essar), Worldwide Call Centers Inc, Tata Consultancy Services Limited, Wipro Limited.
3. What are the main segments of the Consumer Technical Support Services Market?
The market segments include Type, End-User.
4. Can you provide details about the market size?
The market size is estimated to be USD XX Million as of 2022.
5. What are some drivers contributing to market growth?
Increase in Automation in the Industry; Digital Transformation and Industry 4.0 Practices.
6. What are the notable trends driving market growth?
Help Desk Holds the Major Market Share.
7. Are there any restraints impacting market growth?
High Initial Costs and Low ROI; Design and Upgradation of Platforms.
8. Can you provide examples of recent developments in the market?
November 2022: Infosys BPM, the business process management division of Infosys, in collaboration with IBM, opened a center for AI and automation in Poland to deliver digital excellence to businesses worldwide. This announcement highlights the two years of strategic collaboration between Infosys BPM and IBM, which will result in successfully delivering customers, discovering new use cases, and developing solutions that empower clients to innovate in hybrid cloud settings.
9. What pricing options are available for accessing the report?
Pricing options include single-user, multi-user, and enterprise licenses priced at USD 4750, USD 5250, and USD 8750 respectively.
10. Is the market size provided in terms of value or volume?
The market size is provided in terms of value, measured in Million and volume, measured in K Unit.
11. Are there any specific market keywords associated with the report?
Yes, the market keyword associated with the report is "Consumer Technical Support Services Market," which aids in identifying and referencing the specific market segment covered.
12. How do I determine which pricing option suits my needs best?
The pricing options vary based on user requirements and access needs. Individual users may opt for single-user licenses, while businesses requiring broader access may choose multi-user or enterprise licenses for cost-effective access to the report.
13. Are there any additional resources or data provided in the Consumer Technical Support Services Market report?
While the report offers comprehensive insights, it's advisable to review the specific contents or supplementary materials provided to ascertain if additional resources or data are available.
14. How can I stay updated on further developments or reports in the Consumer Technical Support Services Market?
To stay informed about further developments, trends, and reports in the Consumer Technical Support Services Market, consider subscribing to industry newsletters, following relevant companies and organizations, or regularly checking reputable industry news sources and publications.
Methodology
Step 1 - Identification of Relevant Samples Size from Population Database


Step 2 - Approaches for Defining Global Market Size (Value, Volume* & Price*)

Note*: In applicable scenarios
Step 3 - Data Sources
Primary Research
- Web Analytics
- Survey Reports
- Research Institute
- Latest Research Reports
- Opinion Leaders
Secondary Research
- Annual Reports
- White Paper
- Latest Press Release
- Industry Association
- Paid Database
- Investor Presentations

Step 4 - Data Triangulation
Involves using different sources of information in order to increase the validity of a study
These sources are likely to be stakeholders in a program - participants, other researchers, program staff, other community members, and so on.
Then we put all data in single framework & apply various statistical tools to find out the dynamic on the market.
During the analysis stage, feedback from the stakeholder groups would be compared to determine areas of agreement as well as areas of divergence


