
Key Insights
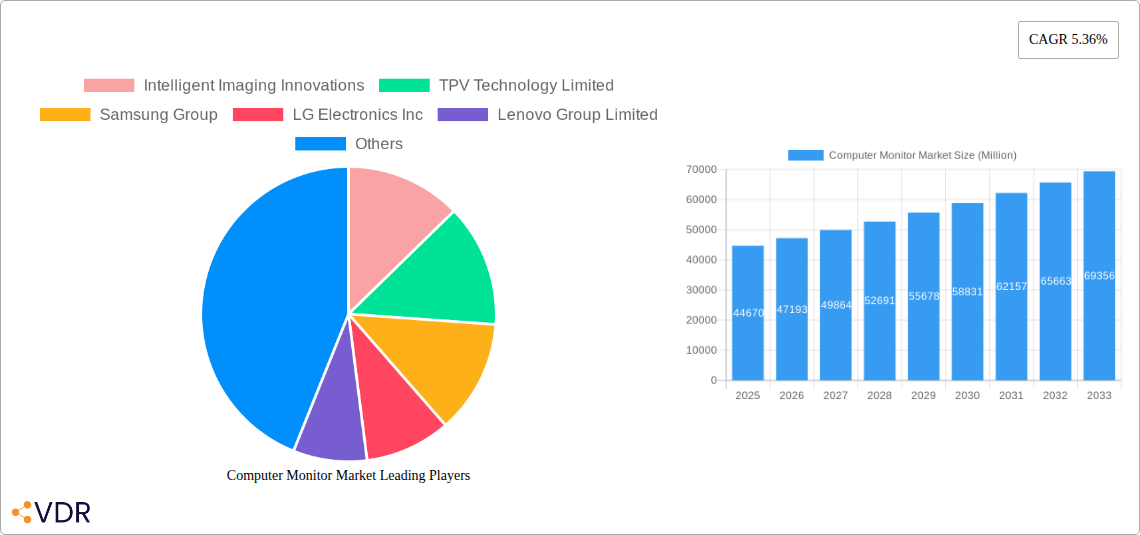
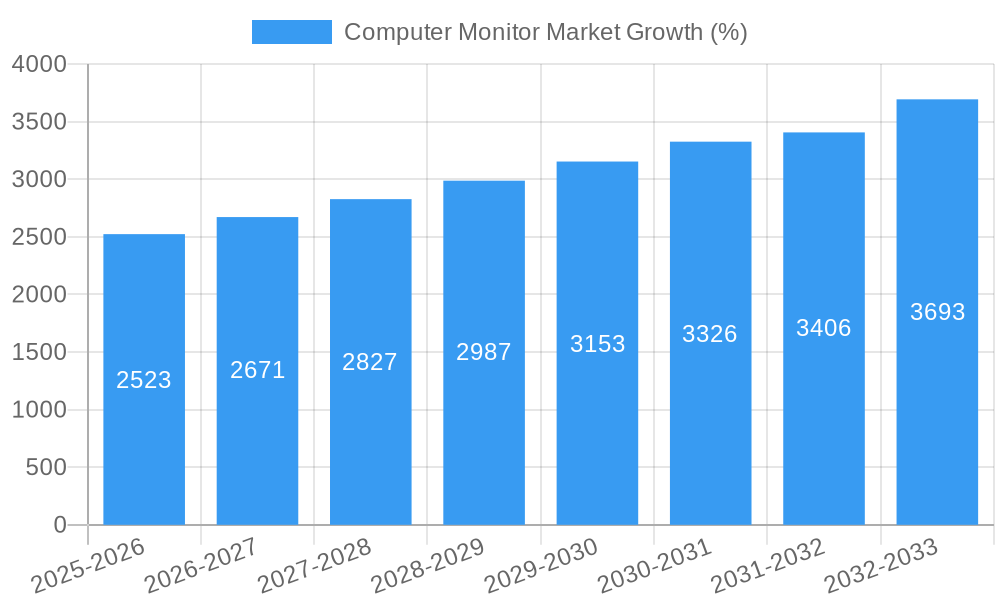
The computer monitor market, valued at $44.67 billion in 2025, is projected to experience robust growth, driven by several key factors. The increasing adoption of high-resolution displays, particularly in gaming and professional applications, fuels demand for larger screens with superior image quality. The shift towards remote work and hybrid work models has also significantly boosted sales, as individuals and businesses invest in ergonomic and high-performance monitors to enhance productivity. Technological advancements, such as the introduction of mini-LED and OLED displays offering improved contrast ratios and wider color gamuts, are further stimulating market expansion. Competition among major players like Samsung, LG, Dell, and HP continues to drive innovation and affordability, making high-quality monitors accessible to a broader consumer base. While potential restraints like fluctuating raw material prices and supply chain disruptions exist, the overall market outlook remains positive, with a Compound Annual Growth Rate (CAGR) of 5.36% projected through 2033. This growth is expected to be particularly pronounced in regions like Asia-Pacific, fueled by rising disposable incomes and increasing digitalization. Segmentation by resolution (1366x, 1920x, etc.) and application (consumer, commercial, gaming) reveals diverse market dynamics, with the higher-resolution segments and the gaming sector exhibiting faster growth rates.
The market's growth trajectory is influenced by several key trends. The increasing demand for curved monitors, offering enhanced viewing experiences and immersive gaming, is a notable trend. Furthermore, the integration of advanced features such as USB-C connectivity, built-in speakers, and adjustable stands contributes to the appeal of modern monitors. The rising popularity of ultrawide monitors, catering to professionals requiring expansive screen real estate, is also impacting market dynamics. Sustainable manufacturing practices and the incorporation of energy-efficient technologies are becoming increasingly important considerations for both manufacturers and consumers. The growing adoption of monitor technologies like mini-LED and OLED represents a significant area of future growth, promising superior picture quality and improved power efficiency. The ongoing technological advancements and diversified application segments collectively contribute to a healthy and continuously evolving computer monitor market.
Computer Monitor Market: A Comprehensive Report (2019-2033)
This in-depth report provides a comprehensive analysis of the Computer Monitor Market, encompassing market dynamics, growth trends, regional dominance, product landscape, and key players. With a study period spanning 2019-2033, a base year of 2025, and a forecast period of 2025-2033, this report offers invaluable insights for industry professionals, investors, and strategic decision-makers. The report covers the parent market of display devices and the child market of computer monitors, providing a granular view of this dynamic sector. Market size is presented in Million units.
Computer Monitor Market Dynamics & Structure
The computer monitor market is characterized by a moderately consolidated structure, with key players like Samsung, LG, Dell, and HP holding significant market share. Technological innovation, particularly in display technologies (e.g., OLED, mini-LED, quantum dot), is a major driver. Stringent regulatory frameworks concerning energy efficiency and e-waste management influence manufacturing practices. The rise of large-screen televisions and tablets presents competitive substitutes, while the increasing popularity of multi-monitor setups fuels demand. Market trends indicate a shift towards higher resolutions and larger screen sizes, driven by gaming and professional applications. M&A activity in the sector has been moderate in recent years, with xx major deals recorded between 2019 and 2024, resulting in a xx% change in market concentration.
- Market Concentration: Moderately consolidated, with top 5 players holding approximately xx% market share.
- Technological Innovation: Key drivers include OLED, mini-LED, and HDR technologies.
- Regulatory Framework: Focus on energy efficiency and e-waste management.
- Competitive Substitutes: Large-screen TVs and tablets.
- End-User Demographics: Growing demand from gamers, professionals, and home users.
- M&A Trends: Moderate activity, with xx major deals resulting in xx% change in market concentration (2019-2024).
Computer Monitor Market Growth Trends & Insights
The global computer monitor market exhibited a CAGR of xx% during the historical period (2019-2024), reaching a market size of xx Million units in 2024. Adoption rates are primarily influenced by technological advancements, economic conditions, and consumer preferences. The market is witnessing a significant shift towards higher-resolution displays (e.g., 4K, 8K), curved monitors, and ultra-wide screens. Technological disruptions, such as the integration of HDR and adaptive sync technologies, are further driving market growth. Consumer behavior shows a preference for larger screen sizes and enhanced visual fidelity, especially within the gaming and professional segments. The forecast period (2025-2033) projects a CAGR of xx%, driven by factors such as increasing adoption of advanced display technologies, rising disposable incomes, and growing demand for high-quality visuals across diverse applications. Market penetration is expected to increase from xx% in 2024 to xx% in 2033.
Dominant Regions, Countries, or Segments in Computer Monitor Market
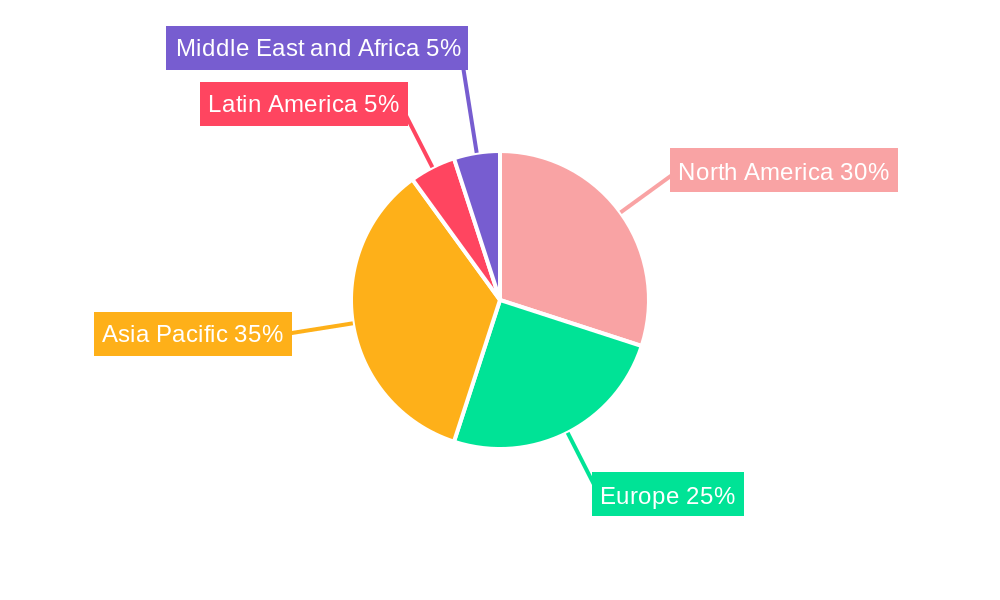
North America and Asia Pacific currently dominate the computer monitor market, holding a combined market share of approximately xx%. Within these regions, China and the United States are the leading countries, driven by robust electronics manufacturing and high consumer spending. In terms of segments, the 1920x1080 resolution segment holds the largest market share, followed by 1366x768 and other higher resolutions. The commercial application segment dominates, accounting for approximately xx% of the market, followed by the consumer and gaming segments.
- Key Drivers (North America): High disposable incomes, strong demand for high-resolution displays, and well-established retail infrastructure.
- Key Drivers (Asia Pacific): Rapid economic growth, expanding middle class, and increasing penetration of computers and gaming consoles.
- Dominant Resolution Segment: 1920x1080
- Dominant Application Segment: Commercial
Computer Monitor Market Product Landscape
The computer monitor market offers a diverse range of products with varying resolutions, screen sizes, panel technologies (TN, IPS, VA, OLED), and features like HDR, adaptive sync, and curved screens. Recent innovations include mini-LED backlighting for enhanced contrast and brightness, and high refresh rate displays (e.g., 240Hz, 360Hz) catering specifically to the gaming segment. These advancements offer unique selling propositions such as superior image quality, smoother gameplay, and improved response times, appealing to a broad range of consumers.
Key Drivers, Barriers & Challenges in Computer Monitor Market
Key Drivers: The increasing adoption of high-performance computing, growth in the gaming industry, demand for enhanced visual experiences in professional applications (e.g., graphic design, video editing), and the expanding work-from-home trend are primary drivers.
Key Challenges: Supply chain disruptions, fluctuating raw material prices, intense competition, and the increasing environmental concerns related to e-waste disposal present significant challenges. These factors can influence production costs and market profitability, impacting the overall growth trajectory. The projected impact of these challenges on market growth is a reduction of xx% in CAGR by 2033 if not addressed effectively.
Emerging Opportunities in Computer Monitor Market
Emerging opportunities lie in the growing adoption of foldable and rollable displays, the development of augmented reality (AR) and virtual reality (VR) compatible monitors, and the expansion into niche markets like medical imaging and industrial automation. Furthermore, there is a growing demand for sustainable and eco-friendly monitors, creating opportunities for manufacturers to adopt recycled materials and energy-efficient technologies.
Growth Accelerators in the Computer Monitor Market Industry
Technological advancements, strategic collaborations among manufacturers and component suppliers, and effective marketing strategies that highlight the enhanced visual experiences offered by advanced display technologies will accelerate long-term market growth. Expansion into emerging markets with growing internet penetration and increasing computer adoption will further contribute to market expansion.
Key Players Shaping the Computer Monitor Market Market
- Intelligent Imaging Innovations
- TPV Technology Limited
- Samsung Group
- LG Electronics Inc
- Lenovo Group Limited
- Acer Inc
- BenQ Corporation
- Hewlett-Packard Development Company LP
- HP Inc
- AsusTek Computer Inc
- Dell Technologies Inc
- ViewSonic Corporation Inc
- Apple Inc
Notable Milestones in Computer Monitor Market Sector
- January 2023: Dell Technologies launched new gaming laptops, monitors (including a 500Hz Alienware monitor with NVIDIA’s Reflex Latency Analyzer), and Aurora desktops at CES 2023. This significantly boosted the gaming monitor segment.
- January 2023: Samsung Electronics introduced new monitor models, including the Odyssey Neo G9, the world's first dual UHD single monitor, solidifying its position in the ultra-wide display market.
In-Depth Computer Monitor Market Market Outlook
The future of the computer monitor market is bright, driven by continuous technological advancements, increasing demand for visually immersive experiences, and the expanding applications across various industries. Strategic opportunities exist for companies that can effectively leverage innovations in display technologies, optimize supply chains, and cater to the evolving needs of diverse customer segments. The market is poised for significant growth in the coming years, fueled by the integration of advanced features and the expansion into untapped markets.
Computer Monitor Market Segmentation
-
1. Resolution
- 1.1. 1366x768
- 1.2. 1920x1080
- 1.3. 1536x864
- 1.4. 1440x900
- 1.5. 1280x720
- 1.6. Other Resolutions
-
2. Application
- 2.1. Consumer and Commercial
- 2.2. Gaming
Computer Monitor Market Segmentation By Geography
-
1. North America
- 1.1. United States
- 1.2. Canada
-
2. Europe
- 2.1. Germany
- 2.2. United Kingdom
- 2.3. France
- 2.4. Rest of Europe
-
3. Asia Pacific
- 3.1. India
- 3.2. China
- 3.3. Japan
- 3.4. Rest of Asia Pacific
-
4. Latin America
- 4.1. Brazil
- 4.2. Argentina
- 4.3. Mexico
- 4.4. Rest of Latin America
-
5. Middle East and Africa
- 5.1. United Arab Emirates
- 5.2. Saudi Arabia
- 5.3. Rest of Middle East and Africa
Computer Monitor Market REPORT HIGHLIGHTS
| Aspects | Details |
|---|---|
| Study Period | 2019-2033 |
| Base Year | 2024 |
| Estimated Year | 2025 |
| Forecast Period | 2025-2033 |
| Historical Period | 2019-2024 |
| Growth Rate | CAGR of 5.36% from 2019-2033 |
| Segmentation |
|
Table of Contents
- 1. Introduction
- 1.1. Research Scope
- 1.2. Market Segmentation
- 1.3. Research Methodology
- 1.4. Definitions and Assumptions
- 2. Executive Summary
- 2.1. Introduction
- 3. Market Dynamics
- 3.1. Introduction
- 3.2. Market Drivers
- 3.2.1. Growing Gaming Industry Across the Globe; Rising Demand for Advanced and Innovative Displays
- 3.3. Market Restrains
- 3.3.1. Use of Smartphones and Tables as a substitute to PCs
- 3.4. Market Trends
- 3.4.1. Gaming to Witness the Fastest Market Growth
- 4. Market Factor Analysis
- 4.1. Porters Five Forces
- 4.2. Supply/Value Chain
- 4.3. PESTEL analysis
- 4.4. Market Entropy
- 4.5. Patent/Trademark Analysis
- 5. Global Computer Monitor Market Analysis, Insights and Forecast, 2019-2031
- 5.1. Market Analysis, Insights and Forecast - by Resolution
- 5.1.1. 1366x768
- 5.1.2. 1920x1080
- 5.1.3. 1536x864
- 5.1.4. 1440x900
- 5.1.5. 1280x720
- 5.1.6. Other Resolutions
- 5.2. Market Analysis, Insights and Forecast - by Application
- 5.2.1. Consumer and Commercial
- 5.2.2. Gaming
- 5.3. Market Analysis, Insights and Forecast - by Region
- 5.3.1. North America
- 5.3.2. Europe
- 5.3.3. Asia Pacific
- 5.3.4. Latin America
- 5.3.5. Middle East and Africa
- 5.1. Market Analysis, Insights and Forecast - by Resolution
- 6. North America Computer Monitor Market Analysis, Insights and Forecast, 2019-2031
- 6.1. Market Analysis, Insights and Forecast - by Resolution
- 6.1.1. 1366x768
- 6.1.2. 1920x1080
- 6.1.3. 1536x864
- 6.1.4. 1440x900
- 6.1.5. 1280x720
- 6.1.6. Other Resolutions
- 6.2. Market Analysis, Insights and Forecast - by Application
- 6.2.1. Consumer and Commercial
- 6.2.2. Gaming
- 6.1. Market Analysis, Insights and Forecast - by Resolution
- 7. Europe Computer Monitor Market Analysis, Insights and Forecast, 2019-2031
- 7.1. Market Analysis, Insights and Forecast - by Resolution
- 7.1.1. 1366x768
- 7.1.2. 1920x1080
- 7.1.3. 1536x864
- 7.1.4. 1440x900
- 7.1.5. 1280x720
- 7.1.6. Other Resolutions
- 7.2. Market Analysis, Insights and Forecast - by Application
- 7.2.1. Consumer and Commercial
- 7.2.2. Gaming
- 7.1. Market Analysis, Insights and Forecast - by Resolution
- 8. Asia Pacific Computer Monitor Market Analysis, Insights and Forecast, 2019-2031
- 8.1. Market Analysis, Insights and Forecast - by Resolution
- 8.1.1. 1366x768
- 8.1.2. 1920x1080
- 8.1.3. 1536x864
- 8.1.4. 1440x900
- 8.1.5. 1280x720
- 8.1.6. Other Resolutions
- 8.2. Market Analysis, Insights and Forecast - by Application
- 8.2.1. Consumer and Commercial
- 8.2.2. Gaming
- 8.1. Market Analysis, Insights and Forecast - by Resolution
- 9. Latin America Computer Monitor Market Analysis, Insights and Forecast, 2019-2031
- 9.1. Market Analysis, Insights and Forecast - by Resolution
- 9.1.1. 1366x768
- 9.1.2. 1920x1080
- 9.1.3. 1536x864
- 9.1.4. 1440x900
- 9.1.5. 1280x720
- 9.1.6. Other Resolutions
- 9.2. Market Analysis, Insights and Forecast - by Application
- 9.2.1. Consumer and Commercial
- 9.2.2. Gaming
- 9.1. Market Analysis, Insights and Forecast - by Resolution
- 10. Middle East and Africa Computer Monitor Market Analysis, Insights and Forecast, 2019-2031
- 10.1. Market Analysis, Insights and Forecast - by Resolution
- 10.1.1. 1366x768
- 10.1.2. 1920x1080
- 10.1.3. 1536x864
- 10.1.4. 1440x900
- 10.1.5. 1280x720
- 10.1.6. Other Resolutions
- 10.2. Market Analysis, Insights and Forecast - by Application
- 10.2.1. Consumer and Commercial
- 10.2.2. Gaming
- 10.1. Market Analysis, Insights and Forecast - by Resolution
- 11. North America Computer Monitor Market Analysis, Insights and Forecast, 2019-2031
- 11.1. Market Analysis, Insights and Forecast - By Country/Sub-region
- 11.1.1 United States
- 11.1.2 Canada
- 12. Europe Computer Monitor Market Analysis, Insights and Forecast, 2019-2031
- 12.1. Market Analysis, Insights and Forecast - By Country/Sub-region
- 12.1.1 Germany
- 12.1.2 United Kingdom
- 12.1.3 France
- 12.1.4 Rest of Europe
- 13. Asia Pacific Computer Monitor Market Analysis, Insights and Forecast, 2019-2031
- 13.1. Market Analysis, Insights and Forecast - By Country/Sub-region
- 13.1.1 India
- 13.1.2 China
- 13.1.3 Japan
- 13.1.4 Rest of Asia Pacific
- 14. Latin America Computer Monitor Market Analysis, Insights and Forecast, 2019-2031
- 14.1. Market Analysis, Insights and Forecast - By Country/Sub-region
- 14.1.1 Brazil
- 14.1.2 Argentina
- 14.1.3 Mexico
- 14.1.4 Rest of Latin America
- 15. Middle East and Africa Computer Monitor Market Analysis, Insights and Forecast, 2019-2031
- 15.1. Market Analysis, Insights and Forecast - By Country/Sub-region
- 15.1.1 United Arab Emirates
- 15.1.2 Saudi Arabia
- 15.1.3 Rest of Middle East and Africa
- 16. Competitive Analysis
- 16.1. Global Market Share Analysis 2024
- 16.2. Company Profiles
- 16.2.1 Intelligent Imaging Innovations
- 16.2.1.1. Overview
- 16.2.1.2. Products
- 16.2.1.3. SWOT Analysis
- 16.2.1.4. Recent Developments
- 16.2.1.5. Financials (Based on Availability)
- 16.2.2 TPV Technology Limited
- 16.2.2.1. Overview
- 16.2.2.2. Products
- 16.2.2.3. SWOT Analysis
- 16.2.2.4. Recent Developments
- 16.2.2.5. Financials (Based on Availability)
- 16.2.3 Samsung Group
- 16.2.3.1. Overview
- 16.2.3.2. Products
- 16.2.3.3. SWOT Analysis
- 16.2.3.4. Recent Developments
- 16.2.3.5. Financials (Based on Availability)
- 16.2.4 LG Electronics Inc
- 16.2.4.1. Overview
- 16.2.4.2. Products
- 16.2.4.3. SWOT Analysis
- 16.2.4.4. Recent Developments
- 16.2.4.5. Financials (Based on Availability)
- 16.2.5 Lenovo Group Limited
- 16.2.5.1. Overview
- 16.2.5.2. Products
- 16.2.5.3. SWOT Analysis
- 16.2.5.4. Recent Developments
- 16.2.5.5. Financials (Based on Availability)
- 16.2.6 Acer Inc
- 16.2.6.1. Overview
- 16.2.6.2. Products
- 16.2.6.3. SWOT Analysis
- 16.2.6.4. Recent Developments
- 16.2.6.5. Financials (Based on Availability)
- 16.2.7 BenQ Corporation
- 16.2.7.1. Overview
- 16.2.7.2. Products
- 16.2.7.3. SWOT Analysis
- 16.2.7.4. Recent Developments
- 16.2.7.5. Financials (Based on Availability)
- 16.2.8 Hewlett-Packard Development Company LP
- 16.2.8.1. Overview
- 16.2.8.2. Products
- 16.2.8.3. SWOT Analysis
- 16.2.8.4. Recent Developments
- 16.2.8.5. Financials (Based on Availability)
- 16.2.9 HP Inc
- 16.2.9.1. Overview
- 16.2.9.2. Products
- 16.2.9.3. SWOT Analysis
- 16.2.9.4. Recent Developments
- 16.2.9.5. Financials (Based on Availability)
- 16.2.10 AsusTek Computer Inc
- 16.2.10.1. Overview
- 16.2.10.2. Products
- 16.2.10.3. SWOT Analysis
- 16.2.10.4. Recent Developments
- 16.2.10.5. Financials (Based on Availability)
- 16.2.11 Dell Technologies Inc
- 16.2.11.1. Overview
- 16.2.11.2. Products
- 16.2.11.3. SWOT Analysis
- 16.2.11.4. Recent Developments
- 16.2.11.5. Financials (Based on Availability)
- 16.2.12 ViewSonic Corporation Inc
- 16.2.12.1. Overview
- 16.2.12.2. Products
- 16.2.12.3. SWOT Analysis
- 16.2.12.4. Recent Developments
- 16.2.12.5. Financials (Based on Availability)
- 16.2.13 Apple Inc
- 16.2.13.1. Overview
- 16.2.13.2. Products
- 16.2.13.3. SWOT Analysis
- 16.2.13.4. Recent Developments
- 16.2.13.5. Financials (Based on Availability)
- 16.2.1 Intelligent Imaging Innovations
List of Figures
- Figure 1: Global Computer Monitor Market Revenue Breakdown (Million, %) by Region 2024 & 2032
- Figure 2: North America Computer Monitor Market Revenue (Million), by Country 2024 & 2032
- Figure 3: North America Computer Monitor Market Revenue Share (%), by Country 2024 & 2032
- Figure 4: Europe Computer Monitor Market Revenue (Million), by Country 2024 & 2032
- Figure 5: Europe Computer Monitor Market Revenue Share (%), by Country 2024 & 2032
- Figure 6: Asia Pacific Computer Monitor Market Revenue (Million), by Country 2024 & 2032
- Figure 7: Asia Pacific Computer Monitor Market Revenue Share (%), by Country 2024 & 2032
- Figure 8: Latin America Computer Monitor Market Revenue (Million), by Country 2024 & 2032
- Figure 9: Latin America Computer Monitor Market Revenue Share (%), by Country 2024 & 2032
- Figure 10: Middle East and Africa Computer Monitor Market Revenue (Million), by Country 2024 & 2032
- Figure 11: Middle East and Africa Computer Monitor Market Revenue Share (%), by Country 2024 & 2032
- Figure 12: North America Computer Monitor Market Revenue (Million), by Resolution 2024 & 2032
- Figure 13: North America Computer Monitor Market Revenue Share (%), by Resolution 2024 & 2032
- Figure 14: North America Computer Monitor Market Revenue (Million), by Application 2024 & 2032
- Figure 15: North America Computer Monitor Market Revenue Share (%), by Application 2024 & 2032
- Figure 16: North America Computer Monitor Market Revenue (Million), by Country 2024 & 2032
- Figure 17: North America Computer Monitor Market Revenue Share (%), by Country 2024 & 2032
- Figure 18: Europe Computer Monitor Market Revenue (Million), by Resolution 2024 & 2032
- Figure 19: Europe Computer Monitor Market Revenue Share (%), by Resolution 2024 & 2032
- Figure 20: Europe Computer Monitor Market Revenue (Million), by Application 2024 & 2032
- Figure 21: Europe Computer Monitor Market Revenue Share (%), by Application 2024 & 2032
- Figure 22: Europe Computer Monitor Market Revenue (Million), by Country 2024 & 2032
- Figure 23: Europe Computer Monitor Market Revenue Share (%), by Country 2024 & 2032
- Figure 24: Asia Pacific Computer Monitor Market Revenue (Million), by Resolution 2024 & 2032
- Figure 25: Asia Pacific Computer Monitor Market Revenue Share (%), by Resolution 2024 & 2032
- Figure 26: Asia Pacific Computer Monitor Market Revenue (Million), by Application 2024 & 2032
- Figure 27: Asia Pacific Computer Monitor Market Revenue Share (%), by Application 2024 & 2032
- Figure 28: Asia Pacific Computer Monitor Market Revenue (Million), by Country 2024 & 2032
- Figure 29: Asia Pacific Computer Monitor Market Revenue Share (%), by Country 2024 & 2032
- Figure 30: Latin America Computer Monitor Market Revenue (Million), by Resolution 2024 & 2032
- Figure 31: Latin America Computer Monitor Market Revenue Share (%), by Resolution 2024 & 2032
- Figure 32: Latin America Computer Monitor Market Revenue (Million), by Application 2024 & 2032
- Figure 33: Latin America Computer Monitor Market Revenue Share (%), by Application 2024 & 2032
- Figure 34: Latin America Computer Monitor Market Revenue (Million), by Country 2024 & 2032
- Figure 35: Latin America Computer Monitor Market Revenue Share (%), by Country 2024 & 2032
- Figure 36: Middle East and Africa Computer Monitor Market Revenue (Million), by Resolution 2024 & 2032
- Figure 37: Middle East and Africa Computer Monitor Market Revenue Share (%), by Resolution 2024 & 2032
- Figure 38: Middle East and Africa Computer Monitor Market Revenue (Million), by Application 2024 & 2032
- Figure 39: Middle East and Africa Computer Monitor Market Revenue Share (%), by Application 2024 & 2032
- Figure 40: Middle East and Africa Computer Monitor Market Revenue (Million), by Country 2024 & 2032
- Figure 41: Middle East and Africa Computer Monitor Market Revenue Share (%), by Country 2024 & 2032
List of Tables
- Table 1: Global Computer Monitor Market Revenue Million Forecast, by Region 2019 & 2032
- Table 2: Global Computer Monitor Market Revenue Million Forecast, by Resolution 2019 & 2032
- Table 3: Global Computer Monitor Market Revenue Million Forecast, by Application 2019 & 2032
- Table 4: Global Computer Monitor Market Revenue Million Forecast, by Region 2019 & 2032
- Table 5: Global Computer Monitor Market Revenue Million Forecast, by Country 2019 & 2032
- Table 6: United States Computer Monitor Market Revenue (Million) Forecast, by Application 2019 & 2032
- Table 7: Canada Computer Monitor Market Revenue (Million) Forecast, by Application 2019 & 2032
- Table 8: Global Computer Monitor Market Revenue Million Forecast, by Country 2019 & 2032
- Table 9: Germany Computer Monitor Market Revenue (Million) Forecast, by Application 2019 & 2032
- Table 10: United Kingdom Computer Monitor Market Revenue (Million) Forecast, by Application 2019 & 2032
- Table 11: France Computer Monitor Market Revenue (Million) Forecast, by Application 2019 & 2032
- Table 12: Rest of Europe Computer Monitor Market Revenue (Million) Forecast, by Application 2019 & 2032
- Table 13: Global Computer Monitor Market Revenue Million Forecast, by Country 2019 & 2032
- Table 14: India Computer Monitor Market Revenue (Million) Forecast, by Application 2019 & 2032
- Table 15: China Computer Monitor Market Revenue (Million) Forecast, by Application 2019 & 2032
- Table 16: Japan Computer Monitor Market Revenue (Million) Forecast, by Application 2019 & 2032
- Table 17: Rest of Asia Pacific Computer Monitor Market Revenue (Million) Forecast, by Application 2019 & 2032
- Table 18: Global Computer Monitor Market Revenue Million Forecast, by Country 2019 & 2032
- Table 19: Brazil Computer Monitor Market Revenue (Million) Forecast, by Application 2019 & 2032
- Table 20: Argentina Computer Monitor Market Revenue (Million) Forecast, by Application 2019 & 2032
- Table 21: Mexico Computer Monitor Market Revenue (Million) Forecast, by Application 2019 & 2032
- Table 22: Rest of Latin America Computer Monitor Market Revenue (Million) Forecast, by Application 2019 & 2032
- Table 23: Global Computer Monitor Market Revenue Million Forecast, by Country 2019 & 2032
- Table 24: United Arab Emirates Computer Monitor Market Revenue (Million) Forecast, by Application 2019 & 2032
- Table 25: Saudi Arabia Computer Monitor Market Revenue (Million) Forecast, by Application 2019 & 2032
- Table 26: Rest of Middle East and Africa Computer Monitor Market Revenue (Million) Forecast, by Application 2019 & 2032
- Table 27: Global Computer Monitor Market Revenue Million Forecast, by Resolution 2019 & 2032
- Table 28: Global Computer Monitor Market Revenue Million Forecast, by Application 2019 & 2032
- Table 29: Global Computer Monitor Market Revenue Million Forecast, by Country 2019 & 2032
- Table 30: United States Computer Monitor Market Revenue (Million) Forecast, by Application 2019 & 2032
- Table 31: Canada Computer Monitor Market Revenue (Million) Forecast, by Application 2019 & 2032
- Table 32: Global Computer Monitor Market Revenue Million Forecast, by Resolution 2019 & 2032
- Table 33: Global Computer Monitor Market Revenue Million Forecast, by Application 2019 & 2032
- Table 34: Global Computer Monitor Market Revenue Million Forecast, by Country 2019 & 2032
- Table 35: Germany Computer Monitor Market Revenue (Million) Forecast, by Application 2019 & 2032
- Table 36: United Kingdom Computer Monitor Market Revenue (Million) Forecast, by Application 2019 & 2032
- Table 37: France Computer Monitor Market Revenue (Million) Forecast, by Application 2019 & 2032
- Table 38: Rest of Europe Computer Monitor Market Revenue (Million) Forecast, by Application 2019 & 2032
- Table 39: Global Computer Monitor Market Revenue Million Forecast, by Resolution 2019 & 2032
- Table 40: Global Computer Monitor Market Revenue Million Forecast, by Application 2019 & 2032
- Table 41: Global Computer Monitor Market Revenue Million Forecast, by Country 2019 & 2032
- Table 42: India Computer Monitor Market Revenue (Million) Forecast, by Application 2019 & 2032
- Table 43: China Computer Monitor Market Revenue (Million) Forecast, by Application 2019 & 2032
- Table 44: Japan Computer Monitor Market Revenue (Million) Forecast, by Application 2019 & 2032
- Table 45: Rest of Asia Pacific Computer Monitor Market Revenue (Million) Forecast, by Application 2019 & 2032
- Table 46: Global Computer Monitor Market Revenue Million Forecast, by Resolution 2019 & 2032
- Table 47: Global Computer Monitor Market Revenue Million Forecast, by Application 2019 & 2032
- Table 48: Global Computer Monitor Market Revenue Million Forecast, by Country 2019 & 2032
- Table 49: Brazil Computer Monitor Market Revenue (Million) Forecast, by Application 2019 & 2032
- Table 50: Argentina Computer Monitor Market Revenue (Million) Forecast, by Application 2019 & 2032
- Table 51: Mexico Computer Monitor Market Revenue (Million) Forecast, by Application 2019 & 2032
- Table 52: Rest of Latin America Computer Monitor Market Revenue (Million) Forecast, by Application 2019 & 2032
- Table 53: Global Computer Monitor Market Revenue Million Forecast, by Resolution 2019 & 2032
- Table 54: Global Computer Monitor Market Revenue Million Forecast, by Application 2019 & 2032
- Table 55: Global Computer Monitor Market Revenue Million Forecast, by Country 2019 & 2032
- Table 56: United Arab Emirates Computer Monitor Market Revenue (Million) Forecast, by Application 2019 & 2032
- Table 57: Saudi Arabia Computer Monitor Market Revenue (Million) Forecast, by Application 2019 & 2032
- Table 58: Rest of Middle East and Africa Computer Monitor Market Revenue (Million) Forecast, by Application 2019 & 2032
Frequently Asked Questions
1. What is the projected Compound Annual Growth Rate (CAGR) of the Computer Monitor Market?
The projected CAGR is approximately 5.36%.
2. Which companies are prominent players in the Computer Monitor Market?
Key companies in the market include Intelligent Imaging Innovations, TPV Technology Limited, Samsung Group, LG Electronics Inc, Lenovo Group Limited, Acer Inc, BenQ Corporation, Hewlett-Packard Development Company LP, HP Inc, AsusTek Computer Inc, Dell Technologies Inc, ViewSonic Corporation Inc, Apple Inc.
3. What are the main segments of the Computer Monitor Market?
The market segments include Resolution, Application.
4. Can you provide details about the market size?
The market size is estimated to be USD 44.67 Million as of 2022.
5. What are some drivers contributing to market growth?
Growing Gaming Industry Across the Globe; Rising Demand for Advanced and Innovative Displays.
6. What are the notable trends driving market growth?
Gaming to Witness the Fastest Market Growth.
7. Are there any restraints impacting market growth?
Use of Smartphones and Tables as a substitute to PCs.
8. Can you provide examples of recent developments in the market?
January 2023: Dell Technologies announced launching new gaming laptops, monitors, Aurora desktops, and more at the Consumer Electronics Show (CES) 2023. The company revealed six gaming laptops, four under Alienware and two under Dell. It has introduced a 500Hz gaming monitor under Alienware. Furthermore, the monitor features NVIDIA’s Reflex Latency Analyzer technology to ensure the lowest possible latency.
9. What pricing options are available for accessing the report?
Pricing options include single-user, multi-user, and enterprise licenses priced at USD 4750, USD 5250, and USD 8750 respectively.
10. Is the market size provided in terms of value or volume?
The market size is provided in terms of value, measured in Million.
11. Are there any specific market keywords associated with the report?
Yes, the market keyword associated with the report is "Computer Monitor Market," which aids in identifying and referencing the specific market segment covered.
12. How do I determine which pricing option suits my needs best?
The pricing options vary based on user requirements and access needs. Individual users may opt for single-user licenses, while businesses requiring broader access may choose multi-user or enterprise licenses for cost-effective access to the report.
13. Are there any additional resources or data provided in the Computer Monitor Market report?
While the report offers comprehensive insights, it's advisable to review the specific contents or supplementary materials provided to ascertain if additional resources or data are available.
14. How can I stay updated on further developments or reports in the Computer Monitor Market?
To stay informed about further developments, trends, and reports in the Computer Monitor Market, consider subscribing to industry newsletters, following relevant companies and organizations, or regularly checking reputable industry news sources and publications.
Methodology
Step 1 - Identification of Relevant Samples Size from Population Database


Step 2 - Approaches for Defining Global Market Size (Value, Volume* & Price*)

Note*: In applicable scenarios
Step 3 - Data Sources
Primary Research
- Web Analytics
- Survey Reports
- Research Institute
- Latest Research Reports
- Opinion Leaders
Secondary Research
- Annual Reports
- White Paper
- Latest Press Release
- Industry Association
- Paid Database
- Investor Presentations

Step 4 - Data Triangulation
Involves using different sources of information in order to increase the validity of a study
These sources are likely to be stakeholders in a program - participants, other researchers, program staff, other community members, and so on.
Then we put all data in single framework & apply various statistical tools to find out the dynamic on the market.
During the analysis stage, feedback from the stakeholder groups would be compared to determine areas of agreement as well as areas of divergence


