
Key Insights
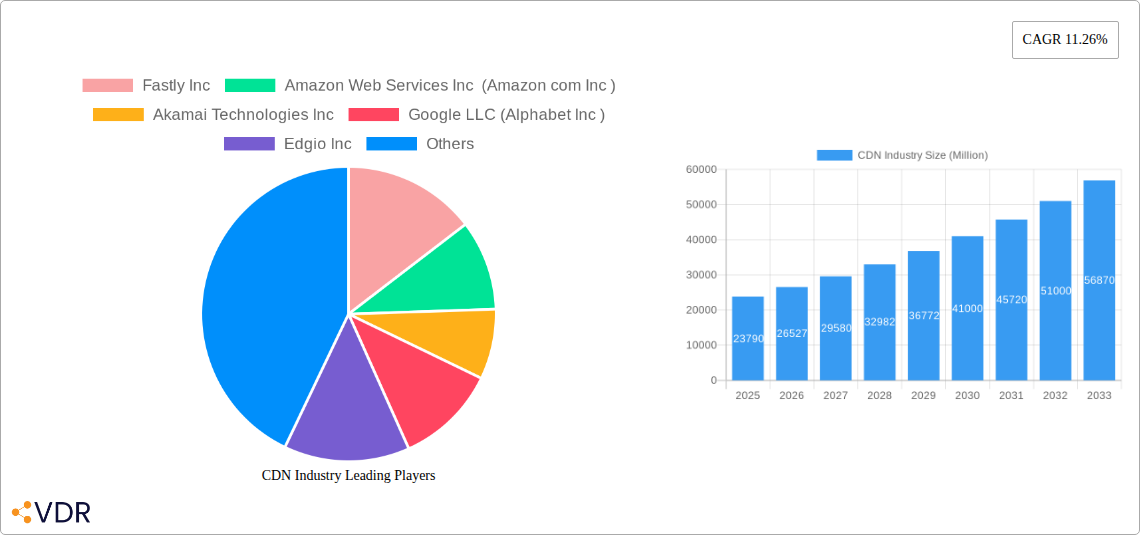
The Content Delivery Network (CDN) industry is experiencing robust growth, projected to reach a market size of $23.79 billion in 2025, expanding at a Compound Annual Growth Rate (CAGR) of 11.26%. This expansion is fueled by several key drivers. The increasing adoption of cloud computing and the surge in video streaming and online gaming are significantly boosting CDN demand. Businesses across various sectors, including media and entertainment, e-commerce, and healthcare, are increasingly relying on CDNs to enhance website performance, improve user experience, and ensure content security. Furthermore, the proliferation of 5G and the Internet of Things (IoT) is further accelerating market growth by generating substantial volumes of data requiring efficient and secure distribution. The market is segmented by solution and service (Media Delivery, Cloud Security, Web Performance) and end-user (Media & Entertainment, Advertising, E-commerce, Healthcare, Business & Financial Services, Research & Education). Competition is fierce, with major players like Fastly, Amazon Web Services, Akamai, Google Cloud, and Cloudflare vying for market share through innovative solutions and strategic partnerships. Geographic expansion, particularly in emerging markets in Asia-Pacific and South America, presents significant opportunities for growth. However, challenges remain, including the need for robust cybersecurity measures to mitigate potential threats and the complexities of managing global CDN infrastructure.
Looking ahead to 2033, the CDN market is poised for continued expansion. The ongoing digital transformation across industries, coupled with advancements in technologies such as edge computing and artificial intelligence (AI), will further drive demand. The increasing reliance on cloud-based services and the expansion of the global internet infrastructure will create opportunities for growth in both established and emerging markets. The competitive landscape is expected to remain dynamic, with companies focusing on providing differentiated solutions and services to cater to the evolving needs of their customers. Strategic mergers and acquisitions, coupled with continuous technological innovation, are likely to shape the industry’s future trajectory. The development of new technologies and standards will be critical for optimizing CDN performance and ensuring security against emerging threats, ensuring the continuous evolution and expansion of this vital sector of the digital economy.
CDN Industry Market Report: 2019-2033
This comprehensive report provides an in-depth analysis of the CDN (Content Delivery Network) industry, covering market dynamics, growth trends, competitive landscape, and future outlook. The study period spans from 2019 to 2033, with 2025 serving as the base and estimated year. The report segments the market by solution and service (Media Delivery, Cloud Security, Web Performance) and end-user (Media and Entertainment, Advertising, E-commerce, Healthcare, Business and Financial Services, Research and Education, Other End Users), offering granular insights into key growth drivers and challenges. The report values are presented in millions of units.
CDN Industry Market Dynamics & Structure
The CDN industry is characterized by a dynamic interplay of technological innovation, intense competition, and evolving regulatory landscapes. Market concentration is moderate, with a few major players holding significant market share, but numerous smaller players also competing for a slice of the pie. The industry is experiencing rapid technological advancements, driven by the increasing demand for faster, more secure, and reliable content delivery. Regulatory frameworks vary across regions, impacting the deployment and operation of CDN infrastructure. The existence of competitive product substitutes, such as decentralized content delivery systems, presents ongoing challenges. The parent market is the broader IT infrastructure and cloud services market, while the child market is specifically the content delivery and web performance optimization space.
- Market Concentration: Moderate, with top 5 players holding approximately xx% of the market share in 2024 (estimated).
- Technological Innovation Drivers: Increased adoption of edge computing, 5G networks, and AI-powered optimization techniques.
- Regulatory Frameworks: Vary significantly across geographies, impacting data localization and security compliance.
- Competitive Product Substitutes: Decentralized content delivery networks and peer-to-peer content sharing systems.
- End-User Demographics: Growing reliance on digital content across all sectors, fueling demand for robust and scalable CDN solutions.
- M&A Trends: A moderate number of M&A deals (xx in 2024) observed primarily focused on expanding geographic reach and enhancing service offerings. Larger players are acquiring smaller firms to improve their technology or to gain access to new markets.
CDN Industry Growth Trends & Insights
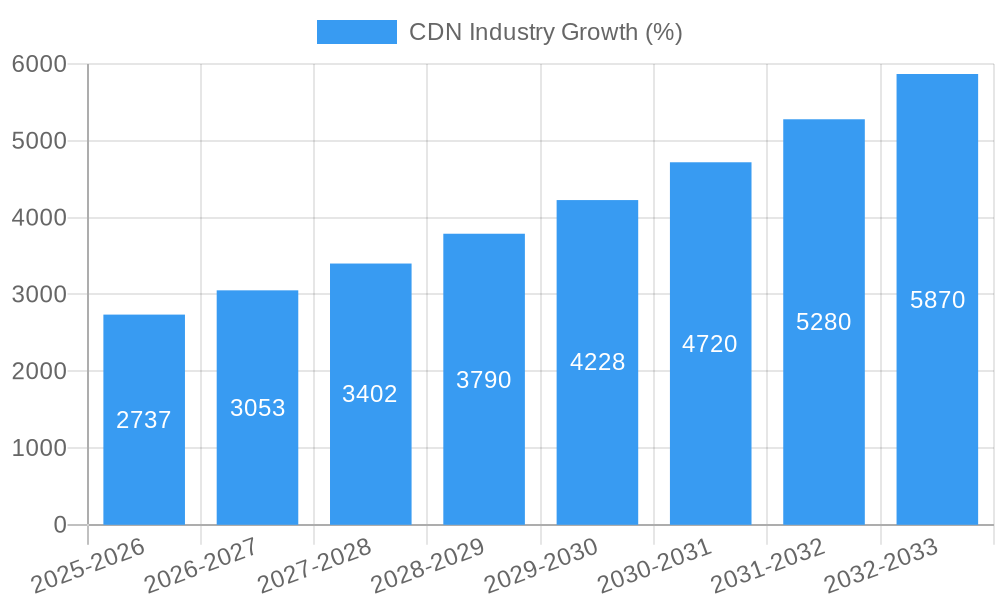
The CDN market has witnessed robust growth over the past few years and is projected to maintain a healthy Compound Annual Growth Rate (CAGR) of xx% during the forecast period (2025-2033). This growth is fueled by the surging demand for high-quality streaming video, cloud-based applications, and e-commerce platforms. Increased adoption rates across various end-user segments, particularly in media and entertainment, have significantly contributed to market expansion. Technological disruptions, such as the rise of edge computing and 5G, are further driving innovation and enhancing CDN capabilities. Consumer behavior shifts towards online video consumption and mobile-first experiences are contributing to this growth. Market penetration in developing economies is expected to increase significantly, driving further expansion.
Dominant Regions, Countries, or Segments in CDN Industry
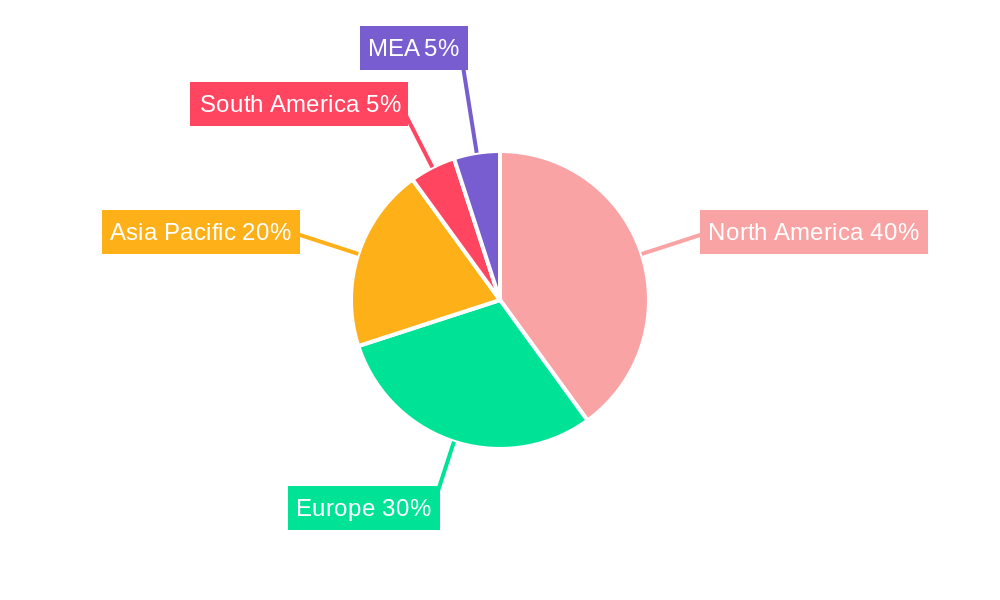
North America currently dominates the CDN market, driven by robust technological infrastructure, high internet penetration, and the presence of major technology companies. However, the Asia-Pacific region is projected to experience the fastest growth rate during the forecast period, fueled by rapid digital transformation and increasing internet usage. Within the segments, Media Delivery currently holds the largest market share, but Cloud Security is exhibiting the fastest growth due to the rising concerns about data security and cyber threats.
- Key Drivers in North America: Established technological infrastructure, high internet penetration, and a strong presence of major CDN providers.
- Key Drivers in Asia-Pacific: Rapid digital transformation, increasing internet penetration, and strong growth in e-commerce and mobile usage.
- Dominant Segments: Media Delivery (xx% market share in 2024) and Cloud Security (experiencing xx% CAGR).
- Market Share: North America holds approximately xx% of the global market share in 2024 (estimated), while Asia-Pacific holds approximately xx% and is projected to reach xx% by 2033.
CDN Industry Product Landscape
The CDN industry offers a diverse range of solutions, from basic content caching and delivery services to sophisticated security and performance optimization tools. Recent innovations include AI-powered traffic routing, serverless architectures, and enhanced security features like DDoS mitigation. These advancements enhance the efficiency, reliability, and security of content delivery, making CDNs more attractive to businesses of all sizes. Key performance metrics include latency, uptime, and bandwidth capacity. Unique selling propositions often include geographical reach, customized service level agreements, and specialized security solutions.
Key Drivers, Barriers & Challenges in CDN Industry
Key Drivers:
- The growing adoption of cloud-based applications and services.
- The increasing demand for high-quality streaming video and online gaming.
- The rising need for enhanced security and protection against cyber threats.
Key Challenges and Restraints:
- High initial infrastructure costs.
- Ensuring data security and privacy across diverse jurisdictions.
- Intense competition among numerous CDN providers with varying pricing and service strategies.
Emerging Opportunities in CDN Industry
- Expansion into untapped markets such as developing economies with burgeoning internet penetration.
- Development of specialized CDN solutions for specific applications like Internet of Things (IoT) and edge computing.
- Growing demand for CDN solutions in the areas of artificial intelligence and machine learning.
Growth Accelerators in the CDN Industry
Technological advancements, such as edge computing and 5G, will play a significant role in driving long-term growth. Strategic partnerships between CDN providers and other technology companies will also fuel market expansion. Moreover, the increasing adoption of CDN services by businesses of all sizes will contribute to significant market growth in the coming years.
Key Players Shaping the CDN Industry Market
- Fastly Inc
- Amazon Web Services Inc (Amazon com Inc )
- Akamai Technologies Inc
- Google LLC (Alphabet Inc )
- Edgio Inc
- Microsoft Corporation
- Cloudflare Inc
- Tata Communications Limite
- AT&T Inc
- CDNetworks Inc
Notable Milestones in CDN Industry Sector
- September 2023: Edgio announced a strategic partnership with Accedo, Bitmovin, Grabyo, and Vimond to enhance OTT video delivery capabilities. This significantly impacts the media and entertainment sector by improving streaming efficiency and reducing costs.
- August 2023: Nexcess launched an integrated CDN powered by Cloudflare, offered free to its fully managed hosting customers. This expands Cloudflare's reach in the B2B market, fostering further growth.
In-Depth CDN Industry Market Outlook
The CDN market is poised for substantial growth, driven by escalating demand for high-bandwidth, low-latency content delivery across various sectors. The ongoing technological advancements and strategic partnerships will further amplify this growth trajectory, creating lucrative opportunities for established players and new entrants alike. The focus on security, edge computing, and personalized content delivery solutions will be crucial in driving future success within this dynamic market.
CDN Industry Segmentation
-
1. Offering
-
1.1. Solutions
- 1.1.1. Media Delivery
- 1.1.2. Cloud Security
- 1.1.3. Web Performance
-
1.2. Services
- 1.2.1. Content Delivery
- 1.2.2. Cloud Security
- 1.2.3. Web Performance
-
1.1. Solutions
-
2. End User
- 2.1. Media and Entertainment
- 2.2. Advertising
- 2.3. E-commerce
- 2.4. Healthcare
- 2.5. Business and Financial Services
- 2.6. Research and Education
- 2.7. Other End Users
CDN Industry Segmentation By Geography
-
1. North America
- 1.1. United States
- 1.2. Canada
-
2. Europe
- 2.1. Germany
- 2.2. United Kingdom
- 2.3. France
- 2.4. Rest of Europe
-
3. Asia Pacific
- 3.1. China
- 3.2. Japan
- 3.3. India
- 3.4. South Korea
- 3.5. Rest of Asia Pacific
-
4. Latin America
- 4.1. Brazil
- 4.2. Mexico
- 4.3. Rest of Latin America
-
5. Middle East and Africa
- 5.1. United Arab Emirates
- 5.2. South Africa
- 5.3. Saudi Arabia
- 5.4. Rest of Middle East
CDN Industry REPORT HIGHLIGHTS
| Aspects | Details |
|---|---|
| Study Period | 2019-2033 |
| Base Year | 2024 |
| Estimated Year | 2025 |
| Forecast Period | 2025-2033 |
| Historical Period | 2019-2024 |
| Growth Rate | CAGR of 11.26% from 2019-2033 |
| Segmentation |
|
Table of Contents
- 1. Introduction
- 1.1. Research Scope
- 1.2. Market Segmentation
- 1.3. Research Methodology
- 1.4. Definitions and Assumptions
- 2. Executive Summary
- 2.1. Introduction
- 3. Market Dynamics
- 3.1. Introduction
- 3.2. Market Drivers
- 3.2.1 Increasing Online Users
- 3.2.2 Per Capita Online Consumption
- 3.2.3 and Demand for High -quality Video Content� Drives Growth; Growing Demand from Online Gaming Industries Adding to Market Growth
- 3.3. Market Restrains
- 3.3.1. Larger Organizations Tending to Build their Own CDNS; Bandwidth Concerns Particularly in Developing and Undeveloped Economies
- 3.4. Market Trends
- 3.4.1. Media and Entertainment (M&E) segment to Witness Major Growth
- 4. Market Factor Analysis
- 4.1. Porters Five Forces
- 4.2. Supply/Value Chain
- 4.3. PESTEL analysis
- 4.4. Market Entropy
- 4.5. Patent/Trademark Analysis
- 5. Global CDN Industry Analysis, Insights and Forecast, 2019-2031
- 5.1. Market Analysis, Insights and Forecast - by Offering
- 5.1.1. Solutions
- 5.1.1.1. Media Delivery
- 5.1.1.2. Cloud Security
- 5.1.1.3. Web Performance
- 5.1.2. Services
- 5.1.2.1. Content Delivery
- 5.1.2.2. Cloud Security
- 5.1.2.3. Web Performance
- 5.1.1. Solutions
- 5.2. Market Analysis, Insights and Forecast - by End User
- 5.2.1. Media and Entertainment
- 5.2.2. Advertising
- 5.2.3. E-commerce
- 5.2.4. Healthcare
- 5.2.5. Business and Financial Services
- 5.2.6. Research and Education
- 5.2.7. Other End Users
- 5.3. Market Analysis, Insights and Forecast - by Region
- 5.3.1. North America
- 5.3.2. Europe
- 5.3.3. Asia Pacific
- 5.3.4. Latin America
- 5.3.5. Middle East and Africa
- 5.1. Market Analysis, Insights and Forecast - by Offering
- 6. North America CDN Industry Analysis, Insights and Forecast, 2019-2031
- 6.1. Market Analysis, Insights and Forecast - by Offering
- 6.1.1. Solutions
- 6.1.1.1. Media Delivery
- 6.1.1.2. Cloud Security
- 6.1.1.3. Web Performance
- 6.1.2. Services
- 6.1.2.1. Content Delivery
- 6.1.2.2. Cloud Security
- 6.1.2.3. Web Performance
- 6.1.1. Solutions
- 6.2. Market Analysis, Insights and Forecast - by End User
- 6.2.1. Media and Entertainment
- 6.2.2. Advertising
- 6.2.3. E-commerce
- 6.2.4. Healthcare
- 6.2.5. Business and Financial Services
- 6.2.6. Research and Education
- 6.2.7. Other End Users
- 6.1. Market Analysis, Insights and Forecast - by Offering
- 7. Europe CDN Industry Analysis, Insights and Forecast, 2019-2031
- 7.1. Market Analysis, Insights and Forecast - by Offering
- 7.1.1. Solutions
- 7.1.1.1. Media Delivery
- 7.1.1.2. Cloud Security
- 7.1.1.3. Web Performance
- 7.1.2. Services
- 7.1.2.1. Content Delivery
- 7.1.2.2. Cloud Security
- 7.1.2.3. Web Performance
- 7.1.1. Solutions
- 7.2. Market Analysis, Insights and Forecast - by End User
- 7.2.1. Media and Entertainment
- 7.2.2. Advertising
- 7.2.3. E-commerce
- 7.2.4. Healthcare
- 7.2.5. Business and Financial Services
- 7.2.6. Research and Education
- 7.2.7. Other End Users
- 7.1. Market Analysis, Insights and Forecast - by Offering
- 8. Asia Pacific CDN Industry Analysis, Insights and Forecast, 2019-2031
- 8.1. Market Analysis, Insights and Forecast - by Offering
- 8.1.1. Solutions
- 8.1.1.1. Media Delivery
- 8.1.1.2. Cloud Security
- 8.1.1.3. Web Performance
- 8.1.2. Services
- 8.1.2.1. Content Delivery
- 8.1.2.2. Cloud Security
- 8.1.2.3. Web Performance
- 8.1.1. Solutions
- 8.2. Market Analysis, Insights and Forecast - by End User
- 8.2.1. Media and Entertainment
- 8.2.2. Advertising
- 8.2.3. E-commerce
- 8.2.4. Healthcare
- 8.2.5. Business and Financial Services
- 8.2.6. Research and Education
- 8.2.7. Other End Users
- 8.1. Market Analysis, Insights and Forecast - by Offering
- 9. Latin America CDN Industry Analysis, Insights and Forecast, 2019-2031
- 9.1. Market Analysis, Insights and Forecast - by Offering
- 9.1.1. Solutions
- 9.1.1.1. Media Delivery
- 9.1.1.2. Cloud Security
- 9.1.1.3. Web Performance
- 9.1.2. Services
- 9.1.2.1. Content Delivery
- 9.1.2.2. Cloud Security
- 9.1.2.3. Web Performance
- 9.1.1. Solutions
- 9.2. Market Analysis, Insights and Forecast - by End User
- 9.2.1. Media and Entertainment
- 9.2.2. Advertising
- 9.2.3. E-commerce
- 9.2.4. Healthcare
- 9.2.5. Business and Financial Services
- 9.2.6. Research and Education
- 9.2.7. Other End Users
- 9.1. Market Analysis, Insights and Forecast - by Offering
- 10. Middle East and Africa CDN Industry Analysis, Insights and Forecast, 2019-2031
- 10.1. Market Analysis, Insights and Forecast - by Offering
- 10.1.1. Solutions
- 10.1.1.1. Media Delivery
- 10.1.1.2. Cloud Security
- 10.1.1.3. Web Performance
- 10.1.2. Services
- 10.1.2.1. Content Delivery
- 10.1.2.2. Cloud Security
- 10.1.2.3. Web Performance
- 10.1.1. Solutions
- 10.2. Market Analysis, Insights and Forecast - by End User
- 10.2.1. Media and Entertainment
- 10.2.2. Advertising
- 10.2.3. E-commerce
- 10.2.4. Healthcare
- 10.2.5. Business and Financial Services
- 10.2.6. Research and Education
- 10.2.7. Other End Users
- 10.1. Market Analysis, Insights and Forecast - by Offering
- 11. North America CDN Industry Analysis, Insights and Forecast, 2019-2031
- 11.1. Market Analysis, Insights and Forecast - By Country/Sub-region
- 11.1.1 United States
- 11.1.2 Canada
- 11.1.3 Mexico
- 12. Europe CDN Industry Analysis, Insights and Forecast, 2019-2031
- 12.1. Market Analysis, Insights and Forecast - By Country/Sub-region
- 12.1.1 Germany
- 12.1.2 United Kingdom
- 12.1.3 France
- 12.1.4 Spain
- 12.1.5 Italy
- 12.1.6 Spain
- 12.1.7 Belgium
- 12.1.8 Netherland
- 12.1.9 Nordics
- 12.1.10 Rest of Europe
- 13. Asia Pacific CDN Industry Analysis, Insights and Forecast, 2019-2031
- 13.1. Market Analysis, Insights and Forecast - By Country/Sub-region
- 13.1.1 China
- 13.1.2 Japan
- 13.1.3 India
- 13.1.4 South Korea
- 13.1.5 Southeast Asia
- 13.1.6 Australia
- 13.1.7 Indonesia
- 13.1.8 Phillipes
- 13.1.9 Singapore
- 13.1.10 Thailandc
- 13.1.11 Rest of Asia Pacific
- 14. South America CDN Industry Analysis, Insights and Forecast, 2019-2031
- 14.1. Market Analysis, Insights and Forecast - By Country/Sub-region
- 14.1.1 Brazil
- 14.1.2 Argentina
- 14.1.3 Peru
- 14.1.4 Chile
- 14.1.5 Colombia
- 14.1.6 Ecuador
- 14.1.7 Venezuela
- 14.1.8 Rest of South America
- 15. North America CDN Industry Analysis, Insights and Forecast, 2019-2031
- 15.1. Market Analysis, Insights and Forecast - By Country/Sub-region
- 15.1.1 United States
- 15.1.2 Canada
- 15.1.3 Mexico
- 16. MEA CDN Industry Analysis, Insights and Forecast, 2019-2031
- 16.1. Market Analysis, Insights and Forecast - By Country/Sub-region
- 16.1.1 United Arab Emirates
- 16.1.2 Saudi Arabia
- 16.1.3 South Africa
- 16.1.4 Rest of Middle East and Africa
- 17. Competitive Analysis
- 17.1. Global Market Share Analysis 2024
- 17.2. Company Profiles
- 17.2.1 Fastly Inc
- 17.2.1.1. Overview
- 17.2.1.2. Products
- 17.2.1.3. SWOT Analysis
- 17.2.1.4. Recent Developments
- 17.2.1.5. Financials (Based on Availability)
- 17.2.2 Amazon Web Services Inc (Amazon com Inc )
- 17.2.2.1. Overview
- 17.2.2.2. Products
- 17.2.2.3. SWOT Analysis
- 17.2.2.4. Recent Developments
- 17.2.2.5. Financials (Based on Availability)
- 17.2.3 Akamai Technologies Inc
- 17.2.3.1. Overview
- 17.2.3.2. Products
- 17.2.3.3. SWOT Analysis
- 17.2.3.4. Recent Developments
- 17.2.3.5. Financials (Based on Availability)
- 17.2.4 Google LLC (Alphabet Inc )
- 17.2.4.1. Overview
- 17.2.4.2. Products
- 17.2.4.3. SWOT Analysis
- 17.2.4.4. Recent Developments
- 17.2.4.5. Financials (Based on Availability)
- 17.2.5 Edgio Inc
- 17.2.5.1. Overview
- 17.2.5.2. Products
- 17.2.5.3. SWOT Analysis
- 17.2.5.4. Recent Developments
- 17.2.5.5. Financials (Based on Availability)
- 17.2.6 Microsoft Corporation
- 17.2.6.1. Overview
- 17.2.6.2. Products
- 17.2.6.3. SWOT Analysis
- 17.2.6.4. Recent Developments
- 17.2.6.5. Financials (Based on Availability)
- 17.2.7 Cloudflare Inc
- 17.2.7.1. Overview
- 17.2.7.2. Products
- 17.2.7.3. SWOT Analysis
- 17.2.7.4. Recent Developments
- 17.2.7.5. Financials (Based on Availability)
- 17.2.8 Tata Communications Limite
- 17.2.8.1. Overview
- 17.2.8.2. Products
- 17.2.8.3. SWOT Analysis
- 17.2.8.4. Recent Developments
- 17.2.8.5. Financials (Based on Availability)
- 17.2.9 AT&T Inc
- 17.2.9.1. Overview
- 17.2.9.2. Products
- 17.2.9.3. SWOT Analysis
- 17.2.9.4. Recent Developments
- 17.2.9.5. Financials (Based on Availability)
- 17.2.10 CDNetworks Inc
- 17.2.10.1. Overview
- 17.2.10.2. Products
- 17.2.10.3. SWOT Analysis
- 17.2.10.4. Recent Developments
- 17.2.10.5. Financials (Based on Availability)
- 17.2.1 Fastly Inc
List of Figures
- Figure 1: Global CDN Industry Revenue Breakdown (Million, %) by Region 2024 & 2032
- Figure 2: Global CDN Industry Volume Breakdown (K Unit, %) by Region 2024 & 2032
- Figure 3: North America CDN Industry Revenue (Million), by Country 2024 & 2032
- Figure 4: North America CDN Industry Volume (K Unit), by Country 2024 & 2032
- Figure 5: North America CDN Industry Revenue Share (%), by Country 2024 & 2032
- Figure 6: North America CDN Industry Volume Share (%), by Country 2024 & 2032
- Figure 7: Europe CDN Industry Revenue (Million), by Country 2024 & 2032
- Figure 8: Europe CDN Industry Volume (K Unit), by Country 2024 & 2032
- Figure 9: Europe CDN Industry Revenue Share (%), by Country 2024 & 2032
- Figure 10: Europe CDN Industry Volume Share (%), by Country 2024 & 2032
- Figure 11: Asia Pacific CDN Industry Revenue (Million), by Country 2024 & 2032
- Figure 12: Asia Pacific CDN Industry Volume (K Unit), by Country 2024 & 2032
- Figure 13: Asia Pacific CDN Industry Revenue Share (%), by Country 2024 & 2032
- Figure 14: Asia Pacific CDN Industry Volume Share (%), by Country 2024 & 2032
- Figure 15: South America CDN Industry Revenue (Million), by Country 2024 & 2032
- Figure 16: South America CDN Industry Volume (K Unit), by Country 2024 & 2032
- Figure 17: South America CDN Industry Revenue Share (%), by Country 2024 & 2032
- Figure 18: South America CDN Industry Volume Share (%), by Country 2024 & 2032
- Figure 19: North America CDN Industry Revenue (Million), by Country 2024 & 2032
- Figure 20: North America CDN Industry Volume (K Unit), by Country 2024 & 2032
- Figure 21: North America CDN Industry Revenue Share (%), by Country 2024 & 2032
- Figure 22: North America CDN Industry Volume Share (%), by Country 2024 & 2032
- Figure 23: MEA CDN Industry Revenue (Million), by Country 2024 & 2032
- Figure 24: MEA CDN Industry Volume (K Unit), by Country 2024 & 2032
- Figure 25: MEA CDN Industry Revenue Share (%), by Country 2024 & 2032
- Figure 26: MEA CDN Industry Volume Share (%), by Country 2024 & 2032
- Figure 27: North America CDN Industry Revenue (Million), by Offering 2024 & 2032
- Figure 28: North America CDN Industry Volume (K Unit), by Offering 2024 & 2032
- Figure 29: North America CDN Industry Revenue Share (%), by Offering 2024 & 2032
- Figure 30: North America CDN Industry Volume Share (%), by Offering 2024 & 2032
- Figure 31: North America CDN Industry Revenue (Million), by End User 2024 & 2032
- Figure 32: North America CDN Industry Volume (K Unit), by End User 2024 & 2032
- Figure 33: North America CDN Industry Revenue Share (%), by End User 2024 & 2032
- Figure 34: North America CDN Industry Volume Share (%), by End User 2024 & 2032
- Figure 35: North America CDN Industry Revenue (Million), by Country 2024 & 2032
- Figure 36: North America CDN Industry Volume (K Unit), by Country 2024 & 2032
- Figure 37: North America CDN Industry Revenue Share (%), by Country 2024 & 2032
- Figure 38: North America CDN Industry Volume Share (%), by Country 2024 & 2032
- Figure 39: Europe CDN Industry Revenue (Million), by Offering 2024 & 2032
- Figure 40: Europe CDN Industry Volume (K Unit), by Offering 2024 & 2032
- Figure 41: Europe CDN Industry Revenue Share (%), by Offering 2024 & 2032
- Figure 42: Europe CDN Industry Volume Share (%), by Offering 2024 & 2032
- Figure 43: Europe CDN Industry Revenue (Million), by End User 2024 & 2032
- Figure 44: Europe CDN Industry Volume (K Unit), by End User 2024 & 2032
- Figure 45: Europe CDN Industry Revenue Share (%), by End User 2024 & 2032
- Figure 46: Europe CDN Industry Volume Share (%), by End User 2024 & 2032
- Figure 47: Europe CDN Industry Revenue (Million), by Country 2024 & 2032
- Figure 48: Europe CDN Industry Volume (K Unit), by Country 2024 & 2032
- Figure 49: Europe CDN Industry Revenue Share (%), by Country 2024 & 2032
- Figure 50: Europe CDN Industry Volume Share (%), by Country 2024 & 2032
- Figure 51: Asia Pacific CDN Industry Revenue (Million), by Offering 2024 & 2032
- Figure 52: Asia Pacific CDN Industry Volume (K Unit), by Offering 2024 & 2032
- Figure 53: Asia Pacific CDN Industry Revenue Share (%), by Offering 2024 & 2032
- Figure 54: Asia Pacific CDN Industry Volume Share (%), by Offering 2024 & 2032
- Figure 55: Asia Pacific CDN Industry Revenue (Million), by End User 2024 & 2032
- Figure 56: Asia Pacific CDN Industry Volume (K Unit), by End User 2024 & 2032
- Figure 57: Asia Pacific CDN Industry Revenue Share (%), by End User 2024 & 2032
- Figure 58: Asia Pacific CDN Industry Volume Share (%), by End User 2024 & 2032
- Figure 59: Asia Pacific CDN Industry Revenue (Million), by Country 2024 & 2032
- Figure 60: Asia Pacific CDN Industry Volume (K Unit), by Country 2024 & 2032
- Figure 61: Asia Pacific CDN Industry Revenue Share (%), by Country 2024 & 2032
- Figure 62: Asia Pacific CDN Industry Volume Share (%), by Country 2024 & 2032
- Figure 63: Latin America CDN Industry Revenue (Million), by Offering 2024 & 2032
- Figure 64: Latin America CDN Industry Volume (K Unit), by Offering 2024 & 2032
- Figure 65: Latin America CDN Industry Revenue Share (%), by Offering 2024 & 2032
- Figure 66: Latin America CDN Industry Volume Share (%), by Offering 2024 & 2032
- Figure 67: Latin America CDN Industry Revenue (Million), by End User 2024 & 2032
- Figure 68: Latin America CDN Industry Volume (K Unit), by End User 2024 & 2032
- Figure 69: Latin America CDN Industry Revenue Share (%), by End User 2024 & 2032
- Figure 70: Latin America CDN Industry Volume Share (%), by End User 2024 & 2032
- Figure 71: Latin America CDN Industry Revenue (Million), by Country 2024 & 2032
- Figure 72: Latin America CDN Industry Volume (K Unit), by Country 2024 & 2032
- Figure 73: Latin America CDN Industry Revenue Share (%), by Country 2024 & 2032
- Figure 74: Latin America CDN Industry Volume Share (%), by Country 2024 & 2032
- Figure 75: Middle East and Africa CDN Industry Revenue (Million), by Offering 2024 & 2032
- Figure 76: Middle East and Africa CDN Industry Volume (K Unit), by Offering 2024 & 2032
- Figure 77: Middle East and Africa CDN Industry Revenue Share (%), by Offering 2024 & 2032
- Figure 78: Middle East and Africa CDN Industry Volume Share (%), by Offering 2024 & 2032
- Figure 79: Middle East and Africa CDN Industry Revenue (Million), by End User 2024 & 2032
- Figure 80: Middle East and Africa CDN Industry Volume (K Unit), by End User 2024 & 2032
- Figure 81: Middle East and Africa CDN Industry Revenue Share (%), by End User 2024 & 2032
- Figure 82: Middle East and Africa CDN Industry Volume Share (%), by End User 2024 & 2032
- Figure 83: Middle East and Africa CDN Industry Revenue (Million), by Country 2024 & 2032
- Figure 84: Middle East and Africa CDN Industry Volume (K Unit), by Country 2024 & 2032
- Figure 85: Middle East and Africa CDN Industry Revenue Share (%), by Country 2024 & 2032
- Figure 86: Middle East and Africa CDN Industry Volume Share (%), by Country 2024 & 2032
List of Tables
- Table 1: Global CDN Industry Revenue Million Forecast, by Region 2019 & 2032
- Table 2: Global CDN Industry Volume K Unit Forecast, by Region 2019 & 2032
- Table 3: Global CDN Industry Revenue Million Forecast, by Offering 2019 & 2032
- Table 4: Global CDN Industry Volume K Unit Forecast, by Offering 2019 & 2032
- Table 5: Global CDN Industry Revenue Million Forecast, by End User 2019 & 2032
- Table 6: Global CDN Industry Volume K Unit Forecast, by End User 2019 & 2032
- Table 7: Global CDN Industry Revenue Million Forecast, by Region 2019 & 2032
- Table 8: Global CDN Industry Volume K Unit Forecast, by Region 2019 & 2032
- Table 9: Global CDN Industry Revenue Million Forecast, by Country 2019 & 2032
- Table 10: Global CDN Industry Volume K Unit Forecast, by Country 2019 & 2032
- Table 11: United States CDN Industry Revenue (Million) Forecast, by Application 2019 & 2032
- Table 12: United States CDN Industry Volume (K Unit) Forecast, by Application 2019 & 2032
- Table 13: Canada CDN Industry Revenue (Million) Forecast, by Application 2019 & 2032
- Table 14: Canada CDN Industry Volume (K Unit) Forecast, by Application 2019 & 2032
- Table 15: Mexico CDN Industry Revenue (Million) Forecast, by Application 2019 & 2032
- Table 16: Mexico CDN Industry Volume (K Unit) Forecast, by Application 2019 & 2032
- Table 17: Global CDN Industry Revenue Million Forecast, by Country 2019 & 2032
- Table 18: Global CDN Industry Volume K Unit Forecast, by Country 2019 & 2032
- Table 19: Germany CDN Industry Revenue (Million) Forecast, by Application 2019 & 2032
- Table 20: Germany CDN Industry Volume (K Unit) Forecast, by Application 2019 & 2032
- Table 21: United Kingdom CDN Industry Revenue (Million) Forecast, by Application 2019 & 2032
- Table 22: United Kingdom CDN Industry Volume (K Unit) Forecast, by Application 2019 & 2032
- Table 23: France CDN Industry Revenue (Million) Forecast, by Application 2019 & 2032
- Table 24: France CDN Industry Volume (K Unit) Forecast, by Application 2019 & 2032
- Table 25: Spain CDN Industry Revenue (Million) Forecast, by Application 2019 & 2032
- Table 26: Spain CDN Industry Volume (K Unit) Forecast, by Application 2019 & 2032
- Table 27: Italy CDN Industry Revenue (Million) Forecast, by Application 2019 & 2032
- Table 28: Italy CDN Industry Volume (K Unit) Forecast, by Application 2019 & 2032
- Table 29: Spain CDN Industry Revenue (Million) Forecast, by Application 2019 & 2032
- Table 30: Spain CDN Industry Volume (K Unit) Forecast, by Application 2019 & 2032
- Table 31: Belgium CDN Industry Revenue (Million) Forecast, by Application 2019 & 2032
- Table 32: Belgium CDN Industry Volume (K Unit) Forecast, by Application 2019 & 2032
- Table 33: Netherland CDN Industry Revenue (Million) Forecast, by Application 2019 & 2032
- Table 34: Netherland CDN Industry Volume (K Unit) Forecast, by Application 2019 & 2032
- Table 35: Nordics CDN Industry Revenue (Million) Forecast, by Application 2019 & 2032
- Table 36: Nordics CDN Industry Volume (K Unit) Forecast, by Application 2019 & 2032
- Table 37: Rest of Europe CDN Industry Revenue (Million) Forecast, by Application 2019 & 2032
- Table 38: Rest of Europe CDN Industry Volume (K Unit) Forecast, by Application 2019 & 2032
- Table 39: Global CDN Industry Revenue Million Forecast, by Country 2019 & 2032
- Table 40: Global CDN Industry Volume K Unit Forecast, by Country 2019 & 2032
- Table 41: China CDN Industry Revenue (Million) Forecast, by Application 2019 & 2032
- Table 42: China CDN Industry Volume (K Unit) Forecast, by Application 2019 & 2032
- Table 43: Japan CDN Industry Revenue (Million) Forecast, by Application 2019 & 2032
- Table 44: Japan CDN Industry Volume (K Unit) Forecast, by Application 2019 & 2032
- Table 45: India CDN Industry Revenue (Million) Forecast, by Application 2019 & 2032
- Table 46: India CDN Industry Volume (K Unit) Forecast, by Application 2019 & 2032
- Table 47: South Korea CDN Industry Revenue (Million) Forecast, by Application 2019 & 2032
- Table 48: South Korea CDN Industry Volume (K Unit) Forecast, by Application 2019 & 2032
- Table 49: Southeast Asia CDN Industry Revenue (Million) Forecast, by Application 2019 & 2032
- Table 50: Southeast Asia CDN Industry Volume (K Unit) Forecast, by Application 2019 & 2032
- Table 51: Australia CDN Industry Revenue (Million) Forecast, by Application 2019 & 2032
- Table 52: Australia CDN Industry Volume (K Unit) Forecast, by Application 2019 & 2032
- Table 53: Indonesia CDN Industry Revenue (Million) Forecast, by Application 2019 & 2032
- Table 54: Indonesia CDN Industry Volume (K Unit) Forecast, by Application 2019 & 2032
- Table 55: Phillipes CDN Industry Revenue (Million) Forecast, by Application 2019 & 2032
- Table 56: Phillipes CDN Industry Volume (K Unit) Forecast, by Application 2019 & 2032
- Table 57: Singapore CDN Industry Revenue (Million) Forecast, by Application 2019 & 2032
- Table 58: Singapore CDN Industry Volume (K Unit) Forecast, by Application 2019 & 2032
- Table 59: Thailandc CDN Industry Revenue (Million) Forecast, by Application 2019 & 2032
- Table 60: Thailandc CDN Industry Volume (K Unit) Forecast, by Application 2019 & 2032
- Table 61: Rest of Asia Pacific CDN Industry Revenue (Million) Forecast, by Application 2019 & 2032
- Table 62: Rest of Asia Pacific CDN Industry Volume (K Unit) Forecast, by Application 2019 & 2032
- Table 63: Global CDN Industry Revenue Million Forecast, by Country 2019 & 2032
- Table 64: Global CDN Industry Volume K Unit Forecast, by Country 2019 & 2032
- Table 65: Brazil CDN Industry Revenue (Million) Forecast, by Application 2019 & 2032
- Table 66: Brazil CDN Industry Volume (K Unit) Forecast, by Application 2019 & 2032
- Table 67: Argentina CDN Industry Revenue (Million) Forecast, by Application 2019 & 2032
- Table 68: Argentina CDN Industry Volume (K Unit) Forecast, by Application 2019 & 2032
- Table 69: Peru CDN Industry Revenue (Million) Forecast, by Application 2019 & 2032
- Table 70: Peru CDN Industry Volume (K Unit) Forecast, by Application 2019 & 2032
- Table 71: Chile CDN Industry Revenue (Million) Forecast, by Application 2019 & 2032
- Table 72: Chile CDN Industry Volume (K Unit) Forecast, by Application 2019 & 2032
- Table 73: Colombia CDN Industry Revenue (Million) Forecast, by Application 2019 & 2032
- Table 74: Colombia CDN Industry Volume (K Unit) Forecast, by Application 2019 & 2032
- Table 75: Ecuador CDN Industry Revenue (Million) Forecast, by Application 2019 & 2032
- Table 76: Ecuador CDN Industry Volume (K Unit) Forecast, by Application 2019 & 2032
- Table 77: Venezuela CDN Industry Revenue (Million) Forecast, by Application 2019 & 2032
- Table 78: Venezuela CDN Industry Volume (K Unit) Forecast, by Application 2019 & 2032
- Table 79: Rest of South America CDN Industry Revenue (Million) Forecast, by Application 2019 & 2032
- Table 80: Rest of South America CDN Industry Volume (K Unit) Forecast, by Application 2019 & 2032
- Table 81: Global CDN Industry Revenue Million Forecast, by Country 2019 & 2032
- Table 82: Global CDN Industry Volume K Unit Forecast, by Country 2019 & 2032
- Table 83: United States CDN Industry Revenue (Million) Forecast, by Application 2019 & 2032
- Table 84: United States CDN Industry Volume (K Unit) Forecast, by Application 2019 & 2032
- Table 85: Canada CDN Industry Revenue (Million) Forecast, by Application 2019 & 2032
- Table 86: Canada CDN Industry Volume (K Unit) Forecast, by Application 2019 & 2032
- Table 87: Mexico CDN Industry Revenue (Million) Forecast, by Application 2019 & 2032
- Table 88: Mexico CDN Industry Volume (K Unit) Forecast, by Application 2019 & 2032
- Table 89: Global CDN Industry Revenue Million Forecast, by Country 2019 & 2032
- Table 90: Global CDN Industry Volume K Unit Forecast, by Country 2019 & 2032
- Table 91: United Arab Emirates CDN Industry Revenue (Million) Forecast, by Application 2019 & 2032
- Table 92: United Arab Emirates CDN Industry Volume (K Unit) Forecast, by Application 2019 & 2032
- Table 93: Saudi Arabia CDN Industry Revenue (Million) Forecast, by Application 2019 & 2032
- Table 94: Saudi Arabia CDN Industry Volume (K Unit) Forecast, by Application 2019 & 2032
- Table 95: South Africa CDN Industry Revenue (Million) Forecast, by Application 2019 & 2032
- Table 96: South Africa CDN Industry Volume (K Unit) Forecast, by Application 2019 & 2032
- Table 97: Rest of Middle East and Africa CDN Industry Revenue (Million) Forecast, by Application 2019 & 2032
- Table 98: Rest of Middle East and Africa CDN Industry Volume (K Unit) Forecast, by Application 2019 & 2032
- Table 99: Global CDN Industry Revenue Million Forecast, by Offering 2019 & 2032
- Table 100: Global CDN Industry Volume K Unit Forecast, by Offering 2019 & 2032
- Table 101: Global CDN Industry Revenue Million Forecast, by End User 2019 & 2032
- Table 102: Global CDN Industry Volume K Unit Forecast, by End User 2019 & 2032
- Table 103: Global CDN Industry Revenue Million Forecast, by Country 2019 & 2032
- Table 104: Global CDN Industry Volume K Unit Forecast, by Country 2019 & 2032
- Table 105: United States CDN Industry Revenue (Million) Forecast, by Application 2019 & 2032
- Table 106: United States CDN Industry Volume (K Unit) Forecast, by Application 2019 & 2032
- Table 107: Canada CDN Industry Revenue (Million) Forecast, by Application 2019 & 2032
- Table 108: Canada CDN Industry Volume (K Unit) Forecast, by Application 2019 & 2032
- Table 109: Global CDN Industry Revenue Million Forecast, by Offering 2019 & 2032
- Table 110: Global CDN Industry Volume K Unit Forecast, by Offering 2019 & 2032
- Table 111: Global CDN Industry Revenue Million Forecast, by End User 2019 & 2032
- Table 112: Global CDN Industry Volume K Unit Forecast, by End User 2019 & 2032
- Table 113: Global CDN Industry Revenue Million Forecast, by Country 2019 & 2032
- Table 114: Global CDN Industry Volume K Unit Forecast, by Country 2019 & 2032
- Table 115: Germany CDN Industry Revenue (Million) Forecast, by Application 2019 & 2032
- Table 116: Germany CDN Industry Volume (K Unit) Forecast, by Application 2019 & 2032
- Table 117: United Kingdom CDN Industry Revenue (Million) Forecast, by Application 2019 & 2032
- Table 118: United Kingdom CDN Industry Volume (K Unit) Forecast, by Application 2019 & 2032
- Table 119: France CDN Industry Revenue (Million) Forecast, by Application 2019 & 2032
- Table 120: France CDN Industry Volume (K Unit) Forecast, by Application 2019 & 2032
- Table 121: Rest of Europe CDN Industry Revenue (Million) Forecast, by Application 2019 & 2032
- Table 122: Rest of Europe CDN Industry Volume (K Unit) Forecast, by Application 2019 & 2032
- Table 123: Global CDN Industry Revenue Million Forecast, by Offering 2019 & 2032
- Table 124: Global CDN Industry Volume K Unit Forecast, by Offering 2019 & 2032
- Table 125: Global CDN Industry Revenue Million Forecast, by End User 2019 & 2032
- Table 126: Global CDN Industry Volume K Unit Forecast, by End User 2019 & 2032
- Table 127: Global CDN Industry Revenue Million Forecast, by Country 2019 & 2032
- Table 128: Global CDN Industry Volume K Unit Forecast, by Country 2019 & 2032
- Table 129: China CDN Industry Revenue (Million) Forecast, by Application 2019 & 2032
- Table 130: China CDN Industry Volume (K Unit) Forecast, by Application 2019 & 2032
- Table 131: Japan CDN Industry Revenue (Million) Forecast, by Application 2019 & 2032
- Table 132: Japan CDN Industry Volume (K Unit) Forecast, by Application 2019 & 2032
- Table 133: India CDN Industry Revenue (Million) Forecast, by Application 2019 & 2032
- Table 134: India CDN Industry Volume (K Unit) Forecast, by Application 2019 & 2032
- Table 135: South Korea CDN Industry Revenue (Million) Forecast, by Application 2019 & 2032
- Table 136: South Korea CDN Industry Volume (K Unit) Forecast, by Application 2019 & 2032
- Table 137: Rest of Asia Pacific CDN Industry Revenue (Million) Forecast, by Application 2019 & 2032
- Table 138: Rest of Asia Pacific CDN Industry Volume (K Unit) Forecast, by Application 2019 & 2032
- Table 139: Global CDN Industry Revenue Million Forecast, by Offering 2019 & 2032
- Table 140: Global CDN Industry Volume K Unit Forecast, by Offering 2019 & 2032
- Table 141: Global CDN Industry Revenue Million Forecast, by End User 2019 & 2032
- Table 142: Global CDN Industry Volume K Unit Forecast, by End User 2019 & 2032
- Table 143: Global CDN Industry Revenue Million Forecast, by Country 2019 & 2032
- Table 144: Global CDN Industry Volume K Unit Forecast, by Country 2019 & 2032
- Table 145: Brazil CDN Industry Revenue (Million) Forecast, by Application 2019 & 2032
- Table 146: Brazil CDN Industry Volume (K Unit) Forecast, by Application 2019 & 2032
- Table 147: Mexico CDN Industry Revenue (Million) Forecast, by Application 2019 & 2032
- Table 148: Mexico CDN Industry Volume (K Unit) Forecast, by Application 2019 & 2032
- Table 149: Rest of Latin America CDN Industry Revenue (Million) Forecast, by Application 2019 & 2032
- Table 150: Rest of Latin America CDN Industry Volume (K Unit) Forecast, by Application 2019 & 2032
- Table 151: Global CDN Industry Revenue Million Forecast, by Offering 2019 & 2032
- Table 152: Global CDN Industry Volume K Unit Forecast, by Offering 2019 & 2032
- Table 153: Global CDN Industry Revenue Million Forecast, by End User 2019 & 2032
- Table 154: Global CDN Industry Volume K Unit Forecast, by End User 2019 & 2032
- Table 155: Global CDN Industry Revenue Million Forecast, by Country 2019 & 2032
- Table 156: Global CDN Industry Volume K Unit Forecast, by Country 2019 & 2032
- Table 157: United Arab Emirates CDN Industry Revenue (Million) Forecast, by Application 2019 & 2032
- Table 158: United Arab Emirates CDN Industry Volume (K Unit) Forecast, by Application 2019 & 2032
- Table 159: South Africa CDN Industry Revenue (Million) Forecast, by Application 2019 & 2032
- Table 160: South Africa CDN Industry Volume (K Unit) Forecast, by Application 2019 & 2032
- Table 161: Saudi Arabia CDN Industry Revenue (Million) Forecast, by Application 2019 & 2032
- Table 162: Saudi Arabia CDN Industry Volume (K Unit) Forecast, by Application 2019 & 2032
- Table 163: Rest of Middle East CDN Industry Revenue (Million) Forecast, by Application 2019 & 2032
- Table 164: Rest of Middle East CDN Industry Volume (K Unit) Forecast, by Application 2019 & 2032
Frequently Asked Questions
1. What is the projected Compound Annual Growth Rate (CAGR) of the CDN Industry?
The projected CAGR is approximately 11.26%.
2. Which companies are prominent players in the CDN Industry?
Key companies in the market include Fastly Inc, Amazon Web Services Inc (Amazon com Inc ), Akamai Technologies Inc, Google LLC (Alphabet Inc ), Edgio Inc, Microsoft Corporation, Cloudflare Inc, Tata Communications Limite, AT&T Inc, CDNetworks Inc.
3. What are the main segments of the CDN Industry?
The market segments include Offering, End User.
4. Can you provide details about the market size?
The market size is estimated to be USD 23.79 Million as of 2022.
5. What are some drivers contributing to market growth?
Increasing Online Users. Per Capita Online Consumption. and Demand for High -quality Video Content� Drives Growth; Growing Demand from Online Gaming Industries Adding to Market Growth.
6. What are the notable trends driving market growth?
Media and Entertainment (M&E) segment to Witness Major Growth.
7. Are there any restraints impacting market growth?
Larger Organizations Tending to Build their Own CDNS; Bandwidth Concerns Particularly in Developing and Undeveloped Economies.
8. Can you provide examples of recent developments in the market?
September 2023 - The Edgio announced a strategic partnership with streaming technology providers Accedo, Bitmovin, Grabyo, and Vimond to address the rising need faced by media and entertainment when it comes to delivering OTT video due to its ability to quickly assemble and manage a streaming ecosystem that brings high-quality linear, live or on-demand video while reducing costs and growing efficiencies, which would support its market share in line with the strategic growth through partnerships.
9. What pricing options are available for accessing the report?
Pricing options include single-user, multi-user, and enterprise licenses priced at USD 4750, USD 5250, and USD 8750 respectively.
10. Is the market size provided in terms of value or volume?
The market size is provided in terms of value, measured in Million and volume, measured in K Unit.
11. Are there any specific market keywords associated with the report?
Yes, the market keyword associated with the report is "CDN Industry," which aids in identifying and referencing the specific market segment covered.
12. How do I determine which pricing option suits my needs best?
The pricing options vary based on user requirements and access needs. Individual users may opt for single-user licenses, while businesses requiring broader access may choose multi-user or enterprise licenses for cost-effective access to the report.
13. Are there any additional resources or data provided in the CDN Industry report?
While the report offers comprehensive insights, it's advisable to review the specific contents or supplementary materials provided to ascertain if additional resources or data are available.
14. How can I stay updated on further developments or reports in the CDN Industry?
To stay informed about further developments, trends, and reports in the CDN Industry, consider subscribing to industry newsletters, following relevant companies and organizations, or regularly checking reputable industry news sources and publications.
Methodology
Step 1 - Identification of Relevant Samples Size from Population Database


Step 2 - Approaches for Defining Global Market Size (Value, Volume* & Price*)

Note*: In applicable scenarios
Step 3 - Data Sources
Primary Research
- Web Analytics
- Survey Reports
- Research Institute
- Latest Research Reports
- Opinion Leaders
Secondary Research
- Annual Reports
- White Paper
- Latest Press Release
- Industry Association
- Paid Database
- Investor Presentations

Step 4 - Data Triangulation
Involves using different sources of information in order to increase the validity of a study
These sources are likely to be stakeholders in a program - participants, other researchers, program staff, other community members, and so on.
Then we put all data in single framework & apply various statistical tools to find out the dynamic on the market.
During the analysis stage, feedback from the stakeholder groups would be compared to determine areas of agreement as well as areas of divergence


