
Key Insights
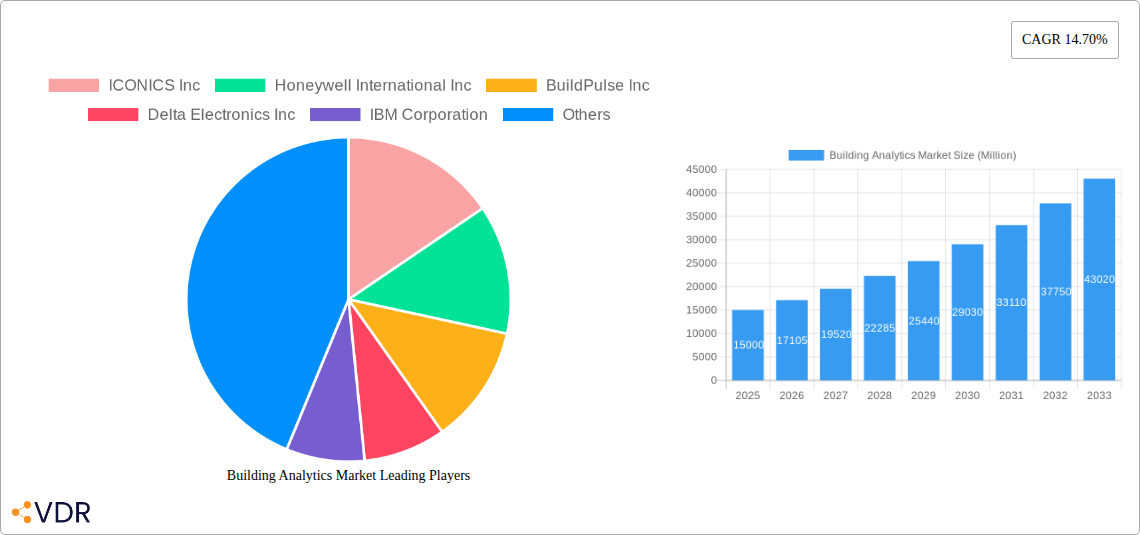
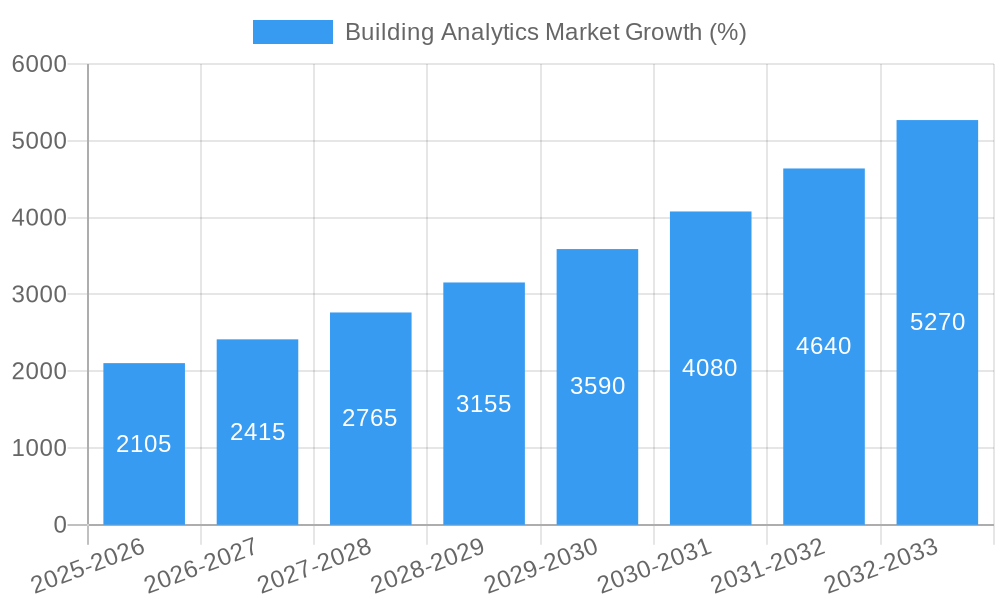
The Building Analytics market is experiencing robust growth, projected to reach a significant size by 2033, driven by a 14.70% Compound Annual Growth Rate (CAGR) from 2025 to 2033. This expansion is fueled by several key factors. The increasing adoption of smart building technologies, the rising demand for energy efficiency and cost optimization, and the growing need for enhanced security and safety within buildings are all major contributors. Furthermore, advancements in data analytics capabilities, the Internet of Things (IoT), and cloud computing are enabling more sophisticated and insightful building management solutions. The market is segmented by building type (residential, commercial, and others), application (energy management, security, fault detection, and others), component (software and services), and deployment mode (on-premises and cloud). The residential segment is anticipated to show strong growth due to increasing awareness of energy conservation and smart home technology adoption. Commercial buildings, driven by the need for improved operational efficiency and reduced operational expenditure, will remain a significant market segment. Cloud-based deployment is gaining traction due to its scalability, cost-effectiveness, and ease of access. Key players such as Honeywell, Siemens, and Johnson Controls are actively shaping the market landscape through innovation and strategic partnerships.
The competitive landscape is marked by both established players and innovative startups. While established companies leverage their existing infrastructure and customer relationships, newer companies are bringing disruptive technologies and agile solutions to the market. However, challenges remain, including data security concerns, the high initial investment costs associated with implementing building analytics systems, and the need for skilled professionals to manage and interpret the data generated. Despite these hurdles, the long-term outlook for the Building Analytics market remains positive, driven by ongoing technological advancements and increasing awareness of the benefits of data-driven building management. The market's future success depends on overcoming the challenges of data security and interoperability, while fostering collaboration between technology providers and building owners/managers.
Building Analytics Market: A Comprehensive Report (2019-2033)
This in-depth report provides a comprehensive analysis of the Building Analytics Market, encompassing market dynamics, growth trends, regional dominance, product landscape, challenges, opportunities, and key players. The study period covers 2019-2033, with 2025 as the base and estimated year. The forecast period spans 2025-2033, and the historical period encompasses 2019-2024. The market is segmented by building type (residential, commercial, other), application (energy management, security management, fault detection and monitoring, other), component (software, services), and deployment mode (on-premises, cloud). The total market size is projected to reach xx Million by 2033.
Building Analytics Market Market Dynamics & Structure
The Building Analytics market is experiencing significant growth, driven by increasing demand for energy efficiency, enhanced security, and improved operational efficiency in buildings. Market concentration is moderate, with several large players holding substantial market share, but a growing number of smaller, specialized companies are also emerging. Technological innovation, particularly in areas like AI, IoT, and cloud computing, is a key driver, enabling more sophisticated analytics and predictive capabilities. Regulatory frameworks promoting energy efficiency and building sustainability further contribute to market growth. Competitive product substitutes include traditional building management systems, but the advantages of data-driven insights offered by building analytics are proving compelling. The market is witnessing increased M&A activity, with larger companies acquiring smaller players to expand their product portfolios and market reach. An estimated xx Million in M&A deals were recorded in 2024, representing a xx% increase from the previous year.
- Market Concentration: Moderate, with top 5 players holding approximately xx% market share in 2024.
- Technological Innovation: Rapid advancements in AI, IoT, and cloud computing are driving product innovation and market expansion.
- Regulatory Frameworks: Government initiatives promoting energy efficiency and green buildings are creating significant demand.
- Competitive Substitutes: Traditional BMS systems face competition from the enhanced capabilities of building analytics solutions.
- End-User Demographics: Growth is driven by large commercial buildings, followed by residential and other building types.
- M&A Trends: Increasing consolidation, with larger companies acquiring smaller, specialized firms.
Building Analytics Market Growth Trends & Insights
The Building Analytics Market has exhibited robust growth over the past few years, with a CAGR of xx% during the historical period (2019-2024). This growth is projected to continue during the forecast period (2025-2033), with a projected CAGR of xx%. Increased adoption rates across various building types and applications are driving this expansion. Technological disruptions, particularly the integration of AI and machine learning, are enhancing the capabilities of building analytics platforms, leading to greater efficiency and cost savings. A shift in consumer behavior towards smart and sustainable buildings is also boosting market demand. Market penetration is expected to reach xx% by 2033, driven by increased awareness of the benefits of building analytics.
Dominant Regions, Countries, or Segments in Building Analytics Market
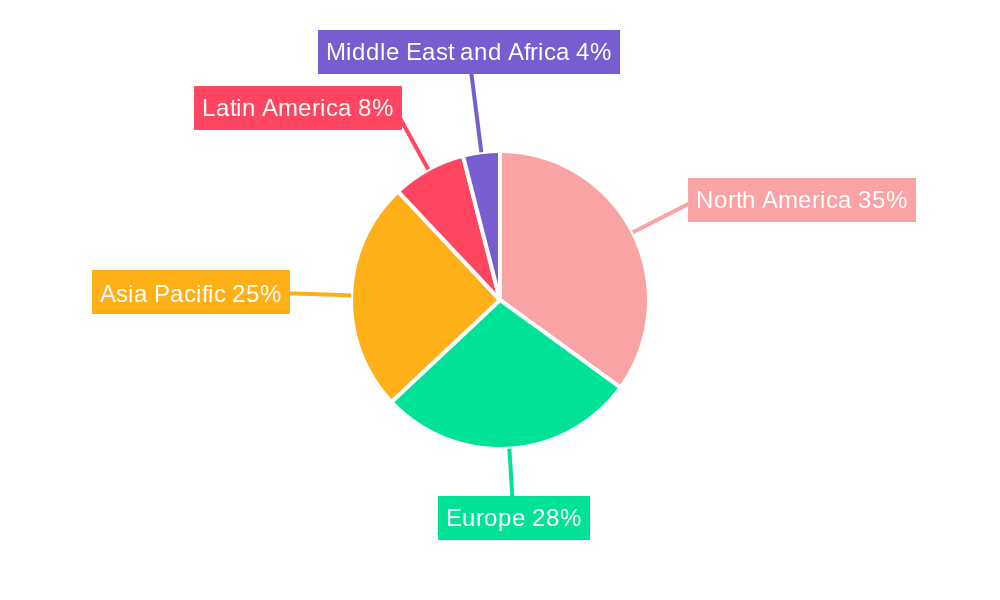
North America currently holds the largest market share in the Building Analytics market, driven by high adoption rates in the commercial sector and strong government support for green building initiatives. Within North America, the United States is the leading market. Europe follows as the second largest region, with significant growth potential in emerging economies. The Commercial Buildings segment is the dominant segment, accounting for approximately xx% of the total market share in 2024. Within applications, Energy Management is the largest segment due to the focus on energy efficiency and cost reduction.
- Key Drivers (North America): Strong government regulations, high adoption rates in commercial buildings, significant investments in smart city initiatives.
- Dominance Factors (Commercial Buildings): Larger budgets, higher return on investment (ROI) from analytics implementation, greater need for efficient building management.
- Growth Potential (Asia Pacific): Rapid urbanization, increasing investments in infrastructure, and growing awareness of energy efficiency are driving growth in this region.
Building Analytics Market Product Landscape
The building analytics market offers a wide range of software and services, from basic monitoring and reporting to advanced predictive analytics and AI-powered decision support. Recent product innovations focus on improving data integration, enhancing user interfaces, and incorporating more advanced analytics capabilities. Unique selling propositions often involve specialized algorithms, industry-specific applications, or seamless integration with other building systems. Technological advancements such as cloud computing and edge computing are enhancing the scalability and performance of building analytics solutions.
Key Drivers, Barriers & Challenges in Building Analytics Market
Key Drivers: Increasing energy costs, stringent environmental regulations, growing demand for smart buildings, and advancements in IoT and AI technologies are key drivers. Government incentives and subsidies for energy-efficient buildings further propel market growth.
Challenges: High initial investment costs, integration complexities with legacy systems, data security concerns, and the need for skilled personnel to manage and interpret data are key challenges. Supply chain disruptions can impact the availability of components, and regulatory hurdles can slow down adoption in certain regions. Furthermore, the competitive landscape is intense, with both established players and new entrants vying for market share, resulting in price pressures and margin erosion. These factors collectively have been estimated to limit annual market growth by approximately xx% in 2024.
Emerging Opportunities in Building Analytics Market
The market presents significant opportunities in underserved sectors, such as small and medium-sized enterprises (SMEs) and residential buildings. Innovative applications, like predictive maintenance and occupant comfort optimization, offer substantial potential. Expanding into emerging markets in Asia-Pacific and Africa presents significant untapped market opportunities. Moreover, the integration of building analytics with other technologies like smart grids and renewable energy systems creates synergistic opportunities.
Growth Accelerators in the Building Analytics Market Industry
Technological breakthroughs in AI, machine learning, and edge computing are significantly accelerating market growth. Strategic partnerships between technology providers and building owners/operators are streamlining adoption. Government initiatives promoting smart cities and green buildings are fostering market expansion. Increased awareness among building owners and operators about the cost savings and efficiency gains associated with building analytics is further contributing to the growth trajectory.
Key Players Shaping the Building Analytics Market Market
- ICONICS Inc
- Honeywell International Inc
- BuildPulse Inc
- Delta Electronics Inc
- IBM Corporation
- Crestron Electronics
- Noveda Technologies Inc
- CopperTree Analytics Inc
- Johnson Controls International Plc
- Siemens AG
- BuildingIQ
- GridPoint Inc
- Schneider Electric
- ENGIE Insight Services Inc
- General Electric Company
Notable Milestones in Building Analytics Market Sector
- 2022-Q3: Honeywell launches a new AI-powered building analytics platform.
- 2023-Q1: Siemens acquires a smaller building analytics company, expanding its product portfolio.
- 2024-Q2: Significant increase in investment in building analytics startups. xx Million in venture capital funding recorded.
In-Depth Building Analytics Market Market Outlook
The Building Analytics market is poised for continued strong growth over the next decade, driven by technological advancements, increasing regulatory pressure, and rising awareness of the benefits of data-driven building management. Strategic opportunities exist for companies that can effectively leverage AI and machine learning to offer advanced predictive analytics, enhance data integration capabilities, and expand into new geographic markets and underserved segments. Focus on providing tailored solutions for specific building types and applications will be crucial for success in this dynamic market.
Building Analytics Market Segmentation
-
1. Application
- 1.1. Energy Management
- 1.2. Security Management
- 1.3. Fault Detection and Monitoring
- 1.4. Other Applications
-
2. Component
- 2.1. Software
- 2.2. Services
-
3. Deployment Mode
- 3.1. On-Premises
- 3.2. Cloud
-
4. Building Type
- 4.1. Residential Buildings
- 4.2. Commercial Buildings
- 4.3. Other Building Types
Building Analytics Market Segmentation By Geography
- 1. North America
- 2. Europe
- 3. Asia Pacific
- 4. Latin America
- 5. Middle East and Africa
Building Analytics Market REPORT HIGHLIGHTS
| Aspects | Details |
|---|---|
| Study Period | 2019-2033 |
| Base Year | 2024 |
| Estimated Year | 2025 |
| Forecast Period | 2025-2033 |
| Historical Period | 2019-2024 |
| Growth Rate | CAGR of 14.70% from 2019-2033 |
| Segmentation |
|
Table of Contents
- 1. Introduction
- 1.1. Research Scope
- 1.2. Market Segmentation
- 1.3. Research Methodology
- 1.4. Definitions and Assumptions
- 2. Executive Summary
- 2.1. Introduction
- 3. Market Dynamics
- 3.1. Introduction
- 3.2. Market Drivers
- 3.2.1. ; Increased Demand for Energy-Efficient Systems; Growing Adoption of Cloud-Based IoT Platforms
- 3.3. Market Restrains
- 3.3.1. ; High Cost of Implementation
- 3.4. Market Trends
- 3.4.1. Energy Management Application to Hold the Largest Market Size
- 4. Market Factor Analysis
- 4.1. Porters Five Forces
- 4.2. Supply/Value Chain
- 4.3. PESTEL analysis
- 4.4. Market Entropy
- 4.5. Patent/Trademark Analysis
- 5. Global Building Analytics Market Analysis, Insights and Forecast, 2019-2031
- 5.1. Market Analysis, Insights and Forecast - by Application
- 5.1.1. Energy Management
- 5.1.2. Security Management
- 5.1.3. Fault Detection and Monitoring
- 5.1.4. Other Applications
- 5.2. Market Analysis, Insights and Forecast - by Component
- 5.2.1. Software
- 5.2.2. Services
- 5.3. Market Analysis, Insights and Forecast - by Deployment Mode
- 5.3.1. On-Premises
- 5.3.2. Cloud
- 5.4. Market Analysis, Insights and Forecast - by Building Type
- 5.4.1. Residential Buildings
- 5.4.2. Commercial Buildings
- 5.4.3. Other Building Types
- 5.5. Market Analysis, Insights and Forecast - by Region
- 5.5.1. North America
- 5.5.2. Europe
- 5.5.3. Asia Pacific
- 5.5.4. Latin America
- 5.5.5. Middle East and Africa
- 5.1. Market Analysis, Insights and Forecast - by Application
- 6. North America Building Analytics Market Analysis, Insights and Forecast, 2019-2031
- 6.1. Market Analysis, Insights and Forecast - by Application
- 6.1.1. Energy Management
- 6.1.2. Security Management
- 6.1.3. Fault Detection and Monitoring
- 6.1.4. Other Applications
- 6.2. Market Analysis, Insights and Forecast - by Component
- 6.2.1. Software
- 6.2.2. Services
- 6.3. Market Analysis, Insights and Forecast - by Deployment Mode
- 6.3.1. On-Premises
- 6.3.2. Cloud
- 6.4. Market Analysis, Insights and Forecast - by Building Type
- 6.4.1. Residential Buildings
- 6.4.2. Commercial Buildings
- 6.4.3. Other Building Types
- 6.1. Market Analysis, Insights and Forecast - by Application
- 7. Europe Building Analytics Market Analysis, Insights and Forecast, 2019-2031
- 7.1. Market Analysis, Insights and Forecast - by Application
- 7.1.1. Energy Management
- 7.1.2. Security Management
- 7.1.3. Fault Detection and Monitoring
- 7.1.4. Other Applications
- 7.2. Market Analysis, Insights and Forecast - by Component
- 7.2.1. Software
- 7.2.2. Services
- 7.3. Market Analysis, Insights and Forecast - by Deployment Mode
- 7.3.1. On-Premises
- 7.3.2. Cloud
- 7.4. Market Analysis, Insights and Forecast - by Building Type
- 7.4.1. Residential Buildings
- 7.4.2. Commercial Buildings
- 7.4.3. Other Building Types
- 7.1. Market Analysis, Insights and Forecast - by Application
- 8. Asia Pacific Building Analytics Market Analysis, Insights and Forecast, 2019-2031
- 8.1. Market Analysis, Insights and Forecast - by Application
- 8.1.1. Energy Management
- 8.1.2. Security Management
- 8.1.3. Fault Detection and Monitoring
- 8.1.4. Other Applications
- 8.2. Market Analysis, Insights and Forecast - by Component
- 8.2.1. Software
- 8.2.2. Services
- 8.3. Market Analysis, Insights and Forecast - by Deployment Mode
- 8.3.1. On-Premises
- 8.3.2. Cloud
- 8.4. Market Analysis, Insights and Forecast - by Building Type
- 8.4.1. Residential Buildings
- 8.4.2. Commercial Buildings
- 8.4.3. Other Building Types
- 8.1. Market Analysis, Insights and Forecast - by Application
- 9. Latin America Building Analytics Market Analysis, Insights and Forecast, 2019-2031
- 9.1. Market Analysis, Insights and Forecast - by Application
- 9.1.1. Energy Management
- 9.1.2. Security Management
- 9.1.3. Fault Detection and Monitoring
- 9.1.4. Other Applications
- 9.2. Market Analysis, Insights and Forecast - by Component
- 9.2.1. Software
- 9.2.2. Services
- 9.3. Market Analysis, Insights and Forecast - by Deployment Mode
- 9.3.1. On-Premises
- 9.3.2. Cloud
- 9.4. Market Analysis, Insights and Forecast - by Building Type
- 9.4.1. Residential Buildings
- 9.4.2. Commercial Buildings
- 9.4.3. Other Building Types
- 9.1. Market Analysis, Insights and Forecast - by Application
- 10. Middle East and Africa Building Analytics Market Analysis, Insights and Forecast, 2019-2031
- 10.1. Market Analysis, Insights and Forecast - by Application
- 10.1.1. Energy Management
- 10.1.2. Security Management
- 10.1.3. Fault Detection and Monitoring
- 10.1.4. Other Applications
- 10.2. Market Analysis, Insights and Forecast - by Component
- 10.2.1. Software
- 10.2.2. Services
- 10.3. Market Analysis, Insights and Forecast - by Deployment Mode
- 10.3.1. On-Premises
- 10.3.2. Cloud
- 10.4. Market Analysis, Insights and Forecast - by Building Type
- 10.4.1. Residential Buildings
- 10.4.2. Commercial Buildings
- 10.4.3. Other Building Types
- 10.1. Market Analysis, Insights and Forecast - by Application
- 11. North America Building Analytics Market Analysis, Insights and Forecast, 2019-2031
- 11.1. Market Analysis, Insights and Forecast - By Country/Sub-region
- 11.1.1.
- 12. Europe Building Analytics Market Analysis, Insights and Forecast, 2019-2031
- 12.1. Market Analysis, Insights and Forecast - By Country/Sub-region
- 12.1.1.
- 13. Asia Pacific Building Analytics Market Analysis, Insights and Forecast, 2019-2031
- 13.1. Market Analysis, Insights and Forecast - By Country/Sub-region
- 13.1.1.
- 14. Latin America Building Analytics Market Analysis, Insights and Forecast, 2019-2031
- 14.1. Market Analysis, Insights and Forecast - By Country/Sub-region
- 14.1.1.
- 15. Middle East and Africa Building Analytics Market Analysis, Insights and Forecast, 2019-2031
- 15.1. Market Analysis, Insights and Forecast - By Country/Sub-region
- 15.1.1.
- 16. Competitive Analysis
- 16.1. Global Market Share Analysis 2024
- 16.2. Company Profiles
- 16.2.1 ICONICS Inc
- 16.2.1.1. Overview
- 16.2.1.2. Products
- 16.2.1.3. SWOT Analysis
- 16.2.1.4. Recent Developments
- 16.2.1.5. Financials (Based on Availability)
- 16.2.2 Honeywell International Inc
- 16.2.2.1. Overview
- 16.2.2.2. Products
- 16.2.2.3. SWOT Analysis
- 16.2.2.4. Recent Developments
- 16.2.2.5. Financials (Based on Availability)
- 16.2.3 BuildPulse Inc
- 16.2.3.1. Overview
- 16.2.3.2. Products
- 16.2.3.3. SWOT Analysis
- 16.2.3.4. Recent Developments
- 16.2.3.5. Financials (Based on Availability)
- 16.2.4 Delta Electronics Inc
- 16.2.4.1. Overview
- 16.2.4.2. Products
- 16.2.4.3. SWOT Analysis
- 16.2.4.4. Recent Developments
- 16.2.4.5. Financials (Based on Availability)
- 16.2.5 IBM Corporation
- 16.2.5.1. Overview
- 16.2.5.2. Products
- 16.2.5.3. SWOT Analysis
- 16.2.5.4. Recent Developments
- 16.2.5.5. Financials (Based on Availability)
- 16.2.6 Crestron Electronics*List Not Exhaustive
- 16.2.6.1. Overview
- 16.2.6.2. Products
- 16.2.6.3. SWOT Analysis
- 16.2.6.4. Recent Developments
- 16.2.6.5. Financials (Based on Availability)
- 16.2.7 Noveda Technologies Inc
- 16.2.7.1. Overview
- 16.2.7.2. Products
- 16.2.7.3. SWOT Analysis
- 16.2.7.4. Recent Developments
- 16.2.7.5. Financials (Based on Availability)
- 16.2.8 CopperTree Analytics Inc
- 16.2.8.1. Overview
- 16.2.8.2. Products
- 16.2.8.3. SWOT Analysis
- 16.2.8.4. Recent Developments
- 16.2.8.5. Financials (Based on Availability)
- 16.2.9 Johnson Controls International Plc
- 16.2.9.1. Overview
- 16.2.9.2. Products
- 16.2.9.3. SWOT Analysis
- 16.2.9.4. Recent Developments
- 16.2.9.5. Financials (Based on Availability)
- 16.2.10 Siemens AG
- 16.2.10.1. Overview
- 16.2.10.2. Products
- 16.2.10.3. SWOT Analysis
- 16.2.10.4. Recent Developments
- 16.2.10.5. Financials (Based on Availability)
- 16.2.11 BuildingIQ
- 16.2.11.1. Overview
- 16.2.11.2. Products
- 16.2.11.3. SWOT Analysis
- 16.2.11.4. Recent Developments
- 16.2.11.5. Financials (Based on Availability)
- 16.2.12 GridPoint Inc
- 16.2.12.1. Overview
- 16.2.12.2. Products
- 16.2.12.3. SWOT Analysis
- 16.2.12.4. Recent Developments
- 16.2.12.5. Financials (Based on Availability)
- 16.2.13 Schneider Electric
- 16.2.13.1. Overview
- 16.2.13.2. Products
- 16.2.13.3. SWOT Analysis
- 16.2.13.4. Recent Developments
- 16.2.13.5. Financials (Based on Availability)
- 16.2.14 ENGIE Insight Services Inc
- 16.2.14.1. Overview
- 16.2.14.2. Products
- 16.2.14.3. SWOT Analysis
- 16.2.14.4. Recent Developments
- 16.2.14.5. Financials (Based on Availability)
- 16.2.15 General Electric Company
- 16.2.15.1. Overview
- 16.2.15.2. Products
- 16.2.15.3. SWOT Analysis
- 16.2.15.4. Recent Developments
- 16.2.15.5. Financials (Based on Availability)
- 16.2.1 ICONICS Inc
List of Figures
- Figure 1: Global Building Analytics Market Revenue Breakdown (Million, %) by Region 2024 & 2032
- Figure 2: North America Building Analytics Market Revenue (Million), by Country 2024 & 2032
- Figure 3: North America Building Analytics Market Revenue Share (%), by Country 2024 & 2032
- Figure 4: Europe Building Analytics Market Revenue (Million), by Country 2024 & 2032
- Figure 5: Europe Building Analytics Market Revenue Share (%), by Country 2024 & 2032
- Figure 6: Asia Pacific Building Analytics Market Revenue (Million), by Country 2024 & 2032
- Figure 7: Asia Pacific Building Analytics Market Revenue Share (%), by Country 2024 & 2032
- Figure 8: Latin America Building Analytics Market Revenue (Million), by Country 2024 & 2032
- Figure 9: Latin America Building Analytics Market Revenue Share (%), by Country 2024 & 2032
- Figure 10: Middle East and Africa Building Analytics Market Revenue (Million), by Country 2024 & 2032
- Figure 11: Middle East and Africa Building Analytics Market Revenue Share (%), by Country 2024 & 2032
- Figure 12: North America Building Analytics Market Revenue (Million), by Application 2024 & 2032
- Figure 13: North America Building Analytics Market Revenue Share (%), by Application 2024 & 2032
- Figure 14: North America Building Analytics Market Revenue (Million), by Component 2024 & 2032
- Figure 15: North America Building Analytics Market Revenue Share (%), by Component 2024 & 2032
- Figure 16: North America Building Analytics Market Revenue (Million), by Deployment Mode 2024 & 2032
- Figure 17: North America Building Analytics Market Revenue Share (%), by Deployment Mode 2024 & 2032
- Figure 18: North America Building Analytics Market Revenue (Million), by Building Type 2024 & 2032
- Figure 19: North America Building Analytics Market Revenue Share (%), by Building Type 2024 & 2032
- Figure 20: North America Building Analytics Market Revenue (Million), by Country 2024 & 2032
- Figure 21: North America Building Analytics Market Revenue Share (%), by Country 2024 & 2032
- Figure 22: Europe Building Analytics Market Revenue (Million), by Application 2024 & 2032
- Figure 23: Europe Building Analytics Market Revenue Share (%), by Application 2024 & 2032
- Figure 24: Europe Building Analytics Market Revenue (Million), by Component 2024 & 2032
- Figure 25: Europe Building Analytics Market Revenue Share (%), by Component 2024 & 2032
- Figure 26: Europe Building Analytics Market Revenue (Million), by Deployment Mode 2024 & 2032
- Figure 27: Europe Building Analytics Market Revenue Share (%), by Deployment Mode 2024 & 2032
- Figure 28: Europe Building Analytics Market Revenue (Million), by Building Type 2024 & 2032
- Figure 29: Europe Building Analytics Market Revenue Share (%), by Building Type 2024 & 2032
- Figure 30: Europe Building Analytics Market Revenue (Million), by Country 2024 & 2032
- Figure 31: Europe Building Analytics Market Revenue Share (%), by Country 2024 & 2032
- Figure 32: Asia Pacific Building Analytics Market Revenue (Million), by Application 2024 & 2032
- Figure 33: Asia Pacific Building Analytics Market Revenue Share (%), by Application 2024 & 2032
- Figure 34: Asia Pacific Building Analytics Market Revenue (Million), by Component 2024 & 2032
- Figure 35: Asia Pacific Building Analytics Market Revenue Share (%), by Component 2024 & 2032
- Figure 36: Asia Pacific Building Analytics Market Revenue (Million), by Deployment Mode 2024 & 2032
- Figure 37: Asia Pacific Building Analytics Market Revenue Share (%), by Deployment Mode 2024 & 2032
- Figure 38: Asia Pacific Building Analytics Market Revenue (Million), by Building Type 2024 & 2032
- Figure 39: Asia Pacific Building Analytics Market Revenue Share (%), by Building Type 2024 & 2032
- Figure 40: Asia Pacific Building Analytics Market Revenue (Million), by Country 2024 & 2032
- Figure 41: Asia Pacific Building Analytics Market Revenue Share (%), by Country 2024 & 2032
- Figure 42: Latin America Building Analytics Market Revenue (Million), by Application 2024 & 2032
- Figure 43: Latin America Building Analytics Market Revenue Share (%), by Application 2024 & 2032
- Figure 44: Latin America Building Analytics Market Revenue (Million), by Component 2024 & 2032
- Figure 45: Latin America Building Analytics Market Revenue Share (%), by Component 2024 & 2032
- Figure 46: Latin America Building Analytics Market Revenue (Million), by Deployment Mode 2024 & 2032
- Figure 47: Latin America Building Analytics Market Revenue Share (%), by Deployment Mode 2024 & 2032
- Figure 48: Latin America Building Analytics Market Revenue (Million), by Building Type 2024 & 2032
- Figure 49: Latin America Building Analytics Market Revenue Share (%), by Building Type 2024 & 2032
- Figure 50: Latin America Building Analytics Market Revenue (Million), by Country 2024 & 2032
- Figure 51: Latin America Building Analytics Market Revenue Share (%), by Country 2024 & 2032
- Figure 52: Middle East and Africa Building Analytics Market Revenue (Million), by Application 2024 & 2032
- Figure 53: Middle East and Africa Building Analytics Market Revenue Share (%), by Application 2024 & 2032
- Figure 54: Middle East and Africa Building Analytics Market Revenue (Million), by Component 2024 & 2032
- Figure 55: Middle East and Africa Building Analytics Market Revenue Share (%), by Component 2024 & 2032
- Figure 56: Middle East and Africa Building Analytics Market Revenue (Million), by Deployment Mode 2024 & 2032
- Figure 57: Middle East and Africa Building Analytics Market Revenue Share (%), by Deployment Mode 2024 & 2032
- Figure 58: Middle East and Africa Building Analytics Market Revenue (Million), by Building Type 2024 & 2032
- Figure 59: Middle East and Africa Building Analytics Market Revenue Share (%), by Building Type 2024 & 2032
- Figure 60: Middle East and Africa Building Analytics Market Revenue (Million), by Country 2024 & 2032
- Figure 61: Middle East and Africa Building Analytics Market Revenue Share (%), by Country 2024 & 2032
List of Tables
- Table 1: Global Building Analytics Market Revenue Million Forecast, by Region 2019 & 2032
- Table 2: Global Building Analytics Market Revenue Million Forecast, by Application 2019 & 2032
- Table 3: Global Building Analytics Market Revenue Million Forecast, by Component 2019 & 2032
- Table 4: Global Building Analytics Market Revenue Million Forecast, by Deployment Mode 2019 & 2032
- Table 5: Global Building Analytics Market Revenue Million Forecast, by Building Type 2019 & 2032
- Table 6: Global Building Analytics Market Revenue Million Forecast, by Region 2019 & 2032
- Table 7: Global Building Analytics Market Revenue Million Forecast, by Country 2019 & 2032
- Table 8: Building Analytics Market Revenue (Million) Forecast, by Application 2019 & 2032
- Table 9: Global Building Analytics Market Revenue Million Forecast, by Country 2019 & 2032
- Table 10: Building Analytics Market Revenue (Million) Forecast, by Application 2019 & 2032
- Table 11: Global Building Analytics Market Revenue Million Forecast, by Country 2019 & 2032
- Table 12: Building Analytics Market Revenue (Million) Forecast, by Application 2019 & 2032
- Table 13: Global Building Analytics Market Revenue Million Forecast, by Country 2019 & 2032
- Table 14: Building Analytics Market Revenue (Million) Forecast, by Application 2019 & 2032
- Table 15: Global Building Analytics Market Revenue Million Forecast, by Country 2019 & 2032
- Table 16: Building Analytics Market Revenue (Million) Forecast, by Application 2019 & 2032
- Table 17: Global Building Analytics Market Revenue Million Forecast, by Application 2019 & 2032
- Table 18: Global Building Analytics Market Revenue Million Forecast, by Component 2019 & 2032
- Table 19: Global Building Analytics Market Revenue Million Forecast, by Deployment Mode 2019 & 2032
- Table 20: Global Building Analytics Market Revenue Million Forecast, by Building Type 2019 & 2032
- Table 21: Global Building Analytics Market Revenue Million Forecast, by Country 2019 & 2032
- Table 22: Global Building Analytics Market Revenue Million Forecast, by Application 2019 & 2032
- Table 23: Global Building Analytics Market Revenue Million Forecast, by Component 2019 & 2032
- Table 24: Global Building Analytics Market Revenue Million Forecast, by Deployment Mode 2019 & 2032
- Table 25: Global Building Analytics Market Revenue Million Forecast, by Building Type 2019 & 2032
- Table 26: Global Building Analytics Market Revenue Million Forecast, by Country 2019 & 2032
- Table 27: Global Building Analytics Market Revenue Million Forecast, by Application 2019 & 2032
- Table 28: Global Building Analytics Market Revenue Million Forecast, by Component 2019 & 2032
- Table 29: Global Building Analytics Market Revenue Million Forecast, by Deployment Mode 2019 & 2032
- Table 30: Global Building Analytics Market Revenue Million Forecast, by Building Type 2019 & 2032
- Table 31: Global Building Analytics Market Revenue Million Forecast, by Country 2019 & 2032
- Table 32: Global Building Analytics Market Revenue Million Forecast, by Application 2019 & 2032
- Table 33: Global Building Analytics Market Revenue Million Forecast, by Component 2019 & 2032
- Table 34: Global Building Analytics Market Revenue Million Forecast, by Deployment Mode 2019 & 2032
- Table 35: Global Building Analytics Market Revenue Million Forecast, by Building Type 2019 & 2032
- Table 36: Global Building Analytics Market Revenue Million Forecast, by Country 2019 & 2032
- Table 37: Global Building Analytics Market Revenue Million Forecast, by Application 2019 & 2032
- Table 38: Global Building Analytics Market Revenue Million Forecast, by Component 2019 & 2032
- Table 39: Global Building Analytics Market Revenue Million Forecast, by Deployment Mode 2019 & 2032
- Table 40: Global Building Analytics Market Revenue Million Forecast, by Building Type 2019 & 2032
- Table 41: Global Building Analytics Market Revenue Million Forecast, by Country 2019 & 2032
Frequently Asked Questions
1. What is the projected Compound Annual Growth Rate (CAGR) of the Building Analytics Market?
The projected CAGR is approximately 14.70%.
2. Which companies are prominent players in the Building Analytics Market?
Key companies in the market include ICONICS Inc, Honeywell International Inc, BuildPulse Inc, Delta Electronics Inc, IBM Corporation, Crestron Electronics*List Not Exhaustive, Noveda Technologies Inc, CopperTree Analytics Inc, Johnson Controls International Plc, Siemens AG, BuildingIQ, GridPoint Inc, Schneider Electric, ENGIE Insight Services Inc, General Electric Company.
3. What are the main segments of the Building Analytics Market?
The market segments include Application, Component , Deployment Mode, Building Type.
4. Can you provide details about the market size?
The market size is estimated to be USD XX Million as of 2022.
5. What are some drivers contributing to market growth?
; Increased Demand for Energy-Efficient Systems; Growing Adoption of Cloud-Based IoT Platforms.
6. What are the notable trends driving market growth?
Energy Management Application to Hold the Largest Market Size.
7. Are there any restraints impacting market growth?
; High Cost of Implementation.
8. Can you provide examples of recent developments in the market?
N/A
9. What pricing options are available for accessing the report?
Pricing options include single-user, multi-user, and enterprise licenses priced at USD 4750, USD 5250, and USD 8750 respectively.
10. Is the market size provided in terms of value or volume?
The market size is provided in terms of value, measured in Million.
11. Are there any specific market keywords associated with the report?
Yes, the market keyword associated with the report is "Building Analytics Market," which aids in identifying and referencing the specific market segment covered.
12. How do I determine which pricing option suits my needs best?
The pricing options vary based on user requirements and access needs. Individual users may opt for single-user licenses, while businesses requiring broader access may choose multi-user or enterprise licenses for cost-effective access to the report.
13. Are there any additional resources or data provided in the Building Analytics Market report?
While the report offers comprehensive insights, it's advisable to review the specific contents or supplementary materials provided to ascertain if additional resources or data are available.
14. How can I stay updated on further developments or reports in the Building Analytics Market?
To stay informed about further developments, trends, and reports in the Building Analytics Market, consider subscribing to industry newsletters, following relevant companies and organizations, or regularly checking reputable industry news sources and publications.
Methodology
Step 1 - Identification of Relevant Samples Size from Population Database


Step 2 - Approaches for Defining Global Market Size (Value, Volume* & Price*)

Note*: In applicable scenarios
Step 3 - Data Sources
Primary Research
- Web Analytics
- Survey Reports
- Research Institute
- Latest Research Reports
- Opinion Leaders
Secondary Research
- Annual Reports
- White Paper
- Latest Press Release
- Industry Association
- Paid Database
- Investor Presentations

Step 4 - Data Triangulation
Involves using different sources of information in order to increase the validity of a study
These sources are likely to be stakeholders in a program - participants, other researchers, program staff, other community members, and so on.
Then we put all data in single framework & apply various statistical tools to find out the dynamic on the market.
During the analysis stage, feedback from the stakeholder groups would be compared to determine areas of agreement as well as areas of divergence


