
Key Insights
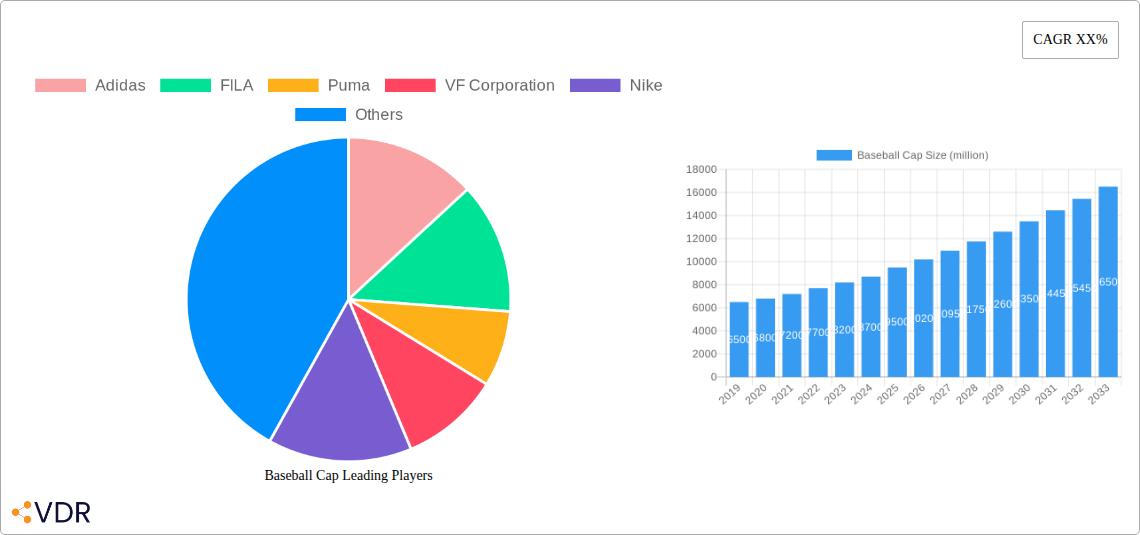
The global baseball cap market is poised for significant expansion, projected to reach approximately $9,500 million by 2025 and subsequently grow at a Compound Annual Growth Rate (CAGR) of around 7.5% through 2033. This robust growth is fueled by a confluence of factors, primarily the escalating demand for athleisure wear and the pervasive influence of street fashion. As comfort and style increasingly dictate consumer choices, the baseball cap has transcended its athletic origins to become a ubiquitous fashion accessory for all age groups and genders. The rising disposable incomes, particularly in emerging economies within the Asia Pacific and South America regions, are further contributing to market expansion. Moreover, the growing popularity of sports and outdoor activities, coupled with an increased focus on personal branding and individual expression through apparel, are key drivers propelling the market forward. The convenience of online retail channels, offering a vast selection and competitive pricing, is also playing a crucial role in making these versatile headwear accessible to a wider consumer base.
The market is characterized by distinct segmentation, catering to Men's, Women's, and Kids' types, each exhibiting unique growth trajectories influenced by evolving fashion trends and demographic shifts. While the Men's segment historically dominates, the Women's and Kids' segments are witnessing accelerated growth due to the democratization of fashion and the increasing influence of social media on style choices. Key players like Nike, Adidas, and Puma are at the forefront, leveraging brand loyalty and continuous product innovation to capture market share. The market, however, faces certain restraints, including the potential for market saturation in mature regions and the susceptibility to fluctuating raw material costs. Despite these challenges, the sustained appeal of baseball caps as a blend of functionality and fashion, supported by innovative designs, collaborations with influencers, and the expanding reach of e-commerce, ensures a dynamic and promising outlook for the global baseball cap industry.
Baseball Cap Market Dynamics & Structure
The global baseball cap market exhibits a moderate to high concentration, with major players like Nike, Adidas, FILA, Puma, VF Corporation, and New Era holding significant market shares. Technological innovation is primarily driven by advancements in materials science, leading to the development of breathable, moisture-wicking, and sustainable fabrics. Regulatory frameworks primarily focus on product safety and intellectual property rights, with minimal direct impact on market entry. Competitive product substitutes include other headwear categories like beanies and fedoras, though baseball caps maintain a strong foothold due to their versatility and style. End-user demographics are broad, encompassing fashion-conscious individuals, athletes, outdoor enthusiasts, and promotional merchandise buyers. Mergers and acquisitions (M&A) activity, while not exceptionally high, plays a role in market consolidation and expansion, with recent deals focusing on integrating online retail capabilities and sustainable manufacturing.
- Market Concentration: Dominated by a few key global brands, with regional players also contributing to market diversity.
- Technological Innovation: Focus on performance fabrics, eco-friendly materials, and smart features in premium segments.
- Regulatory Frameworks: Primarily governed by consumer protection laws and trademark regulations.
- Competitive Substitutes: Beanies, bucket hats, and casual hats offer alternative headwear options.
- End-User Demographics: Diverse, spanning all age groups and interest segments.
- M&A Trends: Strategic acquisitions to enhance e-commerce presence and supply chain efficiency.
Baseball Cap Growth Trends & Insights
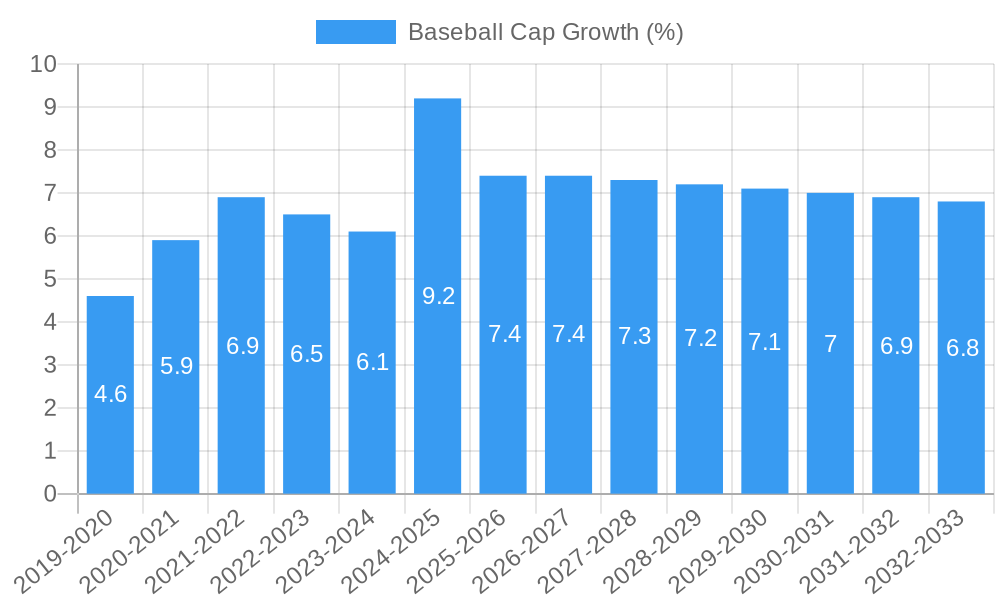
The global baseball cap market is poised for steady growth, driven by a confluence of evolving consumer preferences, expanding retail channels, and increasing participation in sports and outdoor activities. The market size is projected to witness a robust expansion, with an estimated Compound Annual Growth Rate (CAGR) of approximately 4.5% over the forecast period (2025–2033). This growth trajectory is underpinned by a significant increase in adoption rates, particularly among younger demographics who embrace baseball caps as a key fashion accessory. Technological disruptions are subtly influencing the market, with the integration of performance-enhancing features and the growing demand for sustainable and ethically sourced materials. Consumer behavior is shifting towards a greater emphasis on personalization and unique designs, driving demand for customized caps and limited-edition collaborations. The historical period (2019–2024) has laid a strong foundation, characterized by consistent year-on-year growth, albeit with fluctuations influenced by global events. The base year (2025) serves as a critical benchmark for future projections, indicating a healthy market momentum. The online channel's increasing dominance, coupled with the enduring appeal of offline retail experiences, contributes to the market's accessibility and penetration. This sustained demand, coupled with innovative product development, ensures a positive outlook for the baseball cap industry.
Dominant Regions, Countries, or Segments in Baseball Cap
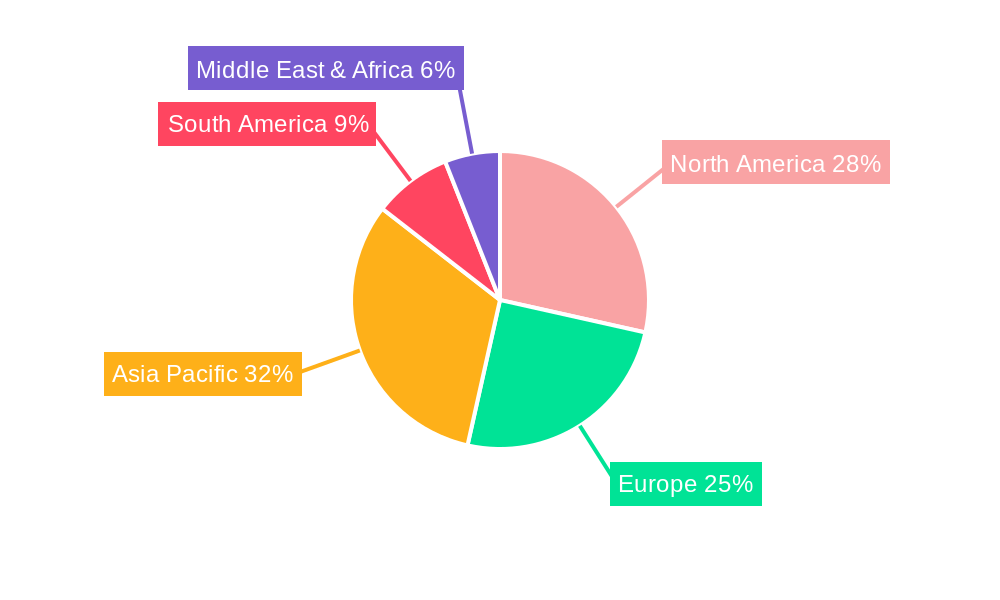
North America currently stands as the dominant region in the global baseball cap market, driven by a deeply ingrained sporting culture, a strong fashion-conscious consumer base, and a highly developed retail infrastructure. The United States, in particular, exhibits exceptionally high per capita consumption of baseball caps, fueled by the popularity of professional baseball leagues, casual streetwear trends, and a substantial market for sports merchandise. The Men's Type segment within this region contributes significantly to overall market value, reflecting a strong demand for athletic and casual headwear. However, the Women's Type and Kids' Type segments are experiencing accelerated growth, indicating a broadening appeal across all demographics. The robust presence of key players like Nike, Adidas, New Era, and VF Corporation with extensive distribution networks further solidifies North America's leading position. Economic policies that support disposable income and the accessibility of both online and offline channels, ranging from dedicated sporting goods stores to high-end fashion boutiques, also play a crucial role. The region's vibrant fashion industry constantly influences trends, driving demand for innovative designs and collaborations.
- North America's Dominance: Fueled by strong sporting culture, fashion influence, and advanced retail networks.
- United States as a Key Market: High per capita consumption due to sports popularity and streetwear trends.
- Men's Type Segment Strength: Historically a major contributor, driven by athletic and casual wear.
- Accelerated Growth in Women's & Kids' Types: Expanding market appeal and diversification of demand.
- Influence of Key Players: Nike, Adidas, New Era, VF Corporation are instrumental in market penetration.
- Economic & Retail Factors: High disposable income and a well-established multi-channel retail landscape.
- Fashion Industry Impact: Continuous trendsetting and demand for unique designs and collaborations.
- Market Share: Estimated to hold over 35% of the global market in the base year 2025.
- Growth Potential: Continued innovation and targeted marketing for growing segments will sustain growth.
Baseball Cap Product Landscape
The baseball cap product landscape is characterized by a diverse array of innovations catering to varied consumer needs. Beyond traditional cotton and polyester blends, advanced performance fabrics offering UV protection, breathability, and moisture-wicking properties are gaining traction. Applications range from high-performance athletic headwear designed for specific sports to fashion-forward accessories and promotional items. Unique selling propositions often revolve around iconic branding from companies like Harley-Davidson and Polo Ralph Lauren, sustainable material sourcing by brands such as Patagonia, and specialized designs by Goorin Bros for niche markets. Technological advancements include the integration of antimicrobial treatments and smart features in premium offerings.
Key Drivers, Barriers & Challenges in Baseball Cap
Key Drivers: The baseball cap market is propelled by the pervasive influence of athleisure wear, the sustained popularity of sports and outdoor activities, and the increasing adoption of baseball caps as a fashion statement across diverse age groups.
- Athleisure Trend: Integration into everyday fashion.
- Sports & Outdoor Participation: Increasing global interest.
- Fashion Accessory Appeal: Versatile styling options.
Key Barriers & Challenges: Supply chain disruptions and rising raw material costs can impact production and pricing. Intense competition from both established brands and emerging players, coupled with the need for continuous product innovation, presents significant challenges. Stringent quality control standards and potential intellectual property infringement issues also add to market complexities.
- Supply Chain Volatility: Affecting raw material availability and cost.
- Intense Competition: From established and new entrants.
- Innovation Demands: Need for constant product evolution.
- Quality Control & IP Issues: Ensuring compliance and protection.
Emerging Opportunities in Baseball Cap
Emerging opportunities lie in the burgeoning market for sustainable and eco-friendly baseball caps, driven by increasing consumer environmental consciousness. The rise of personalized and customizable cap options, leveraging advanced printing and embroidery technologies, presents a significant growth avenue. Furthermore, untapped markets in developing economies, coupled with the expansion of online retail channels in these regions, offer substantial potential for market penetration. Collaborations with influencers and artists are also proving effective in creating buzz and driving demand for niche and limited-edition collections.
Growth Accelerators in the Baseball Cap Industry
Growth accelerators in the baseball cap industry are significantly bolstered by ongoing technological breakthroughs in fabric innovation, enabling the creation of lighter, more durable, and functional headwear. Strategic partnerships between apparel brands and sports leagues or entertainment franchises continue to drive brand visibility and product demand. Furthermore, aggressive market expansion strategies, particularly into emerging economies and through the robust growth of e-commerce platforms, are key catalysts for sustained long-term growth. The increasing demand for licensed merchandise from popular culture also acts as a potent growth driver.
Key Players Shaping the Baseball Cap Market
- Adidas
- FILA
- Puma
- VF Corporation
- Nike
- New Era
- Carhartt
- Columbia
- Goorin Bros
- Harley-Davidson
- Kangol
- Patagonia
- Polo Ralph Lauren
- IDC group
- Lining
- The North Face
Notable Milestones in Baseball Cap Sector
- 2019: Increased adoption of performance fabrics in athletic caps.
- 2020: Surge in online sales of baseball caps due to global lockdowns.
- 2021: Growing emphasis on sustainable and recycled materials in cap manufacturing.
- 2022: Expansion of licensed cap collections for popular sports and entertainment franchises.
- 2023: Rise of collaborations between sportswear brands and high-fashion designers.
- 2024: Advancements in customization technologies for personalized cap production.
In-Depth Baseball Cap Market Outlook
The in-depth baseball cap market outlook remains exceptionally positive, driven by the persistent trend of athleisure, the growing global enthusiasm for sports and outdoor activities, and the enduring appeal of baseball caps as versatile fashion accessories. Future market potential will be significantly shaped by ongoing innovations in sustainable materials, which align with increasing consumer demand for eco-conscious products. Strategic opportunities abound in expanding e-commerce reach, particularly in developing regions, and in fostering unique collaborations that cater to niche consumer segments and create aspirational brand associations. The market's ability to adapt to evolving fashion trends and integrate technological advancements will be paramount to sustained growth and increased market penetration.
Baseball Cap Segmentation
-
1. Application
- 1.1. Online Channel
- 1.2. Offline Channel
-
2. Types
- 2.1. Men’s Type
- 2.2. Women’s Type
- 2.3. Kids’ Type
Baseball Cap Segmentation By Geography
-
1. North America
- 1.1. United States
- 1.2. Canada
- 1.3. Mexico
-
2. South America
- 2.1. Brazil
- 2.2. Argentina
- 2.3. Rest of South America
-
3. Europe
- 3.1. United Kingdom
- 3.2. Germany
- 3.3. France
- 3.4. Italy
- 3.5. Spain
- 3.6. Russia
- 3.7. Benelux
- 3.8. Nordics
- 3.9. Rest of Europe
-
4. Middle East & Africa
- 4.1. Turkey
- 4.2. Israel
- 4.3. GCC
- 4.4. North Africa
- 4.5. South Africa
- 4.6. Rest of Middle East & Africa
-
5. Asia Pacific
- 5.1. China
- 5.2. India
- 5.3. Japan
- 5.4. South Korea
- 5.5. ASEAN
- 5.6. Oceania
- 5.7. Rest of Asia Pacific
Baseball Cap REPORT HIGHLIGHTS
| Aspects | Details |
|---|---|
| Study Period | 2019-2033 |
| Base Year | 2024 |
| Estimated Year | 2025 |
| Forecast Period | 2025-2033 |
| Historical Period | 2019-2024 |
| Growth Rate | CAGR of XX% from 2019-2033 |
| Segmentation |
|
Table of Contents
- 1. Introduction
- 1.1. Research Scope
- 1.2. Market Segmentation
- 1.3. Research Methodology
- 1.4. Definitions and Assumptions
- 2. Executive Summary
- 2.1. Introduction
- 3. Market Dynamics
- 3.1. Introduction
- 3.2. Market Drivers
- 3.3. Market Restrains
- 3.4. Market Trends
- 4. Market Factor Analysis
- 4.1. Porters Five Forces
- 4.2. Supply/Value Chain
- 4.3. PESTEL analysis
- 4.4. Market Entropy
- 4.5. Patent/Trademark Analysis
- 5. Global Baseball Cap Analysis, Insights and Forecast, 2019-2031
- 5.1. Market Analysis, Insights and Forecast - by Application
- 5.1.1. Online Channel
- 5.1.2. Offline Channel
- 5.2. Market Analysis, Insights and Forecast - by Types
- 5.2.1. Men’s Type
- 5.2.2. Women’s Type
- 5.2.3. Kids’ Type
- 5.3. Market Analysis, Insights and Forecast - by Region
- 5.3.1. North America
- 5.3.2. South America
- 5.3.3. Europe
- 5.3.4. Middle East & Africa
- 5.3.5. Asia Pacific
- 5.1. Market Analysis, Insights and Forecast - by Application
- 6. North America Baseball Cap Analysis, Insights and Forecast, 2019-2031
- 6.1. Market Analysis, Insights and Forecast - by Application
- 6.1.1. Online Channel
- 6.1.2. Offline Channel
- 6.2. Market Analysis, Insights and Forecast - by Types
- 6.2.1. Men’s Type
- 6.2.2. Women’s Type
- 6.2.3. Kids’ Type
- 6.1. Market Analysis, Insights and Forecast - by Application
- 7. South America Baseball Cap Analysis, Insights and Forecast, 2019-2031
- 7.1. Market Analysis, Insights and Forecast - by Application
- 7.1.1. Online Channel
- 7.1.2. Offline Channel
- 7.2. Market Analysis, Insights and Forecast - by Types
- 7.2.1. Men’s Type
- 7.2.2. Women’s Type
- 7.2.3. Kids’ Type
- 7.1. Market Analysis, Insights and Forecast - by Application
- 8. Europe Baseball Cap Analysis, Insights and Forecast, 2019-2031
- 8.1. Market Analysis, Insights and Forecast - by Application
- 8.1.1. Online Channel
- 8.1.2. Offline Channel
- 8.2. Market Analysis, Insights and Forecast - by Types
- 8.2.1. Men’s Type
- 8.2.2. Women’s Type
- 8.2.3. Kids’ Type
- 8.1. Market Analysis, Insights and Forecast - by Application
- 9. Middle East & Africa Baseball Cap Analysis, Insights and Forecast, 2019-2031
- 9.1. Market Analysis, Insights and Forecast - by Application
- 9.1.1. Online Channel
- 9.1.2. Offline Channel
- 9.2. Market Analysis, Insights and Forecast - by Types
- 9.2.1. Men’s Type
- 9.2.2. Women’s Type
- 9.2.3. Kids’ Type
- 9.1. Market Analysis, Insights and Forecast - by Application
- 10. Asia Pacific Baseball Cap Analysis, Insights and Forecast, 2019-2031
- 10.1. Market Analysis, Insights and Forecast - by Application
- 10.1.1. Online Channel
- 10.1.2. Offline Channel
- 10.2. Market Analysis, Insights and Forecast - by Types
- 10.2.1. Men’s Type
- 10.2.2. Women’s Type
- 10.2.3. Kids’ Type
- 10.1. Market Analysis, Insights and Forecast - by Application
- 11. Competitive Analysis
- 11.1. Global Market Share Analysis 2024
- 11.2. Company Profiles
- 11.2.1 Adidas
- 11.2.1.1. Overview
- 11.2.1.2. Products
- 11.2.1.3. SWOT Analysis
- 11.2.1.4. Recent Developments
- 11.2.1.5. Financials (Based on Availability)
- 11.2.2 FILA
- 11.2.2.1. Overview
- 11.2.2.2. Products
- 11.2.2.3. SWOT Analysis
- 11.2.2.4. Recent Developments
- 11.2.2.5. Financials (Based on Availability)
- 11.2.3 Puma
- 11.2.3.1. Overview
- 11.2.3.2. Products
- 11.2.3.3. SWOT Analysis
- 11.2.3.4. Recent Developments
- 11.2.3.5. Financials (Based on Availability)
- 11.2.4 VF Corporation
- 11.2.4.1. Overview
- 11.2.4.2. Products
- 11.2.4.3. SWOT Analysis
- 11.2.4.4. Recent Developments
- 11.2.4.5. Financials (Based on Availability)
- 11.2.5 Nike
- 11.2.5.1. Overview
- 11.2.5.2. Products
- 11.2.5.3. SWOT Analysis
- 11.2.5.4. Recent Developments
- 11.2.5.5. Financials (Based on Availability)
- 11.2.6 New Era
- 11.2.6.1. Overview
- 11.2.6.2. Products
- 11.2.6.3. SWOT Analysis
- 11.2.6.4. Recent Developments
- 11.2.6.5. Financials (Based on Availability)
- 11.2.7 Carhartt
- 11.2.7.1. Overview
- 11.2.7.2. Products
- 11.2.7.3. SWOT Analysis
- 11.2.7.4. Recent Developments
- 11.2.7.5. Financials (Based on Availability)
- 11.2.8 Columbia
- 11.2.8.1. Overview
- 11.2.8.2. Products
- 11.2.8.3. SWOT Analysis
- 11.2.8.4. Recent Developments
- 11.2.8.5. Financials (Based on Availability)
- 11.2.9 Goorin Bros
- 11.2.9.1. Overview
- 11.2.9.2. Products
- 11.2.9.3. SWOT Analysis
- 11.2.9.4. Recent Developments
- 11.2.9.5. Financials (Based on Availability)
- 11.2.10 Harley-Davidson
- 11.2.10.1. Overview
- 11.2.10.2. Products
- 11.2.10.3. SWOT Analysis
- 11.2.10.4. Recent Developments
- 11.2.10.5. Financials (Based on Availability)
- 11.2.11 Kangol
- 11.2.11.1. Overview
- 11.2.11.2. Products
- 11.2.11.3. SWOT Analysis
- 11.2.11.4. Recent Developments
- 11.2.11.5. Financials (Based on Availability)
- 11.2.12 Patagonia
- 11.2.12.1. Overview
- 11.2.12.2. Products
- 11.2.12.3. SWOT Analysis
- 11.2.12.4. Recent Developments
- 11.2.12.5. Financials (Based on Availability)
- 11.2.13 Polo Ralph Lauren
- 11.2.13.1. Overview
- 11.2.13.2. Products
- 11.2.13.3. SWOT Analysis
- 11.2.13.4. Recent Developments
- 11.2.13.5. Financials (Based on Availability)
- 11.2.14 IDC group
- 11.2.14.1. Overview
- 11.2.14.2. Products
- 11.2.14.3. SWOT Analysis
- 11.2.14.4. Recent Developments
- 11.2.14.5. Financials (Based on Availability)
- 11.2.15 Lining
- 11.2.15.1. Overview
- 11.2.15.2. Products
- 11.2.15.3. SWOT Analysis
- 11.2.15.4. Recent Developments
- 11.2.15.5. Financials (Based on Availability)
- 11.2.16 The North Face
- 11.2.16.1. Overview
- 11.2.16.2. Products
- 11.2.16.3. SWOT Analysis
- 11.2.16.4. Recent Developments
- 11.2.16.5. Financials (Based on Availability)
- 11.2.1 Adidas
List of Figures
- Figure 1: Global Baseball Cap Revenue Breakdown (million, %) by Region 2024 & 2032
- Figure 2: Global Baseball Cap Volume Breakdown (K, %) by Region 2024 & 2032
- Figure 3: North America Baseball Cap Revenue (million), by Application 2024 & 2032
- Figure 4: North America Baseball Cap Volume (K), by Application 2024 & 2032
- Figure 5: North America Baseball Cap Revenue Share (%), by Application 2024 & 2032
- Figure 6: North America Baseball Cap Volume Share (%), by Application 2024 & 2032
- Figure 7: North America Baseball Cap Revenue (million), by Types 2024 & 2032
- Figure 8: North America Baseball Cap Volume (K), by Types 2024 & 2032
- Figure 9: North America Baseball Cap Revenue Share (%), by Types 2024 & 2032
- Figure 10: North America Baseball Cap Volume Share (%), by Types 2024 & 2032
- Figure 11: North America Baseball Cap Revenue (million), by Country 2024 & 2032
- Figure 12: North America Baseball Cap Volume (K), by Country 2024 & 2032
- Figure 13: North America Baseball Cap Revenue Share (%), by Country 2024 & 2032
- Figure 14: North America Baseball Cap Volume Share (%), by Country 2024 & 2032
- Figure 15: South America Baseball Cap Revenue (million), by Application 2024 & 2032
- Figure 16: South America Baseball Cap Volume (K), by Application 2024 & 2032
- Figure 17: South America Baseball Cap Revenue Share (%), by Application 2024 & 2032
- Figure 18: South America Baseball Cap Volume Share (%), by Application 2024 & 2032
- Figure 19: South America Baseball Cap Revenue (million), by Types 2024 & 2032
- Figure 20: South America Baseball Cap Volume (K), by Types 2024 & 2032
- Figure 21: South America Baseball Cap Revenue Share (%), by Types 2024 & 2032
- Figure 22: South America Baseball Cap Volume Share (%), by Types 2024 & 2032
- Figure 23: South America Baseball Cap Revenue (million), by Country 2024 & 2032
- Figure 24: South America Baseball Cap Volume (K), by Country 2024 & 2032
- Figure 25: South America Baseball Cap Revenue Share (%), by Country 2024 & 2032
- Figure 26: South America Baseball Cap Volume Share (%), by Country 2024 & 2032
- Figure 27: Europe Baseball Cap Revenue (million), by Application 2024 & 2032
- Figure 28: Europe Baseball Cap Volume (K), by Application 2024 & 2032
- Figure 29: Europe Baseball Cap Revenue Share (%), by Application 2024 & 2032
- Figure 30: Europe Baseball Cap Volume Share (%), by Application 2024 & 2032
- Figure 31: Europe Baseball Cap Revenue (million), by Types 2024 & 2032
- Figure 32: Europe Baseball Cap Volume (K), by Types 2024 & 2032
- Figure 33: Europe Baseball Cap Revenue Share (%), by Types 2024 & 2032
- Figure 34: Europe Baseball Cap Volume Share (%), by Types 2024 & 2032
- Figure 35: Europe Baseball Cap Revenue (million), by Country 2024 & 2032
- Figure 36: Europe Baseball Cap Volume (K), by Country 2024 & 2032
- Figure 37: Europe Baseball Cap Revenue Share (%), by Country 2024 & 2032
- Figure 38: Europe Baseball Cap Volume Share (%), by Country 2024 & 2032
- Figure 39: Middle East & Africa Baseball Cap Revenue (million), by Application 2024 & 2032
- Figure 40: Middle East & Africa Baseball Cap Volume (K), by Application 2024 & 2032
- Figure 41: Middle East & Africa Baseball Cap Revenue Share (%), by Application 2024 & 2032
- Figure 42: Middle East & Africa Baseball Cap Volume Share (%), by Application 2024 & 2032
- Figure 43: Middle East & Africa Baseball Cap Revenue (million), by Types 2024 & 2032
- Figure 44: Middle East & Africa Baseball Cap Volume (K), by Types 2024 & 2032
- Figure 45: Middle East & Africa Baseball Cap Revenue Share (%), by Types 2024 & 2032
- Figure 46: Middle East & Africa Baseball Cap Volume Share (%), by Types 2024 & 2032
- Figure 47: Middle East & Africa Baseball Cap Revenue (million), by Country 2024 & 2032
- Figure 48: Middle East & Africa Baseball Cap Volume (K), by Country 2024 & 2032
- Figure 49: Middle East & Africa Baseball Cap Revenue Share (%), by Country 2024 & 2032
- Figure 50: Middle East & Africa Baseball Cap Volume Share (%), by Country 2024 & 2032
- Figure 51: Asia Pacific Baseball Cap Revenue (million), by Application 2024 & 2032
- Figure 52: Asia Pacific Baseball Cap Volume (K), by Application 2024 & 2032
- Figure 53: Asia Pacific Baseball Cap Revenue Share (%), by Application 2024 & 2032
- Figure 54: Asia Pacific Baseball Cap Volume Share (%), by Application 2024 & 2032
- Figure 55: Asia Pacific Baseball Cap Revenue (million), by Types 2024 & 2032
- Figure 56: Asia Pacific Baseball Cap Volume (K), by Types 2024 & 2032
- Figure 57: Asia Pacific Baseball Cap Revenue Share (%), by Types 2024 & 2032
- Figure 58: Asia Pacific Baseball Cap Volume Share (%), by Types 2024 & 2032
- Figure 59: Asia Pacific Baseball Cap Revenue (million), by Country 2024 & 2032
- Figure 60: Asia Pacific Baseball Cap Volume (K), by Country 2024 & 2032
- Figure 61: Asia Pacific Baseball Cap Revenue Share (%), by Country 2024 & 2032
- Figure 62: Asia Pacific Baseball Cap Volume Share (%), by Country 2024 & 2032
List of Tables
- Table 1: Global Baseball Cap Revenue million Forecast, by Region 2019 & 2032
- Table 2: Global Baseball Cap Volume K Forecast, by Region 2019 & 2032
- Table 3: Global Baseball Cap Revenue million Forecast, by Application 2019 & 2032
- Table 4: Global Baseball Cap Volume K Forecast, by Application 2019 & 2032
- Table 5: Global Baseball Cap Revenue million Forecast, by Types 2019 & 2032
- Table 6: Global Baseball Cap Volume K Forecast, by Types 2019 & 2032
- Table 7: Global Baseball Cap Revenue million Forecast, by Region 2019 & 2032
- Table 8: Global Baseball Cap Volume K Forecast, by Region 2019 & 2032
- Table 9: Global Baseball Cap Revenue million Forecast, by Application 2019 & 2032
- Table 10: Global Baseball Cap Volume K Forecast, by Application 2019 & 2032
- Table 11: Global Baseball Cap Revenue million Forecast, by Types 2019 & 2032
- Table 12: Global Baseball Cap Volume K Forecast, by Types 2019 & 2032
- Table 13: Global Baseball Cap Revenue million Forecast, by Country 2019 & 2032
- Table 14: Global Baseball Cap Volume K Forecast, by Country 2019 & 2032
- Table 15: United States Baseball Cap Revenue (million) Forecast, by Application 2019 & 2032
- Table 16: United States Baseball Cap Volume (K) Forecast, by Application 2019 & 2032
- Table 17: Canada Baseball Cap Revenue (million) Forecast, by Application 2019 & 2032
- Table 18: Canada Baseball Cap Volume (K) Forecast, by Application 2019 & 2032
- Table 19: Mexico Baseball Cap Revenue (million) Forecast, by Application 2019 & 2032
- Table 20: Mexico Baseball Cap Volume (K) Forecast, by Application 2019 & 2032
- Table 21: Global Baseball Cap Revenue million Forecast, by Application 2019 & 2032
- Table 22: Global Baseball Cap Volume K Forecast, by Application 2019 & 2032
- Table 23: Global Baseball Cap Revenue million Forecast, by Types 2019 & 2032
- Table 24: Global Baseball Cap Volume K Forecast, by Types 2019 & 2032
- Table 25: Global Baseball Cap Revenue million Forecast, by Country 2019 & 2032
- Table 26: Global Baseball Cap Volume K Forecast, by Country 2019 & 2032
- Table 27: Brazil Baseball Cap Revenue (million) Forecast, by Application 2019 & 2032
- Table 28: Brazil Baseball Cap Volume (K) Forecast, by Application 2019 & 2032
- Table 29: Argentina Baseball Cap Revenue (million) Forecast, by Application 2019 & 2032
- Table 30: Argentina Baseball Cap Volume (K) Forecast, by Application 2019 & 2032
- Table 31: Rest of South America Baseball Cap Revenue (million) Forecast, by Application 2019 & 2032
- Table 32: Rest of South America Baseball Cap Volume (K) Forecast, by Application 2019 & 2032
- Table 33: Global Baseball Cap Revenue million Forecast, by Application 2019 & 2032
- Table 34: Global Baseball Cap Volume K Forecast, by Application 2019 & 2032
- Table 35: Global Baseball Cap Revenue million Forecast, by Types 2019 & 2032
- Table 36: Global Baseball Cap Volume K Forecast, by Types 2019 & 2032
- Table 37: Global Baseball Cap Revenue million Forecast, by Country 2019 & 2032
- Table 38: Global Baseball Cap Volume K Forecast, by Country 2019 & 2032
- Table 39: United Kingdom Baseball Cap Revenue (million) Forecast, by Application 2019 & 2032
- Table 40: United Kingdom Baseball Cap Volume (K) Forecast, by Application 2019 & 2032
- Table 41: Germany Baseball Cap Revenue (million) Forecast, by Application 2019 & 2032
- Table 42: Germany Baseball Cap Volume (K) Forecast, by Application 2019 & 2032
- Table 43: France Baseball Cap Revenue (million) Forecast, by Application 2019 & 2032
- Table 44: France Baseball Cap Volume (K) Forecast, by Application 2019 & 2032
- Table 45: Italy Baseball Cap Revenue (million) Forecast, by Application 2019 & 2032
- Table 46: Italy Baseball Cap Volume (K) Forecast, by Application 2019 & 2032
- Table 47: Spain Baseball Cap Revenue (million) Forecast, by Application 2019 & 2032
- Table 48: Spain Baseball Cap Volume (K) Forecast, by Application 2019 & 2032
- Table 49: Russia Baseball Cap Revenue (million) Forecast, by Application 2019 & 2032
- Table 50: Russia Baseball Cap Volume (K) Forecast, by Application 2019 & 2032
- Table 51: Benelux Baseball Cap Revenue (million) Forecast, by Application 2019 & 2032
- Table 52: Benelux Baseball Cap Volume (K) Forecast, by Application 2019 & 2032
- Table 53: Nordics Baseball Cap Revenue (million) Forecast, by Application 2019 & 2032
- Table 54: Nordics Baseball Cap Volume (K) Forecast, by Application 2019 & 2032
- Table 55: Rest of Europe Baseball Cap Revenue (million) Forecast, by Application 2019 & 2032
- Table 56: Rest of Europe Baseball Cap Volume (K) Forecast, by Application 2019 & 2032
- Table 57: Global Baseball Cap Revenue million Forecast, by Application 2019 & 2032
- Table 58: Global Baseball Cap Volume K Forecast, by Application 2019 & 2032
- Table 59: Global Baseball Cap Revenue million Forecast, by Types 2019 & 2032
- Table 60: Global Baseball Cap Volume K Forecast, by Types 2019 & 2032
- Table 61: Global Baseball Cap Revenue million Forecast, by Country 2019 & 2032
- Table 62: Global Baseball Cap Volume K Forecast, by Country 2019 & 2032
- Table 63: Turkey Baseball Cap Revenue (million) Forecast, by Application 2019 & 2032
- Table 64: Turkey Baseball Cap Volume (K) Forecast, by Application 2019 & 2032
- Table 65: Israel Baseball Cap Revenue (million) Forecast, by Application 2019 & 2032
- Table 66: Israel Baseball Cap Volume (K) Forecast, by Application 2019 & 2032
- Table 67: GCC Baseball Cap Revenue (million) Forecast, by Application 2019 & 2032
- Table 68: GCC Baseball Cap Volume (K) Forecast, by Application 2019 & 2032
- Table 69: North Africa Baseball Cap Revenue (million) Forecast, by Application 2019 & 2032
- Table 70: North Africa Baseball Cap Volume (K) Forecast, by Application 2019 & 2032
- Table 71: South Africa Baseball Cap Revenue (million) Forecast, by Application 2019 & 2032
- Table 72: South Africa Baseball Cap Volume (K) Forecast, by Application 2019 & 2032
- Table 73: Rest of Middle East & Africa Baseball Cap Revenue (million) Forecast, by Application 2019 & 2032
- Table 74: Rest of Middle East & Africa Baseball Cap Volume (K) Forecast, by Application 2019 & 2032
- Table 75: Global Baseball Cap Revenue million Forecast, by Application 2019 & 2032
- Table 76: Global Baseball Cap Volume K Forecast, by Application 2019 & 2032
- Table 77: Global Baseball Cap Revenue million Forecast, by Types 2019 & 2032
- Table 78: Global Baseball Cap Volume K Forecast, by Types 2019 & 2032
- Table 79: Global Baseball Cap Revenue million Forecast, by Country 2019 & 2032
- Table 80: Global Baseball Cap Volume K Forecast, by Country 2019 & 2032
- Table 81: China Baseball Cap Revenue (million) Forecast, by Application 2019 & 2032
- Table 82: China Baseball Cap Volume (K) Forecast, by Application 2019 & 2032
- Table 83: India Baseball Cap Revenue (million) Forecast, by Application 2019 & 2032
- Table 84: India Baseball Cap Volume (K) Forecast, by Application 2019 & 2032
- Table 85: Japan Baseball Cap Revenue (million) Forecast, by Application 2019 & 2032
- Table 86: Japan Baseball Cap Volume (K) Forecast, by Application 2019 & 2032
- Table 87: South Korea Baseball Cap Revenue (million) Forecast, by Application 2019 & 2032
- Table 88: South Korea Baseball Cap Volume (K) Forecast, by Application 2019 & 2032
- Table 89: ASEAN Baseball Cap Revenue (million) Forecast, by Application 2019 & 2032
- Table 90: ASEAN Baseball Cap Volume (K) Forecast, by Application 2019 & 2032
- Table 91: Oceania Baseball Cap Revenue (million) Forecast, by Application 2019 & 2032
- Table 92: Oceania Baseball Cap Volume (K) Forecast, by Application 2019 & 2032
- Table 93: Rest of Asia Pacific Baseball Cap Revenue (million) Forecast, by Application 2019 & 2032
- Table 94: Rest of Asia Pacific Baseball Cap Volume (K) Forecast, by Application 2019 & 2032
Frequently Asked Questions
1. What is the projected Compound Annual Growth Rate (CAGR) of the Baseball Cap?
The projected CAGR is approximately XX%.
2. Which companies are prominent players in the Baseball Cap?
Key companies in the market include Adidas, FILA, Puma, VF Corporation, Nike, New Era, Carhartt, Columbia, Goorin Bros, Harley-Davidson, Kangol, Patagonia, Polo Ralph Lauren, IDC group, Lining, The North Face.
3. What are the main segments of the Baseball Cap?
The market segments include Application, Types.
4. Can you provide details about the market size?
The market size is estimated to be USD XXX million as of 2022.
5. What are some drivers contributing to market growth?
N/A
6. What are the notable trends driving market growth?
N/A
7. Are there any restraints impacting market growth?
N/A
8. Can you provide examples of recent developments in the market?
N/A
9. What pricing options are available for accessing the report?
Pricing options include single-user, multi-user, and enterprise licenses priced at USD 3950.00, USD 5925.00, and USD 7900.00 respectively.
10. Is the market size provided in terms of value or volume?
The market size is provided in terms of value, measured in million and volume, measured in K.
11. Are there any specific market keywords associated with the report?
Yes, the market keyword associated with the report is "Baseball Cap," which aids in identifying and referencing the specific market segment covered.
12. How do I determine which pricing option suits my needs best?
The pricing options vary based on user requirements and access needs. Individual users may opt for single-user licenses, while businesses requiring broader access may choose multi-user or enterprise licenses for cost-effective access to the report.
13. Are there any additional resources or data provided in the Baseball Cap report?
While the report offers comprehensive insights, it's advisable to review the specific contents or supplementary materials provided to ascertain if additional resources or data are available.
14. How can I stay updated on further developments or reports in the Baseball Cap?
To stay informed about further developments, trends, and reports in the Baseball Cap, consider subscribing to industry newsletters, following relevant companies and organizations, or regularly checking reputable industry news sources and publications.
Methodology
Step 1 - Identification of Relevant Samples Size from Population Database


Step 2 - Approaches for Defining Global Market Size (Value, Volume* & Price*)

Note*: In applicable scenarios
Step 3 - Data Sources
Primary Research
- Web Analytics
- Survey Reports
- Research Institute
- Latest Research Reports
- Opinion Leaders
Secondary Research
- Annual Reports
- White Paper
- Latest Press Release
- Industry Association
- Paid Database
- Investor Presentations

Step 4 - Data Triangulation
Involves using different sources of information in order to increase the validity of a study
These sources are likely to be stakeholders in a program - participants, other researchers, program staff, other community members, and so on.
Then we put all data in single framework & apply various statistical tools to find out the dynamic on the market.
During the analysis stage, feedback from the stakeholder groups would be compared to determine areas of agreement as well as areas of divergence


