

Key Insights
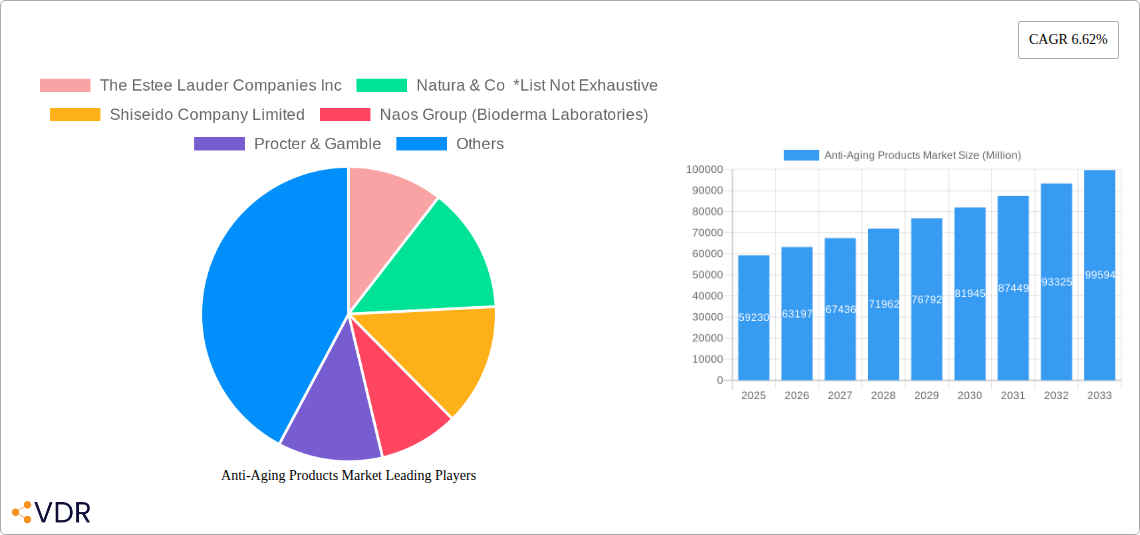
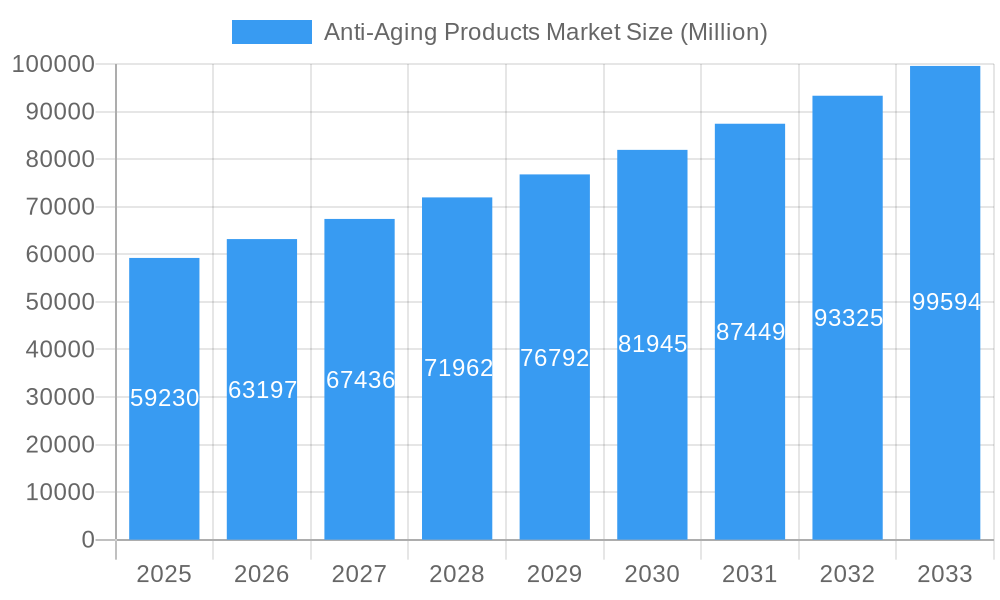
The global anti-aging products market, valued at $59.23 billion in 2025, is projected to experience robust growth, driven by a rising geriatric population and increasing awareness of skincare solutions. A compound annual growth rate (CAGR) of 6.62% from 2025 to 2033 signifies a considerable market expansion. Key drivers include the escalating demand for effective anti-aging solutions, a surge in disposable incomes, particularly in developing economies, fueling consumer spending on premium skincare products, and the expanding online retail channels offering convenient access to a wider product range. Significant trends include the incorporation of advanced technologies like stem cells and peptides in formulations, a growing preference for natural and organic ingredients, personalized skincare regimens, and a focus on preventative anti-aging strategies targeting younger demographics. However, market restraints include potential side effects associated with certain ingredients, stringent regulatory approvals for new product launches, and the fluctuating prices of raw materials impacting overall product costs. Market segmentation reveals facial creams and lotions hold the largest share in the product type segment, while online retail channels are witnessing substantial growth in distribution. Major players such as Estée Lauder, L'Oréal, and Shiseido are leveraging innovation and strategic marketing to maintain their market dominance. Regional analysis indicates North America and Europe are currently leading the market, but the Asia-Pacific region shows exceptional growth potential due to rapid economic development and changing lifestyle preferences.
Anti-Aging Products Market Market Size (In Billion)
The market's future trajectory is influenced by several factors. The increasing adoption of advanced technologies for anti-aging solutions will continue to fuel innovation and market expansion. The heightened consumer awareness concerning the harmful effects of UV radiation is driving demand for sunscreens with anti-aging properties, a segment likely to experience significant growth. Similarly, the expanding male grooming market represents a lucrative segment for future expansion. The evolving consumer preferences towards clean beauty and sustainable practices will place further pressure on manufacturers to adopt eco-friendly formulations and packaging. Companies are increasingly adopting personalized marketing strategies, using data analytics to cater to individual customer preferences and needs, enhancing brand loyalty and consumer engagement. Competition is expected to intensify as new players enter the market and existing companies focus on product differentiation and diversification. A proactive approach to addressing regulatory compliance and consumer safety concerns will be vital for long-term market success.
Anti-Aging Products Market Company Market Share
Anti-Aging Products Market Report: 2019-2033
This comprehensive report provides a detailed analysis of the global anti-aging products market, encompassing market size, growth trends, competitive landscape, and future outlook. The report covers the period from 2019 to 2033, with a focus on the forecast period 2025-2033 and a base year of 2025. It segments the market by product type (facial creams and lotions, serums and concentrates, under-eye creams, others) and distribution channel (supermarkets/hypermarkets, specialty stores, pharmacies/drug stores, online retail stores, other channels), providing granular insights into key market drivers and challenges. Leading players like The Estée Lauder Companies Inc., Natura & Co, Shiseido Company Limited, Naos Group (Bioderma Laboratories), Procter & Gamble, Caudalie, L'Oréal SA, Groupe Clarins, Beiersdorf Limited, and Oriflame Cosmetics AG are profiled, offering a competitive overview. This report is an essential resource for industry professionals, investors, and anyone seeking to understand the dynamics of this rapidly evolving market.
Anti-Aging Products Market Dynamics & Structure
The global anti-aging products market is characterized by moderate concentration, with several large multinational companies holding significant market share. Technological innovation, particularly in active ingredients and delivery systems, is a key driver. Regulatory frameworks vary across regions, influencing product development and marketing claims. The market also faces competition from alternative treatments like cosmetic procedures and supplements. The aging global population fuels demand, particularly in developed markets with high disposable incomes. Mergers and acquisitions (M&A) activity is moderate, with strategic partnerships playing a larger role in shaping market dynamics.
- Market Concentration: Moderately concentrated, with top 10 players holding approximately xx% market share in 2025.
- Technological Innovation: Focus on advanced ingredients (e.g., peptides, retinoids, stem cells), personalized skincare solutions, and sustainable packaging.
- Regulatory Landscape: Varies by region, impacting ingredient approvals and marketing claims; stringent regulations in some regions.
- Competitive Substitutes: Cosmetic procedures (e.g., Botox, fillers), dietary supplements, and alternative therapies.
- End-User Demographics: Primarily women aged 35-65, with increasing adoption among younger demographics.
- M&A Trends: xx M&A deals recorded in the last 5 years, with a focus on expanding product portfolios and geographic reach.
Anti-Aging Products Market Growth Trends & Insights
The global anti-aging products market is experiencing steady growth, driven by rising consumer awareness of skincare, increasing disposable incomes, particularly in emerging markets, and the growing prevalence of aging populations. Market size is projected to reach xx Million units by 2033, exhibiting a CAGR of xx% during the forecast period. The adoption rate of anti-aging products is increasing, particularly among younger consumers who are proactively addressing skin aging. Technological advancements, such as personalized skincare solutions and sophisticated delivery systems, are further fueling market growth.
Market penetration is high in developed countries but remains relatively low in emerging markets, presenting significant growth opportunities. Consumer behavior is shifting towards natural and organic products, clean beauty, and personalized skincare regimens. This shift demands product innovation focusing on efficacy and transparency, placing pressure on established players to adapt. The rise of online retail channels is reshaping distribution strategies, providing both opportunities and challenges.
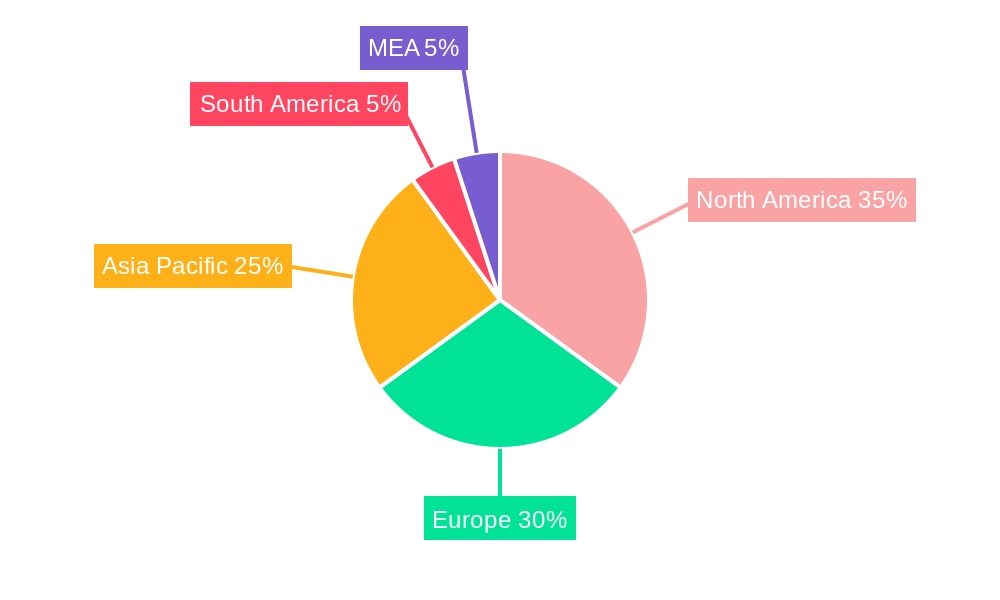
Dominant Regions, Countries, or Segments in Anti-Aging Products Market
North America and Europe currently dominate the anti-aging products market, driven by higher disposable incomes, advanced skincare awareness, and established distribution networks. However, Asia-Pacific is expected to witness the fastest growth over the forecast period.
By Product Type:
- Serums and Concentrates: This segment is experiencing the fastest growth, driven by the perception of higher efficacy and targeted benefits. It holds approximately xx% of the market share in 2025.
- Facial Creams and Lotions: This segment remains the largest, reflecting its widespread usage and established market presence. It accounts for approximately xx% of the market share in 2025.
- Under Eye Creams: This niche segment shows steady growth, propelled by the increasing focus on eye area skincare concerns. It accounts for approximately xx% of the market share in 2025.
By Distribution Channel:
- Online Retail Stores: This channel is experiencing rapid growth, driven by increased e-commerce adoption and convenience. It is projected to hold approximately xx% of the market share by 2033.
- Specialty Stores: Specialty stores maintain a significant share, owing to expert advice and high-quality products. It holds approximately xx% of the market share in 2025.
- Pharmacies/Drug Stores: Pharmacies/drug stores maintain a steady share, benefiting from their widespread availability and trusted brand image. It accounts for approximately xx% of the market share in 2025.
Anti-Aging Products Market Product Landscape
The anti-aging product landscape is characterized by continuous innovation, with companies introducing novel formulations and delivery systems. Products leverage advanced ingredients like peptides, retinol, hyaluronic acid, and antioxidants to target specific aging concerns such as wrinkles, age spots, and loss of firmness. Key selling propositions include clinically proven efficacy, natural ingredients, sustainable packaging, and personalization options. Technological advancements focus on improving ingredient absorption, enhancing product stability, and providing customized skincare solutions.
Key Drivers, Barriers & Challenges in Anti-Aging Products Market
Key Drivers:
- Growing awareness of skincare and anti-aging among consumers.
- Increasing disposable incomes, especially in emerging markets.
- Aging global population.
- Advances in active ingredients and delivery systems.
Key Challenges:
- Intense competition among established and emerging brands.
- Stringent regulations and safety concerns regarding ingredients.
- Fluctuating raw material prices and supply chain disruptions impacting production costs. These have caused a xx% increase in manufacturing costs in the past year, impacting profitability for many companies.
Emerging Opportunities in Anti-Aging Products Market
- Growing demand for personalized skincare solutions.
- Increasing interest in natural and organic anti-aging products.
- Untapped markets in developing countries.
- Expansion into men's skincare segment.
- Development of anti-aging supplements and nutraceuticals.
Growth Accelerators in the Anti-Aging Products Market Industry
Technological breakthroughs in active ingredient development, innovative delivery systems (e.g., microneedles, patches), and advanced formulation technologies are accelerating market growth. Strategic partnerships between skincare companies and technology providers are driving innovation and efficiency. Expansion into new geographic markets, particularly in emerging economies with a growing middle class, presents significant growth potential.
Key Players Shaping the Anti-Aging Products Market Market
Notable Milestones in Anti-Aging Products Market Sector
- March 2024: Dermalogica launched its Circular Hydration Serum, featuring hyaluronic acid and algae extracts.
- March 2024: L'Oréal Canada launched SkinBetter Science, expanding its medical aesthetic skincare offerings.
- April 2024: Nivea launched its Q10 Dual Action serum, targeting sugar-induced skin aging.
In-Depth Anti-Aging Products Market Market Outlook
The anti-aging products market is poised for continued growth, driven by technological innovation, evolving consumer preferences, and expanding global markets. Strategic partnerships, mergers and acquisitions, and the development of personalized skincare solutions will shape the industry's trajectory. Companies focusing on sustainable practices, transparent ingredient sourcing, and clinically proven efficacy will likely gain a competitive advantage. The market presents significant opportunities for companies that can effectively cater to the evolving needs and desires of a diverse and increasingly sophisticated consumer base.
Anti-Aging Products Market Segmentation
-
1. Product Type
- 1.1. Facial Creams and Lotions
- 1.2. Serums and Concentrates
- 1.3. Under Eye Creams
- 1.4. Others (Facial Oils, Sheet Masks)
-
2. Distribution Channel
- 2.1. Supermarkets/Hypermarkets
- 2.2. Specialty Stores
- 2.3. Pharmacies/Drug Stores
- 2.4. Online Retail Stores
- 2.5. Other Distribution Channels
Anti-Aging Products Market Segmentation By Geography
-
1. North America
- 1.1. United States
- 1.2. Canada
- 1.3. Mexico
- 1.4. Rest of North America
-
2. Europe
- 2.1. Spain
- 2.2. United Kingdom
- 2.3. Germany
- 2.4. France
- 2.5. Italy
- 2.6. Russia
- 2.7. Rest of Europe
-
3. Asia Pacific
- 3.1. China
- 3.2. Japan
- 3.3. India
- 3.4. Australia
- 3.5. Rest of Asia Pacific
-
4. South America
- 4.1. Brazil
- 4.2. Colombia
- 4.3. Rest of South America
-
5. Middle East and Africa
- 5.1. South Africa
- 5.2. Saudi Arabia
- 5.3. Rest of Middle East and Africa
Anti-Aging Products Market Regional Market Share
Geographic Coverage of Anti-Aging Products Market
Anti-Aging Products Market REPORT HIGHLIGHTS
| Aspects | Details |
|---|---|
| Study Period | 2020-2034 |
| Base Year | 2025 |
| Estimated Year | 2026 |
| Forecast Period | 2026-2034 |
| Historical Period | 2020-2025 |
| Growth Rate | CAGR of 6.62% from 2020-2034 |
| Segmentation |
|
Table of Contents
- 1. Introduction
- 1.1. Research Scope
- 1.2. Market Segmentation
- 1.3. Research Objective
- 1.4. Definitions and Assumptions
- 2. Executive Summary
- 2.1. Market Snapshot
- 3. Market Dynamics
- 3.1. Market Drivers
- 3.2. Market Restrains
- 3.3. Market Trends
- 3.4. Market Opportunities
- 4. Market Factor Analysis
- 4.1. Porters Five Forces
- 4.1.1. Bargaining Power of Suppliers
- 4.1.2. Bargaining Power of Buyers
- 4.1.3. Threat of New Entrants
- 4.1.4. Threat of Substitutes
- 4.1.5. Competitive Rivalry
- 4.2. PESTEL analysis
- 4.3. BCG Analysis
- 4.3.1. Stars (High Growth, High Market Share)
- 4.3.2. Cash Cows (Low Growth, High Market Share)
- 4.3.3. Question Mark (High Growth, Low Market Share)
- 4.3.4. Dogs (Low Growth, Low Market Share)
- 4.4. Ansoff Matrix Analysis
- 4.5. Supply Chain Analysis
- 4.6. Regulatory Landscape
- 4.7. Current Market Potential and Opportunity Assessment (TAM–SAM–SOM Framework)
- 4.8. VDR Analyst Note
- 4.1. Porters Five Forces
- 5. Market Analysis, Insights and Forecast 2021-2033
- 5.1. Market Analysis, Insights and Forecast - by Product Type
- 5.1.1. Facial Creams and Lotions
- 5.1.2. Serums and Concentrates
- 5.1.3. Under Eye Creams
- 5.1.4. Others (Facial Oils, Sheet Masks)
- 5.2. Market Analysis, Insights and Forecast - by Distribution Channel
- 5.2.1. Supermarkets/Hypermarkets
- 5.2.2. Specialty Stores
- 5.2.3. Pharmacies/Drug Stores
- 5.2.4. Online Retail Stores
- 5.2.5. Other Distribution Channels
- 5.3. Market Analysis, Insights and Forecast - by Region
- 5.3.1. North America
- 5.3.2. Europe
- 5.3.3. Asia Pacific
- 5.3.4. South America
- 5.3.5. Middle East and Africa
- 5.1. Market Analysis, Insights and Forecast - by Product Type
- 6. Global Anti-Aging Products Market Analysis, Insights and Forecast, 2021-2033
- 6.1. Market Analysis, Insights and Forecast - by Product Type
- 6.1.1. Facial Creams and Lotions
- 6.1.2. Serums and Concentrates
- 6.1.3. Under Eye Creams
- 6.1.4. Others (Facial Oils, Sheet Masks)
- 6.2. Market Analysis, Insights and Forecast - by Distribution Channel
- 6.2.1. Supermarkets/Hypermarkets
- 6.2.2. Specialty Stores
- 6.2.3. Pharmacies/Drug Stores
- 6.2.4. Online Retail Stores
- 6.2.5. Other Distribution Channels
- 6.1. Market Analysis, Insights and Forecast - by Product Type
- 7. North America Anti-Aging Products Market Analysis, Insights and Forecast, 2021-2033
- 7.1. Market Analysis, Insights and Forecast - by Product Type
- 7.1.1. Facial Creams and Lotions
- 7.1.2. Serums and Concentrates
- 7.1.3. Under Eye Creams
- 7.1.4. Others (Facial Oils, Sheet Masks)
- 7.2. Market Analysis, Insights and Forecast - by Distribution Channel
- 7.2.1. Supermarkets/Hypermarkets
- 7.2.2. Specialty Stores
- 7.2.3. Pharmacies/Drug Stores
- 7.2.4. Online Retail Stores
- 7.2.5. Other Distribution Channels
- 7.1. Market Analysis, Insights and Forecast - by Product Type
- 8. Europe Anti-Aging Products Market Analysis, Insights and Forecast, 2021-2033
- 8.1. Market Analysis, Insights and Forecast - by Product Type
- 8.1.1. Facial Creams and Lotions
- 8.1.2. Serums and Concentrates
- 8.1.3. Under Eye Creams
- 8.1.4. Others (Facial Oils, Sheet Masks)
- 8.2. Market Analysis, Insights and Forecast - by Distribution Channel
- 8.2.1. Supermarkets/Hypermarkets
- 8.2.2. Specialty Stores
- 8.2.3. Pharmacies/Drug Stores
- 8.2.4. Online Retail Stores
- 8.2.5. Other Distribution Channels
- 8.1. Market Analysis, Insights and Forecast - by Product Type
- 9. Asia Pacific Anti-Aging Products Market Analysis, Insights and Forecast, 2021-2033
- 9.1. Market Analysis, Insights and Forecast - by Product Type
- 9.1.1. Facial Creams and Lotions
- 9.1.2. Serums and Concentrates
- 9.1.3. Under Eye Creams
- 9.1.4. Others (Facial Oils, Sheet Masks)
- 9.2. Market Analysis, Insights and Forecast - by Distribution Channel
- 9.2.1. Supermarkets/Hypermarkets
- 9.2.2. Specialty Stores
- 9.2.3. Pharmacies/Drug Stores
- 9.2.4. Online Retail Stores
- 9.2.5. Other Distribution Channels
- 9.1. Market Analysis, Insights and Forecast - by Product Type
- 10. South America Anti-Aging Products Market Analysis, Insights and Forecast, 2021-2033
- 10.1. Market Analysis, Insights and Forecast - by Product Type
- 10.1.1. Facial Creams and Lotions
- 10.1.2. Serums and Concentrates
- 10.1.3. Under Eye Creams
- 10.1.4. Others (Facial Oils, Sheet Masks)
- 10.2. Market Analysis, Insights and Forecast - by Distribution Channel
- 10.2.1. Supermarkets/Hypermarkets
- 10.2.2. Specialty Stores
- 10.2.3. Pharmacies/Drug Stores
- 10.2.4. Online Retail Stores
- 10.2.5. Other Distribution Channels
- 10.1. Market Analysis, Insights and Forecast - by Product Type
- 11. Middle East and Africa Anti-Aging Products Market Analysis, Insights and Forecast, 2021-2033
- 11.1. Market Analysis, Insights and Forecast - by Product Type
- 11.1.1. Facial Creams and Lotions
- 11.1.2. Serums and Concentrates
- 11.1.3. Under Eye Creams
- 11.1.4. Others (Facial Oils, Sheet Masks)
- 11.2. Market Analysis, Insights and Forecast - by Distribution Channel
- 11.2.1. Supermarkets/Hypermarkets
- 11.2.2. Specialty Stores
- 11.2.3. Pharmacies/Drug Stores
- 11.2.4. Online Retail Stores
- 11.2.5. Other Distribution Channels
- 11.1. Market Analysis, Insights and Forecast - by Product Type
- 12. Competitive Analysis
- 12.1. Company Profiles
- 12.1.1 The Estee Lauder Companies Inc
- 12.1.1.1. Company Overview
- 12.1.1.2. Products
- 12.1.1.3. Company Financials
- 12.1.1.4. SWOT Analysis
- 12.1.2 Natura & Co *List Not Exhaustive
- 12.1.2.1. Company Overview
- 12.1.2.2. Products
- 12.1.2.3. Company Financials
- 12.1.2.4. SWOT Analysis
- 12.1.3 Shiseido Company Limited
- 12.1.3.1. Company Overview
- 12.1.3.2. Products
- 12.1.3.3. Company Financials
- 12.1.3.4. SWOT Analysis
- 12.1.4 Naos Group (Bioderma Laboratories)
- 12.1.4.1. Company Overview
- 12.1.4.2. Products
- 12.1.4.3. Company Financials
- 12.1.4.4. SWOT Analysis
- 12.1.5 Procter & Gamble
- 12.1.5.1. Company Overview
- 12.1.5.2. Products
- 12.1.5.3. Company Financials
- 12.1.5.4. SWOT Analysis
- 12.1.6 Caudalie
- 12.1.6.1. Company Overview
- 12.1.6.2. Products
- 12.1.6.3. Company Financials
- 12.1.6.4. SWOT Analysis
- 12.1.7 LOreal SA
- 12.1.7.1. Company Overview
- 12.1.7.2. Products
- 12.1.7.3. Company Financials
- 12.1.7.4. SWOT Analysis
- 12.1.8 Groupe Clarins
- 12.1.8.1. Company Overview
- 12.1.8.2. Products
- 12.1.8.3. Company Financials
- 12.1.8.4. SWOT Analysis
- 12.1.9 Beiersdorf Limited
- 12.1.9.1. Company Overview
- 12.1.9.2. Products
- 12.1.9.3. Company Financials
- 12.1.9.4. SWOT Analysis
- 12.1.10 Oriflame Cosmetics AG
- 12.1.10.1. Company Overview
- 12.1.10.2. Products
- 12.1.10.3. Company Financials
- 12.1.10.4. SWOT Analysis
- 12.1.1 The Estee Lauder Companies Inc
- 12.2. Market Entropy
- 12.2.1 Company's Key Areas Served
- 12.2.2 Recent Developments
- 12.3. Company Market Share Analysis 2025
- 12.3.1 Top 5 Companies Market Share Analysis
- 12.3.2 Top 3 Companies Market Share Analysis
- 12.4. List of Potential Customers
- 13. Research Methodology
List of Figures
- Figure 1: Global Anti-Aging Products Market Revenue Breakdown (Million, %) by Region 2025 & 2033
- Figure 2: North America Anti-Aging Products Market Revenue (Million), by Product Type 2025 & 2033
- Figure 3: North America Anti-Aging Products Market Revenue Share (%), by Product Type 2025 & 2033
- Figure 4: North America Anti-Aging Products Market Revenue (Million), by Distribution Channel 2025 & 2033
- Figure 5: North America Anti-Aging Products Market Revenue Share (%), by Distribution Channel 2025 & 2033
- Figure 6: North America Anti-Aging Products Market Revenue (Million), by Country 2025 & 2033
- Figure 7: North America Anti-Aging Products Market Revenue Share (%), by Country 2025 & 2033
- Figure 8: Europe Anti-Aging Products Market Revenue (Million), by Product Type 2025 & 2033
- Figure 9: Europe Anti-Aging Products Market Revenue Share (%), by Product Type 2025 & 2033
- Figure 10: Europe Anti-Aging Products Market Revenue (Million), by Distribution Channel 2025 & 2033
- Figure 11: Europe Anti-Aging Products Market Revenue Share (%), by Distribution Channel 2025 & 2033
- Figure 12: Europe Anti-Aging Products Market Revenue (Million), by Country 2025 & 2033
- Figure 13: Europe Anti-Aging Products Market Revenue Share (%), by Country 2025 & 2033
- Figure 14: Asia Pacific Anti-Aging Products Market Revenue (Million), by Product Type 2025 & 2033
- Figure 15: Asia Pacific Anti-Aging Products Market Revenue Share (%), by Product Type 2025 & 2033
- Figure 16: Asia Pacific Anti-Aging Products Market Revenue (Million), by Distribution Channel 2025 & 2033
- Figure 17: Asia Pacific Anti-Aging Products Market Revenue Share (%), by Distribution Channel 2025 & 2033
- Figure 18: Asia Pacific Anti-Aging Products Market Revenue (Million), by Country 2025 & 2033
- Figure 19: Asia Pacific Anti-Aging Products Market Revenue Share (%), by Country 2025 & 2033
- Figure 20: South America Anti-Aging Products Market Revenue (Million), by Product Type 2025 & 2033
- Figure 21: South America Anti-Aging Products Market Revenue Share (%), by Product Type 2025 & 2033
- Figure 22: South America Anti-Aging Products Market Revenue (Million), by Distribution Channel 2025 & 2033
- Figure 23: South America Anti-Aging Products Market Revenue Share (%), by Distribution Channel 2025 & 2033
- Figure 24: South America Anti-Aging Products Market Revenue (Million), by Country 2025 & 2033
- Figure 25: South America Anti-Aging Products Market Revenue Share (%), by Country 2025 & 2033
- Figure 26: Middle East and Africa Anti-Aging Products Market Revenue (Million), by Product Type 2025 & 2033
- Figure 27: Middle East and Africa Anti-Aging Products Market Revenue Share (%), by Product Type 2025 & 2033
- Figure 28: Middle East and Africa Anti-Aging Products Market Revenue (Million), by Distribution Channel 2025 & 2033
- Figure 29: Middle East and Africa Anti-Aging Products Market Revenue Share (%), by Distribution Channel 2025 & 2033
- Figure 30: Middle East and Africa Anti-Aging Products Market Revenue (Million), by Country 2025 & 2033
- Figure 31: Middle East and Africa Anti-Aging Products Market Revenue Share (%), by Country 2025 & 2033
List of Tables
- Table 1: Global Anti-Aging Products Market Revenue Million Forecast, by Product Type 2020 & 2033
- Table 2: Global Anti-Aging Products Market Revenue Million Forecast, by Distribution Channel 2020 & 2033
- Table 3: Global Anti-Aging Products Market Revenue Million Forecast, by Region 2020 & 2033
- Table 4: Global Anti-Aging Products Market Revenue Million Forecast, by Product Type 2020 & 2033
- Table 5: Global Anti-Aging Products Market Revenue Million Forecast, by Distribution Channel 2020 & 2033
- Table 6: Global Anti-Aging Products Market Revenue Million Forecast, by Country 2020 & 2033
- Table 7: United States Anti-Aging Products Market Revenue (Million) Forecast, by Application 2020 & 2033
- Table 8: Canada Anti-Aging Products Market Revenue (Million) Forecast, by Application 2020 & 2033
- Table 9: Mexico Anti-Aging Products Market Revenue (Million) Forecast, by Application 2020 & 2033
- Table 10: Rest of North America Anti-Aging Products Market Revenue (Million) Forecast, by Application 2020 & 2033
- Table 11: Global Anti-Aging Products Market Revenue Million Forecast, by Product Type 2020 & 2033
- Table 12: Global Anti-Aging Products Market Revenue Million Forecast, by Distribution Channel 2020 & 2033
- Table 13: Global Anti-Aging Products Market Revenue Million Forecast, by Country 2020 & 2033
- Table 14: Spain Anti-Aging Products Market Revenue (Million) Forecast, by Application 2020 & 2033
- Table 15: United Kingdom Anti-Aging Products Market Revenue (Million) Forecast, by Application 2020 & 2033
- Table 16: Germany Anti-Aging Products Market Revenue (Million) Forecast, by Application 2020 & 2033
- Table 17: France Anti-Aging Products Market Revenue (Million) Forecast, by Application 2020 & 2033
- Table 18: Italy Anti-Aging Products Market Revenue (Million) Forecast, by Application 2020 & 2033
- Table 19: Russia Anti-Aging Products Market Revenue (Million) Forecast, by Application 2020 & 2033
- Table 20: Rest of Europe Anti-Aging Products Market Revenue (Million) Forecast, by Application 2020 & 2033
- Table 21: Global Anti-Aging Products Market Revenue Million Forecast, by Product Type 2020 & 2033
- Table 22: Global Anti-Aging Products Market Revenue Million Forecast, by Distribution Channel 2020 & 2033
- Table 23: Global Anti-Aging Products Market Revenue Million Forecast, by Country 2020 & 2033
- Table 24: China Anti-Aging Products Market Revenue (Million) Forecast, by Application 2020 & 2033
- Table 25: Japan Anti-Aging Products Market Revenue (Million) Forecast, by Application 2020 & 2033
- Table 26: India Anti-Aging Products Market Revenue (Million) Forecast, by Application 2020 & 2033
- Table 27: Australia Anti-Aging Products Market Revenue (Million) Forecast, by Application 2020 & 2033
- Table 28: Rest of Asia Pacific Anti-Aging Products Market Revenue (Million) Forecast, by Application 2020 & 2033
- Table 29: Global Anti-Aging Products Market Revenue Million Forecast, by Product Type 2020 & 2033
- Table 30: Global Anti-Aging Products Market Revenue Million Forecast, by Distribution Channel 2020 & 2033
- Table 31: Global Anti-Aging Products Market Revenue Million Forecast, by Country 2020 & 2033
- Table 32: Brazil Anti-Aging Products Market Revenue (Million) Forecast, by Application 2020 & 2033
- Table 33: Colombia Anti-Aging Products Market Revenue (Million) Forecast, by Application 2020 & 2033
- Table 34: Rest of South America Anti-Aging Products Market Revenue (Million) Forecast, by Application 2020 & 2033
- Table 35: Global Anti-Aging Products Market Revenue Million Forecast, by Product Type 2020 & 2033
- Table 36: Global Anti-Aging Products Market Revenue Million Forecast, by Distribution Channel 2020 & 2033
- Table 37: Global Anti-Aging Products Market Revenue Million Forecast, by Country 2020 & 2033
- Table 38: South Africa Anti-Aging Products Market Revenue (Million) Forecast, by Application 2020 & 2033
- Table 39: Saudi Arabia Anti-Aging Products Market Revenue (Million) Forecast, by Application 2020 & 2033
- Table 40: Rest of Middle East and Africa Anti-Aging Products Market Revenue (Million) Forecast, by Application 2020 & 2033
Frequently Asked Questions
1. What is the projected Compound Annual Growth Rate (CAGR) of the Anti-Aging Products Market?
The projected CAGR is approximately 6.62%.
2. Which companies are prominent players in the Anti-Aging Products Market?
Key companies in the market include The Estee Lauder Companies Inc, Natura & Co *List Not Exhaustive, Shiseido Company Limited, Naos Group (Bioderma Laboratories), Procter & Gamble, Caudalie, LOreal SA, Groupe Clarins, Beiersdorf Limited, Oriflame Cosmetics AG.
3. What are the main segments of the Anti-Aging Products Market?
The market segments include Product Type, Distribution Channel.
4. Can you provide details about the market size?
The market size is estimated to be USD 59.23 Million as of 2022.
5. What are some drivers contributing to market growth?
Aggressive Marketing and Advertising By Brands; Desire Among Consumers For Youthful Skin.
6. What are the notable trends driving market growth?
Aggressive Marketing and Advertising By Brands.
7. Are there any restraints impacting market growth?
Availability of Counterfeit Products.
8. Can you provide examples of recent developments in the market?
April 2024: Nivea expanded its anti-aging product portfolio by launching the Q10 Dual Action serum. The company claims that the serum targets sugar-induced skin aging and wrinkle formation. The formula was designed to prevent protein glycation in the dermis skin layer, protecting collagen and elastin from damage.
9. What pricing options are available for accessing the report?
Pricing options include single-user, multi-user, and enterprise licenses priced at USD 4750, USD 5250, and USD 8750 respectively.
10. Is the market size provided in terms of value or volume?
The market size is provided in terms of value, measured in Million.
11. Are there any specific market keywords associated with the report?
Yes, the market keyword associated with the report is "Anti-Aging Products Market," which aids in identifying and referencing the specific market segment covered.
12. How do I determine which pricing option suits my needs best?
The pricing options vary based on user requirements and access needs. Individual users may opt for single-user licenses, while businesses requiring broader access may choose multi-user or enterprise licenses for cost-effective access to the report.
13. Are there any additional resources or data provided in the Anti-Aging Products Market report?
While the report offers comprehensive insights, it's advisable to review the specific contents or supplementary materials provided to ascertain if additional resources or data are available.
14. How can I stay updated on further developments or reports in the Anti-Aging Products Market?
To stay informed about further developments, trends, and reports in the Anti-Aging Products Market, consider subscribing to industry newsletters, following relevant companies and organizations, or regularly checking reputable industry news sources and publications.
Methodology
Step 1 - Identification of Relevant Samples Size from Population Database


Step 2 - Approaches for Defining Global Market Size (Value, Volume* & Price*)

Note*: In applicable scenarios
Step 3 - Data Sources
Primary Research
- Web Analytics
- Survey Reports
- Research Institute
- Latest Research Reports
- Opinion Leaders
Secondary Research
- Annual Reports
- White Paper
- Latest Press Release
- Industry Association
- Paid Database
- Investor Presentations

Step 4 - Data Triangulation
Involves using different sources of information in order to increase the validity of a study
These sources are likely to be stakeholders in a program - participants, other researchers, program staff, other community members, and so on.
Then we put all data in single framework & apply various statistical tools to find out the dynamic on the market.
During the analysis stage, feedback from the stakeholder groups would be compared to determine areas of agreement as well as areas of divergence