Key Insights
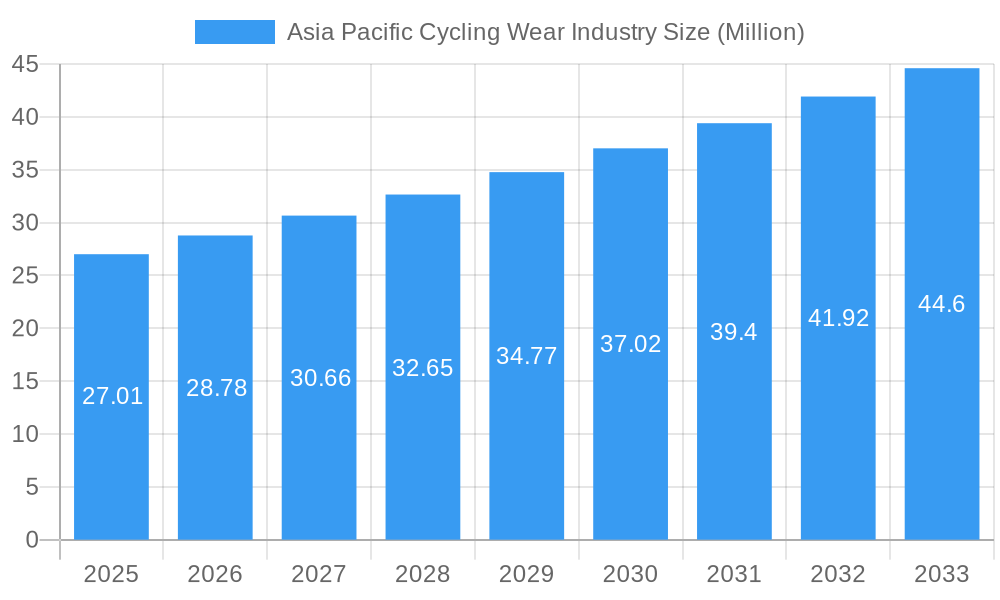
The Asia-Pacific cycling wear market, valued at $27.01 million in 2025, is projected to experience robust growth, driven by a rising health-conscious population embracing cycling as a fitness activity and mode of commuting. This surge in cycling participation is fueled by increasing urbanization, government initiatives promoting sustainable transportation, and the growing popularity of e-bikes. The market segmentation reveals a strong demand across various bicycle types, with road bicycles, hybrid bicycles, and e-bikes leading the sales. Online retail stores are witnessing substantial growth, reflecting the broader e-commerce trend in the region. However, factors such as fluctuating raw material prices and the impact of economic downturns could pose challenges to market expansion. Competitive landscape analysis indicates a mix of established international brands and local players, each vying for market share through product innovation, strategic partnerships, and aggressive marketing campaigns. The diverse range of products catering to various cycling styles—from casual to professional—further contributes to market expansion. Given the projected 6.29% CAGR, the market is expected to reach significant heights by 2033. The growth will likely be concentrated in high-growth economies within the Asia-Pacific region, such as China and India, given their large populations and increasing disposable incomes.
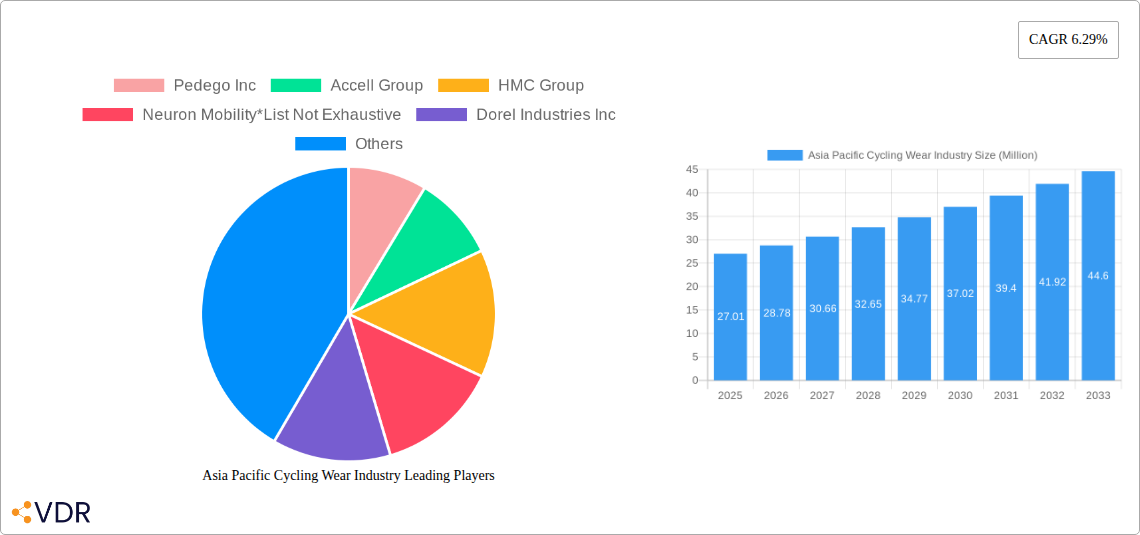
Asia Pacific Cycling Wear Industry Market Size (In Million)
The specific distribution channels, while showing growth in online sales, suggest continued importance of offline retail stores, particularly for specialized equipment and personalized fitting. This underscores the need for businesses to maintain a strong omnichannel presence. Future market dynamics may also be significantly impacted by technological advancements in cycling apparel (e.g., smart fabrics and performance enhancing materials) and the evolving preferences of the increasingly discerning cyclist. Further research on specific trends within individual segments (e.g., increasing popularity of specific types of cycling wear within certain regions) will be vital for companies to tailor their strategies and capitalize on emerging opportunities. The significant market potential demands continuous monitoring of macroeconomic indicators and consumer preferences to accurately predict future market trajectories.
Asia Pacific Cycling Wear Industry Company Market Share
Asia Pacific Cycling Wear Industry Market Report: 2019-2033
This comprehensive report provides a detailed analysis of the Asia Pacific cycling wear industry, offering invaluable insights for businesses, investors, and industry professionals. Covering the period from 2019 to 2033, with a focus on 2025, this report examines market dynamics, growth trends, key players, and emerging opportunities. The report segments the market by Type (Road Bicycles, Hybrid Bicycles, All Terrain Bicycles, E-Bicycles, Other Types) and Distribution Channel (Offline Retail Stores, Online Retail Stores), providing a granular understanding of the industry landscape.
Asia Pacific Cycling Wear Industry Market Dynamics & Structure
This section analyzes the competitive landscape, technological advancements, regulatory environment, and market trends within the Asia Pacific cycling wear industry. The market exhibits moderate concentration, with key players like Giant Bicycles, Merida Bikes, and Avon Cycles Ltd holding significant shares, though the market is fragmented with numerous smaller players.
- Market Concentration: xx% held by top 5 players (2024).
- Technological Innovation: Continuous innovation in e-bike technology, lightweight materials, and smart features drives market growth. Barriers include high R&D costs and the need for skilled labor.
- Regulatory Frameworks: Government initiatives promoting cycling infrastructure and sustainable transportation positively impact market growth. However, varying regulations across different countries create complexities.
- Competitive Product Substitutes: Competition from other forms of personal transportation, like scooters and automobiles, influences consumer choices.
- End-User Demographics: Growing urban populations, increasing health awareness, and rising disposable incomes drive demand, particularly among young adults and the middle class.
- M&A Trends: The industry has seen xx M&A deals in the last 5 years (2019-2024), primarily focused on expanding product portfolios and market reach. Examples include Hero Motor’s joint venture with Yamaha.
Asia Pacific Cycling Wear Industry Growth Trends & Insights
The Asia Pacific cycling wear market experienced substantial growth between 2019 and 2024, driven by factors such as rising disposable incomes, increasing urbanization, and growing health consciousness. The market size reached xx million units in 2024 and is projected to reach xx million units by 2033, exhibiting a CAGR of xx% during the forecast period (2025-2033). This growth is fueled by increased adoption rates of e-bikes, particularly in urban areas. Technological disruptions, such as improved battery technology and integrated GPS systems, are further accelerating market expansion. Consumer behavior shifts towards environmentally friendly transportation options are also positively impacting growth.
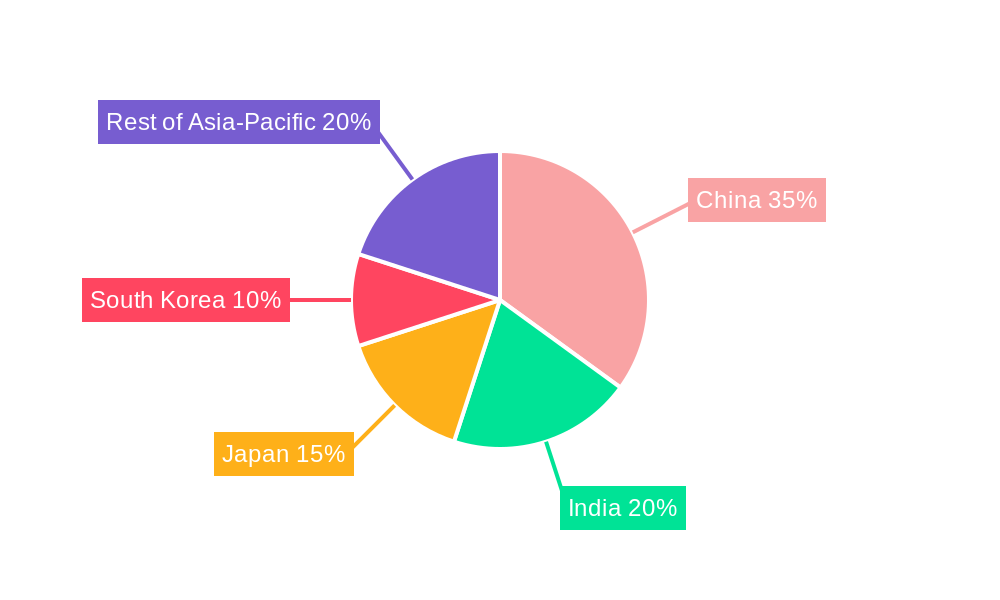
Dominant Regions, Countries, or Segments in Asia Pacific Cycling Wear Industry
China and Japan currently dominate the Asia Pacific cycling wear market, accounting for xx% and xx% of the total market share respectively in 2024. This dominance is attributed to factors such as:
- China: Large population, growing middle class, government support for cycling infrastructure, and a thriving domestic manufacturing sector.
- Japan: High disposable incomes, advanced technological capabilities, and strong consumer preference for high-quality products.
Within product segments, E-Bicycles are experiencing the fastest growth, driven by government incentives and increasing consumer demand for eco-friendly transport. Online retail stores are also witnessing robust growth, driven by increasing internet penetration and the convenience of online shopping.
Asia Pacific Cycling Wear Industry Product Landscape
The Asia Pacific cycling wear industry showcases a diverse product landscape, encompassing road bicycles, hybrid bicycles, all-terrain bicycles, e-bikes, and other types. Innovations include lightweight carbon fiber frames, advanced gear systems (like Shimano's), integrated GPS and connectivity features, and improved battery technology for e-bikes. Manufacturers are focusing on enhancing performance, durability, and user experience through technological advancements and unique designs to gain a competitive edge.
Key Drivers, Barriers & Challenges in Asia Pacific Cycling Wear Industry
Key Drivers:
- Increasing urbanization and traffic congestion promote cycling as an alternative mode of transport.
- Growing health consciousness and government initiatives promoting fitness and active lifestyles.
- Technological advancements, particularly in e-bike technology, making cycling more accessible and appealing.
Key Challenges:
- Supply chain disruptions and rising raw material costs impacting production and profitability. This resulted in a xx% increase in production costs in 2022.
- Intense competition among manufacturers requires continuous innovation and efficient cost management.
- Regulatory hurdles and varying safety standards across different countries pose challenges to market expansion.
Emerging Opportunities in Asia Pacific Cycling Wear Industry
- Untapped markets in Southeast Asia offer significant growth potential.
- The integration of smart technologies, such as fitness tracking and connectivity features, expands market applications.
- Growing demand for customized and personalized cycling experiences creates opportunities for niche players.
Growth Accelerators in the Asia Pacific Cycling Wear Industry Industry
Strategic partnerships between established bicycle manufacturers and technology companies are expected to accelerate growth. Furthermore, investments in research and development of sustainable and innovative cycling technologies are crucial for long-term market expansion. Government incentives and supportive policies promoting cycling as a sustainable transportation mode will also play a crucial role in fostering market growth.
Key Players Shaping the Asia Pacific Cycling Wear Industry Market
- Pedego Inc
- Accell Group
- HMC Group
- Neuron Mobility
- Dorel Industries Inc
- Nixeycles
- Merida Bikes
- Giant Bicycles
- Benno Bikes LLC
- Avon Cycles Ltd
- Bridgestone Corporation
Notable Milestones in Asia Pacific Cycling Wear Industry Sector
- June 2022: Ninety One Cycles launched the Black Arrow 700C bike, featuring advanced components and enhancing the mid-range market.
- April 2022: Neuron Mobility deployed 250 e-bikes in Sydney, showcasing the growing adoption of e-bikes in urban areas.
- October 2021: Hero Motor (HMC) and Yamaha formed a joint venture for electric motor production, signifying a significant step in the e-bike segment.
In-Depth Asia Pacific Cycling Wear Industry Market Outlook
The Asia Pacific cycling wear industry is poised for sustained growth in the coming years. Technological advancements, favorable government policies, and changing consumer preferences will continue to drive market expansion. Strategic partnerships, investments in R&D, and focusing on sustainable practices will be crucial for companies to capitalize on future opportunities and maintain a competitive edge in this dynamic market.
Asia Pacific Cycling Wear Industry Segmentation
-
1. Type
- 1.1. Road Bicycles
- 1.2. Hybrid Bicycles
- 1.3. All-trrain Bicycles
- 1.4. E-bicycles
- 1.5. Other Types
-
2. Distribution Channel
- 2.1. Offline Retail Stores
- 2.2. Online Retail Stores
Asia Pacific Cycling Wear Industry Segmentation By Geography
-
1. Asia Pacific
- 1.1. China
- 1.2. Japan
- 1.3. South Korea
- 1.4. India
- 1.5. Australia
- 1.6. New Zealand
- 1.7. Indonesia
- 1.8. Malaysia
- 1.9. Singapore
- 1.10. Thailand
- 1.11. Vietnam
- 1.12. Philippines
Asia Pacific Cycling Wear Industry Regional Market Share
Geographic Coverage of Asia Pacific Cycling Wear Industry
Asia Pacific Cycling Wear Industry REPORT HIGHLIGHTS
| Aspects | Details |
|---|---|
| Study Period | 2020-2034 |
| Base Year | 2025 |
| Estimated Year | 2026 |
| Forecast Period | 2026-2034 |
| Historical Period | 2020-2025 |
| Growth Rate | CAGR of 6.29% from 2020-2034 |
| Segmentation |
|
Table of Contents
- 1. Introduction
- 1.1. Research Scope
- 1.2. Market Segmentation
- 1.3. Research Objective
- 1.4. Definitions and Assumptions
- 2. Executive Summary
- 2.1. Market Snapshot
- 3. Market Dynamics
- 3.1. Market Drivers
- 3.2. Market Restrains
- 3.3. Market Trends
- 3.4. Market Opportunities
- 4. Market Factor Analysis
- 4.1. Porters Five Forces
- 4.1.1. Bargaining Power of Suppliers
- 4.1.2. Bargaining Power of Buyers
- 4.1.3. Threat of New Entrants
- 4.1.4. Threat of Substitutes
- 4.1.5. Competitive Rivalry
- 4.2. PESTEL analysis
- 4.3. BCG Analysis
- 4.3.1. Stars (High Growth, High Market Share)
- 4.3.2. Cash Cows (Low Growth, High Market Share)
- 4.3.3. Question Mark (High Growth, Low Market Share)
- 4.3.4. Dogs (Low Growth, Low Market Share)
- 4.4. Ansoff Matrix Analysis
- 4.5. Supply Chain Analysis
- 4.6. Regulatory Landscape
- 4.7. Current Market Potential and Opportunity Assessment (TAM–SAM–SOM Framework)
- 4.8. VDR Analyst Note
- 4.1. Porters Five Forces
- 5. Market Analysis, Insights and Forecast 2021-2033
- 5.1. Market Analysis, Insights and Forecast - by Type
- 5.1.1. Road Bicycles
- 5.1.2. Hybrid Bicycles
- 5.1.3. All-trrain Bicycles
- 5.1.4. E-bicycles
- 5.1.5. Other Types
- 5.2. Market Analysis, Insights and Forecast - by Distribution Channel
- 5.2.1. Offline Retail Stores
- 5.2.2. Online Retail Stores
- 5.3. Market Analysis, Insights and Forecast - by Region
- 5.3.1. Asia Pacific
- 5.1. Market Analysis, Insights and Forecast - by Type
- 6. Asia Pacific Cycling Wear Industry Analysis, Insights and Forecast, 2021-2033
- 6.1. Market Analysis, Insights and Forecast - by Type
- 6.1.1. Road Bicycles
- 6.1.2. Hybrid Bicycles
- 6.1.3. All-trrain Bicycles
- 6.1.4. E-bicycles
- 6.1.5. Other Types
- 6.2. Market Analysis, Insights and Forecast - by Distribution Channel
- 6.2.1. Offline Retail Stores
- 6.2.2. Online Retail Stores
- 6.1. Market Analysis, Insights and Forecast - by Type
- 7. Competitive Analysis
- 7.1. Company Profiles
- 7.1.1 Pedego Inc
- 7.1.1.1. Company Overview
- 7.1.1.2. Products
- 7.1.1.3. Company Financials
- 7.1.1.4. SWOT Analysis
- 7.1.2 Accell Group
- 7.1.2.1. Company Overview
- 7.1.2.2. Products
- 7.1.2.3. Company Financials
- 7.1.2.4. SWOT Analysis
- 7.1.3 HMC Group
- 7.1.3.1. Company Overview
- 7.1.3.2. Products
- 7.1.3.3. Company Financials
- 7.1.3.4. SWOT Analysis
- 7.1.4 Neuron Mobility*List Not Exhaustive
- 7.1.4.1. Company Overview
- 7.1.4.2. Products
- 7.1.4.3. Company Financials
- 7.1.4.4. SWOT Analysis
- 7.1.5 Dorel Industries Inc
- 7.1.5.1. Company Overview
- 7.1.5.2. Products
- 7.1.5.3. Company Financials
- 7.1.5.4. SWOT Analysis
- 7.1.6 Nixeycles
- 7.1.6.1. Company Overview
- 7.1.6.2. Products
- 7.1.6.3. Company Financials
- 7.1.6.4. SWOT Analysis
- 7.1.7 Merida Bikes
- 7.1.7.1. Company Overview
- 7.1.7.2. Products
- 7.1.7.3. Company Financials
- 7.1.7.4. SWOT Analysis
- 7.1.8 Giant Bicycles
- 7.1.8.1. Company Overview
- 7.1.8.2. Products
- 7.1.8.3. Company Financials
- 7.1.8.4. SWOT Analysis
- 7.1.9 Benno Bikes LLC
- 7.1.9.1. Company Overview
- 7.1.9.2. Products
- 7.1.9.3. Company Financials
- 7.1.9.4. SWOT Analysis
- 7.1.10 Avon Cycles Ltd
- 7.1.10.1. Company Overview
- 7.1.10.2. Products
- 7.1.10.3. Company Financials
- 7.1.10.4. SWOT Analysis
- 7.1.11 Bridgestone Corporation
- 7.1.11.1. Company Overview
- 7.1.11.2. Products
- 7.1.11.3. Company Financials
- 7.1.11.4. SWOT Analysis
- 7.1.1 Pedego Inc
- 7.2. Market Entropy
- 7.2.1 Company's Key Areas Served
- 7.2.2 Recent Developments
- 7.3. Company Market Share Analysis 2025
- 7.3.1 Top 5 Companies Market Share Analysis
- 7.3.2 Top 3 Companies Market Share Analysis
- 7.4. List of Potential Customers
- 8. Research Methodology
List of Figures
- Figure 1: Asia Pacific Cycling Wear Industry Revenue Breakdown (Million, %) by Product 2025 & 2033
- Figure 2: Asia Pacific Cycling Wear Industry Share (%) by Company 2025
List of Tables
- Table 1: Asia Pacific Cycling Wear Industry Revenue Million Forecast, by Type 2020 & 2033
- Table 2: Asia Pacific Cycling Wear Industry Revenue Million Forecast, by Distribution Channel 2020 & 2033
- Table 3: Asia Pacific Cycling Wear Industry Revenue Million Forecast, by Region 2020 & 2033
- Table 4: Asia Pacific Cycling Wear Industry Revenue Million Forecast, by Type 2020 & 2033
- Table 5: Asia Pacific Cycling Wear Industry Revenue Million Forecast, by Distribution Channel 2020 & 2033
- Table 6: Asia Pacific Cycling Wear Industry Revenue Million Forecast, by Country 2020 & 2033
- Table 7: China Asia Pacific Cycling Wear Industry Revenue (Million) Forecast, by Application 2020 & 2033
- Table 8: Japan Asia Pacific Cycling Wear Industry Revenue (Million) Forecast, by Application 2020 & 2033
- Table 9: South Korea Asia Pacific Cycling Wear Industry Revenue (Million) Forecast, by Application 2020 & 2033
- Table 10: India Asia Pacific Cycling Wear Industry Revenue (Million) Forecast, by Application 2020 & 2033
- Table 11: Australia Asia Pacific Cycling Wear Industry Revenue (Million) Forecast, by Application 2020 & 2033
- Table 12: New Zealand Asia Pacific Cycling Wear Industry Revenue (Million) Forecast, by Application 2020 & 2033
- Table 13: Indonesia Asia Pacific Cycling Wear Industry Revenue (Million) Forecast, by Application 2020 & 2033
- Table 14: Malaysia Asia Pacific Cycling Wear Industry Revenue (Million) Forecast, by Application 2020 & 2033
- Table 15: Singapore Asia Pacific Cycling Wear Industry Revenue (Million) Forecast, by Application 2020 & 2033
- Table 16: Thailand Asia Pacific Cycling Wear Industry Revenue (Million) Forecast, by Application 2020 & 2033
- Table 17: Vietnam Asia Pacific Cycling Wear Industry Revenue (Million) Forecast, by Application 2020 & 2033
- Table 18: Philippines Asia Pacific Cycling Wear Industry Revenue (Million) Forecast, by Application 2020 & 2033
Frequently Asked Questions
1. What is the projected Compound Annual Growth Rate (CAGR) of the Asia Pacific Cycling Wear Industry?
The projected CAGR is approximately 6.29%.
2. Which companies are prominent players in the Asia Pacific Cycling Wear Industry?
Key companies in the market include Pedego Inc, Accell Group, HMC Group, Neuron Mobility*List Not Exhaustive, Dorel Industries Inc, Nixeycles, Merida Bikes, Giant Bicycles, Benno Bikes LLC, Avon Cycles Ltd, Bridgestone Corporation.
3. What are the main segments of the Asia Pacific Cycling Wear Industry?
The market segments include Type, Distribution Channel.
4. Can you provide details about the market size?
The market size is estimated to be USD 27.01 Million as of 2022.
5. What are some drivers contributing to market growth?
Aggressive Advertisement And Promotional Activities; Advancement In Security. Encryption. And Streaming Technology.
6. What are the notable trends driving market growth?
Continuation of Increasing Demand for Bicycles in India.
7. Are there any restraints impacting market growth?
Regulatory and Legal Challenges.
8. Can you provide examples of recent developments in the market?
In June 2022, Ninety One Cycles launched a new Black Arrow 700C bike. The features of the bike include a 7-speed EZ fire rear shifter, a hybrid fork for jerk absorption, and a Shimano 7-speed gear set. The cycle comes with 160mm disk brakes and high-traction nylon tires.
9. What pricing options are available for accessing the report?
Pricing options include single-user, multi-user, and enterprise licenses priced at USD 4750, USD 4950, and USD 6800 respectively.
10. Is the market size provided in terms of value or volume?
The market size is provided in terms of value, measured in Million.
11. Are there any specific market keywords associated with the report?
Yes, the market keyword associated with the report is "Asia Pacific Cycling Wear Industry," which aids in identifying and referencing the specific market segment covered.
12. How do I determine which pricing option suits my needs best?
The pricing options vary based on user requirements and access needs. Individual users may opt for single-user licenses, while businesses requiring broader access may choose multi-user or enterprise licenses for cost-effective access to the report.
13. Are there any additional resources or data provided in the Asia Pacific Cycling Wear Industry report?
While the report offers comprehensive insights, it's advisable to review the specific contents or supplementary materials provided to ascertain if additional resources or data are available.
14. How can I stay updated on further developments or reports in the Asia Pacific Cycling Wear Industry?
To stay informed about further developments, trends, and reports in the Asia Pacific Cycling Wear Industry, consider subscribing to industry newsletters, following relevant companies and organizations, or regularly checking reputable industry news sources and publications.
Methodology
Step 1 - Identification of Relevant Samples Size from Population Database


Step 2 - Approaches for Defining Global Market Size (Value, Volume* & Price*)

Note*: In applicable scenarios
Step 3 - Data Sources
Primary Research
- Web Analytics
- Survey Reports
- Research Institute
- Latest Research Reports
- Opinion Leaders
Secondary Research
- Annual Reports
- White Paper
- Latest Press Release
- Industry Association
- Paid Database
- Investor Presentations

Step 4 - Data Triangulation
Involves using different sources of information in order to increase the validity of a study
These sources are likely to be stakeholders in a program - participants, other researchers, program staff, other community members, and so on.
Then we put all data in single framework & apply various statistical tools to find out the dynamic on the market.
During the analysis stage, feedback from the stakeholder groups would be compared to determine areas of agreement as well as areas of divergence

