

Key Insights
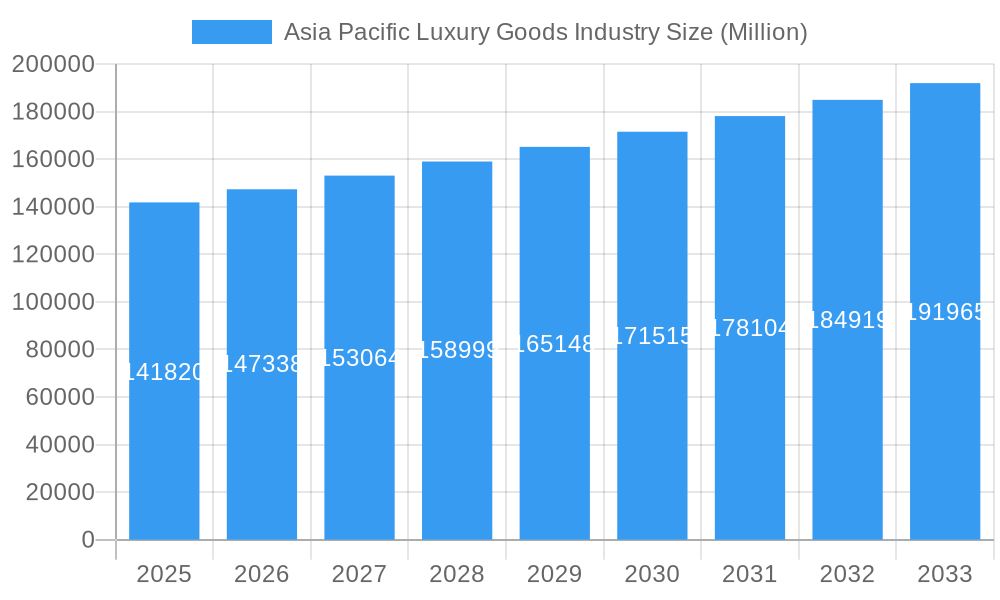
The Asia-Pacific luxury goods market, valued at $141.82 billion in 2025, is projected to experience robust growth, driven by a rising affluent population, increasing disposable incomes, and a growing preference for premium brands across key markets like China, Japan, South Korea, and India. The market's Compound Annual Growth Rate (CAGR) of 4.06% from 2025 to 2033 indicates a steady expansion, with significant contributions from various segments. Clothing and apparel, footwear, and bags consistently remain top performers, fueled by both domestic consumption and increasing tourism. The online distribution channel is experiencing exponential growth, reflecting evolving consumer preferences and the convenience of e-commerce. Key players like LVMH, Kering, Richemont, and Estee Lauder are strategically investing in expanding their presence, leveraging both online platforms and flagship stores to cater to the diverse demands of this dynamic market. The increasing popularity of personalized luxury experiences and sustainable luxury practices further shapes the market landscape.
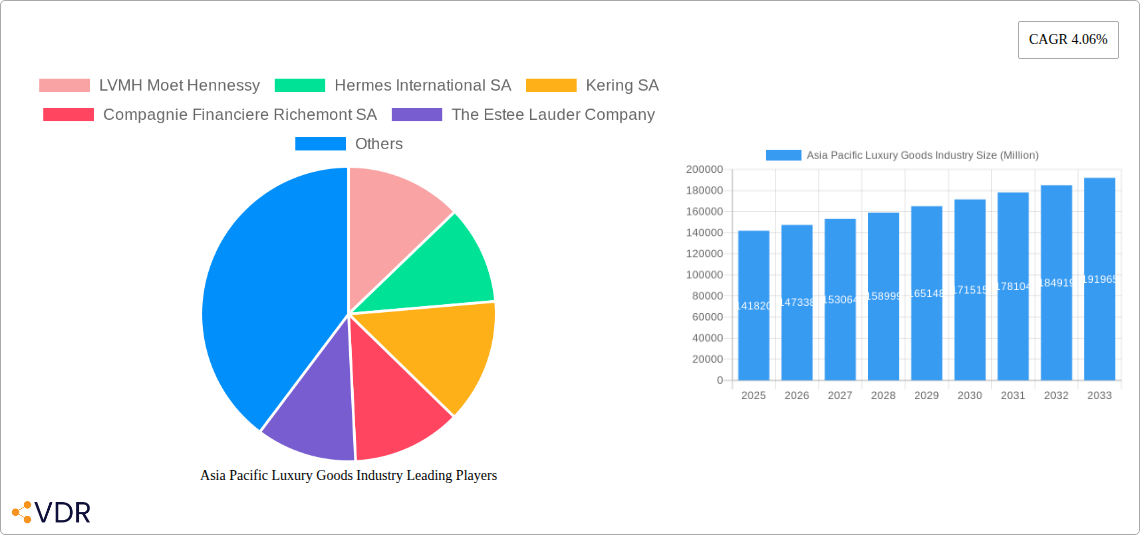
Asia Pacific Luxury Goods Industry Market Size (In Billion)
The robust growth trajectory is further supported by the continued strength of the Chinese luxury market, a major contributor to the region's overall performance. While economic fluctuations and geopolitical uncertainties pose potential restraints, the long-term outlook remains positive. The market's segmentation, encompassing various product types and distribution channels, provides numerous opportunities for existing and new players. The focus on offering unique brand experiences, fostering strong customer relationships, and embracing digital innovation will be critical for success in this increasingly competitive yet lucrative market. The sustained emphasis on quality, craftsmanship, and heritage will continue to be a strong differentiator for luxury brands in this region.
Asia Pacific Luxury Goods Industry Company Market Share
Asia Pacific Luxury Goods Industry: Market Dynamics, Growth & Future Outlook (2019-2033)
This comprehensive report provides an in-depth analysis of the Asia Pacific luxury goods market, encompassing historical data (2019-2024), current estimates (2025), and future projections (2025-2033). We delve into market dynamics, growth trends, key players, and emerging opportunities, offering invaluable insights for industry professionals, investors, and strategic decision-makers. The report segments the market by Type (Clothing and Apparel, Footwear, Bags, Jewelry, Watches, Other Types) and Distribution Channel (Single-branded Stores, Multi-brand Stores, Online Stores, Other Distribution Channels), providing granular data for informed strategic planning.
Asia Pacific Luxury Goods Industry Market Dynamics & Structure
The Asia Pacific luxury goods market, valued at xx Million in 2024, is characterized by high market concentration, with a few dominant players capturing a significant share. Technological innovation, particularly in personalized experiences and e-commerce, is a key driver. Stringent regulatory frameworks concerning product authenticity and consumer protection influence market operations. The industry faces competition from both established luxury brands and emerging local players. The increasing disposable incomes of the burgeoning middle class in several Asian countries fuel robust demand. Furthermore, mergers and acquisitions (M&A) are frequent, reflecting consolidation and expansion strategies within the market.
- Market Concentration: High, with top 5 players controlling approximately xx% of the market share in 2024.
- Technological Innovation: Focus on personalization, omnichannel strategies, and leveraging AI/Big Data for improved customer experiences.
- Regulatory Framework: Stringent regulations on product authenticity and advertising impact market operations.
- Competitive Landscape: Intense competition from both established international and emerging local players.
- M&A Activity: A significant number of M&A deals are recorded annually (xx deals in 2024), driving consolidation and expansion.
- End-User Demographics: Primarily driven by high-net-worth individuals (HNWIs) and the growing affluent middle class in key Asian markets.
Asia Pacific Luxury Goods Industry Growth Trends & Insights
The Asia Pacific luxury goods market exhibits a robust growth trajectory, driven by a confluence of factors including rising disposable incomes, escalating demand for premium products, and the increasing influence of social media on consumer behavior. The market experienced a CAGR of xx% during 2019-2024 and is projected to maintain a CAGR of xx% during the forecast period (2025-2033), reaching a value of xx Million by 2033. Technological disruptions, such as the rise of e-commerce and personalized marketing, are reshaping the industry landscape. Changing consumer preferences, particularly towards sustainability and ethical sourcing, present both challenges and opportunities for luxury brands. Market penetration is increasing rapidly in emerging markets like Vietnam and India, although mature markets like China and Japan continue to be significant contributors.
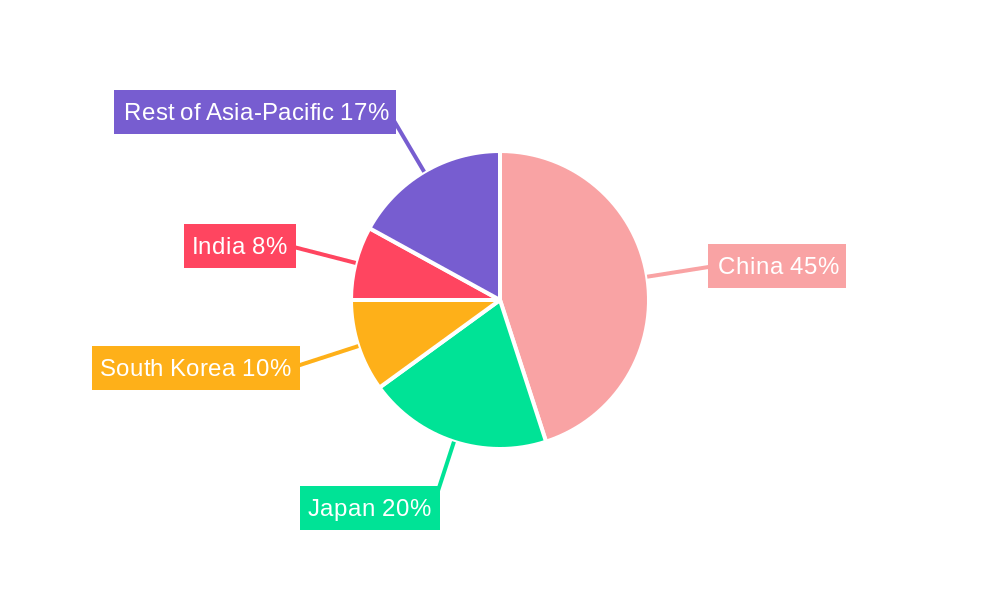
Dominant Regions, Countries, or Segments in Asia Pacific Luxury Goods Industry
China remains the dominant market in the Asia Pacific region, followed by Japan, South Korea, and Australia. Within the product segments, Watches and Jewelry command the largest market share, driven by strong demand in China and other key markets. Single-branded stores continue to be the leading distribution channel, although the significance of online sales is rapidly expanding.
- Key Drivers:
- China's Robust Economic Growth: A major contributor to the overall market size.
- Rising Affluent Middle Class: Increased disposable income fuels demand for luxury goods across the region.
- E-commerce Expansion: Growing popularity of online luxury shopping expands market reach.
- Dominant Segments: Watches and Jewelry showcase the highest market share and potential for growth. Single-branded stores hold a significant position, however online sales are experiencing rapid expansion.
Asia Pacific Luxury Goods Industry Product Landscape
The luxury goods landscape is characterized by continuous product innovation, emphasizing craftsmanship, exclusivity, and technological integration. Brands are increasingly focusing on sustainable materials and ethical sourcing to appeal to conscious consumers. Smart watches and digitally connected accessories are gaining popularity, integrating technology with luxury aesthetics. Personalization services, tailored to individual customer preferences, are becoming a key differentiator.
Key Drivers, Barriers & Challenges in Asia Pacific Luxury Goods Industry
Key Drivers: Rising disposable incomes, increasing brand awareness, expanding e-commerce platforms, and a growing preference for experiences are propelling market growth. Government initiatives supporting tourism and luxury retail also provide positive impacts.
Key Challenges: Geopolitical instability, supply chain disruptions, counterfeiting concerns, and fluctuating currency exchange rates pose significant hurdles. The need for sustainable practices and ethical sourcing adds further complexity.
Emerging Opportunities in Asia Pacific Luxury Goods Industry
Untapped markets in Southeast Asia present significant opportunities for luxury brands. The growing popularity of personalized experiences and customized products presents avenues for differentiation. The integration of technology, such as augmented reality and virtual try-ons, is transforming the customer experience, creating new growth opportunities.
Growth Accelerators in the Asia Pacific Luxury Goods Industry Industry
Technological advancements such as AI-driven personalization and innovative materials are accelerating market growth. Strategic partnerships and collaborations between luxury brands and technology companies are enhancing product offerings and customer engagement. Expansion into new markets and tapping into the rising middle class in developing Asian economies are also significant growth catalysts.
Key Players Shaping the Asia Pacific Luxury Goods Industry Market
Notable Milestones in Asia Pacific Luxury Goods Industry Sector
- June 2022: Estée Lauder's Luxury debuted its Fragrance Collection in Southeast Asia, partnering with King Power Duty-Free in Thailand.
- December 2021: Roger Dubuis opened its first standalone store in Sydney, Australia, featuring 28 exclusive timepieces.
- May 2021: The Aaron Kirman Group launched a new Asia-Pacific division to target the growing luxury market.
In-Depth Asia Pacific Luxury Goods Industry Market Outlook
The Asia Pacific luxury goods market is poised for continued robust growth, driven by increasing affluence, technological advancements, and evolving consumer preferences. Strategic investments in e-commerce, personalization, and sustainable practices will be crucial for success. Brands that effectively adapt to changing consumer demands and leverage technological innovations will capture the greatest market share in the years to come.
Asia Pacific Luxury Goods Industry Segmentation
-
1. Type
- 1.1. Clothing and Apparel
- 1.2. Footwear
- 1.3. Bags
- 1.4. Jewelry
- 1.5. Watches
- 1.6. Other Types
-
2. Distribution Channel
- 2.1. Single-branded Stores
- 2.2. Multi-brand Stores
- 2.3. Online Stores
- 2.4. Other Distribution Channels
-
3. Geography
- 3.1. China
- 3.2. Japan
- 3.3. India
- 3.4. Australia
- 3.5. South Korea
- 3.6. Rest of Asia-Pacific
Asia Pacific Luxury Goods Industry Segmentation By Geography
- 1. China
- 2. Japan
- 3. India
- 4. Australia
- 5. South Korea
- 6. Rest of Asia Pacific
Asia Pacific Luxury Goods Industry Regional Market Share
Geographic Coverage of Asia Pacific Luxury Goods Industry
Asia Pacific Luxury Goods Industry REPORT HIGHLIGHTS
| Aspects | Details |
|---|---|
| Study Period | 2020-2034 |
| Base Year | 2025 |
| Estimated Year | 2026 |
| Forecast Period | 2026-2034 |
| Historical Period | 2020-2025 |
| Growth Rate | CAGR of 4.06% from 2020-2034 |
| Segmentation |
|
Table of Contents
- 1. Introduction
- 1.1. Research Scope
- 1.2. Market Segmentation
- 1.3. Research Objective
- 1.4. Definitions and Assumptions
- 2. Executive Summary
- 2.1. Market Snapshot
- 3. Market Dynamics
- 3.1. Market Drivers
- 3.2. Market Restrains
- 3.3. Market Trends
- 3.4. Market Opportunities
- 4. Market Factor Analysis
- 4.1. Porters Five Forces
- 4.1.1. Bargaining Power of Suppliers
- 4.1.2. Bargaining Power of Buyers
- 4.1.3. Threat of New Entrants
- 4.1.4. Threat of Substitutes
- 4.1.5. Competitive Rivalry
- 4.2. PESTEL analysis
- 4.3. BCG Analysis
- 4.3.1. Stars (High Growth, High Market Share)
- 4.3.2. Cash Cows (Low Growth, High Market Share)
- 4.3.3. Question Mark (High Growth, Low Market Share)
- 4.3.4. Dogs (Low Growth, Low Market Share)
- 4.4. Ansoff Matrix Analysis
- 4.5. Supply Chain Analysis
- 4.6. Regulatory Landscape
- 4.7. Current Market Potential and Opportunity Assessment (TAM–SAM–SOM Framework)
- 4.8. VDR Analyst Note
- 4.1. Porters Five Forces
- 5. Market Analysis, Insights and Forecast 2021-2033
- 5.1. Market Analysis, Insights and Forecast - by Type
- 5.1.1. Clothing and Apparel
- 5.1.2. Footwear
- 5.1.3. Bags
- 5.1.4. Jewelry
- 5.1.5. Watches
- 5.1.6. Other Types
- 5.2. Market Analysis, Insights and Forecast - by Distribution Channel
- 5.2.1. Single-branded Stores
- 5.2.2. Multi-brand Stores
- 5.2.3. Online Stores
- 5.2.4. Other Distribution Channels
- 5.3. Market Analysis, Insights and Forecast - by Geography
- 5.3.1. China
- 5.3.2. Japan
- 5.3.3. India
- 5.3.4. Australia
- 5.3.5. South Korea
- 5.3.6. Rest of Asia-Pacific
- 5.4. Market Analysis, Insights and Forecast - by Region
- 5.4.1. China
- 5.4.2. Japan
- 5.4.3. India
- 5.4.4. Australia
- 5.4.5. South Korea
- 5.4.6. Rest of Asia Pacific
- 5.1. Market Analysis, Insights and Forecast - by Type
- 6. Asia Pacific Luxury Goods Industry Analysis, Insights and Forecast, 2021-2033
- 6.1. Market Analysis, Insights and Forecast - by Type
- 6.1.1. Clothing and Apparel
- 6.1.2. Footwear
- 6.1.3. Bags
- 6.1.4. Jewelry
- 6.1.5. Watches
- 6.1.6. Other Types
- 6.2. Market Analysis, Insights and Forecast - by Distribution Channel
- 6.2.1. Single-branded Stores
- 6.2.2. Multi-brand Stores
- 6.2.3. Online Stores
- 6.2.4. Other Distribution Channels
- 6.3. Market Analysis, Insights and Forecast - by Geography
- 6.3.1. China
- 6.3.2. Japan
- 6.3.3. India
- 6.3.4. Australia
- 6.3.5. South Korea
- 6.3.6. Rest of Asia-Pacific
- 6.1. Market Analysis, Insights and Forecast - by Type
- 7. China Asia Pacific Luxury Goods Industry Analysis, Insights and Forecast, 2021-2033
- 7.1. Market Analysis, Insights and Forecast - by Type
- 7.1.1. Clothing and Apparel
- 7.1.2. Footwear
- 7.1.3. Bags
- 7.1.4. Jewelry
- 7.1.5. Watches
- 7.1.6. Other Types
- 7.2. Market Analysis, Insights and Forecast - by Distribution Channel
- 7.2.1. Single-branded Stores
- 7.2.2. Multi-brand Stores
- 7.2.3. Online Stores
- 7.2.4. Other Distribution Channels
- 7.3. Market Analysis, Insights and Forecast - by Geography
- 7.3.1. China
- 7.3.2. Japan
- 7.3.3. India
- 7.3.4. Australia
- 7.3.5. South Korea
- 7.3.6. Rest of Asia-Pacific
- 7.1. Market Analysis, Insights and Forecast - by Type
- 8. Japan Asia Pacific Luxury Goods Industry Analysis, Insights and Forecast, 2021-2033
- 8.1. Market Analysis, Insights and Forecast - by Type
- 8.1.1. Clothing and Apparel
- 8.1.2. Footwear
- 8.1.3. Bags
- 8.1.4. Jewelry
- 8.1.5. Watches
- 8.1.6. Other Types
- 8.2. Market Analysis, Insights and Forecast - by Distribution Channel
- 8.2.1. Single-branded Stores
- 8.2.2. Multi-brand Stores
- 8.2.3. Online Stores
- 8.2.4. Other Distribution Channels
- 8.3. Market Analysis, Insights and Forecast - by Geography
- 8.3.1. China
- 8.3.2. Japan
- 8.3.3. India
- 8.3.4. Australia
- 8.3.5. South Korea
- 8.3.6. Rest of Asia-Pacific
- 8.1. Market Analysis, Insights and Forecast - by Type
- 9. India Asia Pacific Luxury Goods Industry Analysis, Insights and Forecast, 2021-2033
- 9.1. Market Analysis, Insights and Forecast - by Type
- 9.1.1. Clothing and Apparel
- 9.1.2. Footwear
- 9.1.3. Bags
- 9.1.4. Jewelry
- 9.1.5. Watches
- 9.1.6. Other Types
- 9.2. Market Analysis, Insights and Forecast - by Distribution Channel
- 9.2.1. Single-branded Stores
- 9.2.2. Multi-brand Stores
- 9.2.3. Online Stores
- 9.2.4. Other Distribution Channels
- 9.3. Market Analysis, Insights and Forecast - by Geography
- 9.3.1. China
- 9.3.2. Japan
- 9.3.3. India
- 9.3.4. Australia
- 9.3.5. South Korea
- 9.3.6. Rest of Asia-Pacific
- 9.1. Market Analysis, Insights and Forecast - by Type
- 10. Australia Asia Pacific Luxury Goods Industry Analysis, Insights and Forecast, 2021-2033
- 10.1. Market Analysis, Insights and Forecast - by Type
- 10.1.1. Clothing and Apparel
- 10.1.2. Footwear
- 10.1.3. Bags
- 10.1.4. Jewelry
- 10.1.5. Watches
- 10.1.6. Other Types
- 10.2. Market Analysis, Insights and Forecast - by Distribution Channel
- 10.2.1. Single-branded Stores
- 10.2.2. Multi-brand Stores
- 10.2.3. Online Stores
- 10.2.4. Other Distribution Channels
- 10.3. Market Analysis, Insights and Forecast - by Geography
- 10.3.1. China
- 10.3.2. Japan
- 10.3.3. India
- 10.3.4. Australia
- 10.3.5. South Korea
- 10.3.6. Rest of Asia-Pacific
- 10.1. Market Analysis, Insights and Forecast - by Type
- 11. South Korea Asia Pacific Luxury Goods Industry Analysis, Insights and Forecast, 2021-2033
- 11.1. Market Analysis, Insights and Forecast - by Type
- 11.1.1. Clothing and Apparel
- 11.1.2. Footwear
- 11.1.3. Bags
- 11.1.4. Jewelry
- 11.1.5. Watches
- 11.1.6. Other Types
- 11.2. Market Analysis, Insights and Forecast - by Distribution Channel
- 11.2.1. Single-branded Stores
- 11.2.2. Multi-brand Stores
- 11.2.3. Online Stores
- 11.2.4. Other Distribution Channels
- 11.3. Market Analysis, Insights and Forecast - by Geography
- 11.3.1. China
- 11.3.2. Japan
- 11.3.3. India
- 11.3.4. Australia
- 11.3.5. South Korea
- 11.3.6. Rest of Asia-Pacific
- 11.1. Market Analysis, Insights and Forecast - by Type
- 12. Rest of Asia Pacific Asia Pacific Luxury Goods Industry Analysis, Insights and Forecast, 2021-2033
- 12.1. Market Analysis, Insights and Forecast - by Type
- 12.1.1. Clothing and Apparel
- 12.1.2. Footwear
- 12.1.3. Bags
- 12.1.4. Jewelry
- 12.1.5. Watches
- 12.1.6. Other Types
- 12.2. Market Analysis, Insights and Forecast - by Distribution Channel
- 12.2.1. Single-branded Stores
- 12.2.2. Multi-brand Stores
- 12.2.3. Online Stores
- 12.2.4. Other Distribution Channels
- 12.3. Market Analysis, Insights and Forecast - by Geography
- 12.3.1. China
- 12.3.2. Japan
- 12.3.3. India
- 12.3.4. Australia
- 12.3.5. South Korea
- 12.3.6. Rest of Asia-Pacific
- 12.1. Market Analysis, Insights and Forecast - by Type
- 13. Competitive Analysis
- 13.1. Company Profiles
- 13.1.1 LVMH Moet Hennessy
- 13.1.1.1. Company Overview
- 13.1.1.2. Products
- 13.1.1.3. Company Financials
- 13.1.1.4. SWOT Analysis
- 13.1.2 Hermes International SA
- 13.1.2.1. Company Overview
- 13.1.2.2. Products
- 13.1.2.3. Company Financials
- 13.1.2.4. SWOT Analysis
- 13.1.3 Kering SA
- 13.1.3.1. Company Overview
- 13.1.3.2. Products
- 13.1.3.3. Company Financials
- 13.1.3.4. SWOT Analysis
- 13.1.4 Compagnie Financiere Richemont SA
- 13.1.4.1. Company Overview
- 13.1.4.2. Products
- 13.1.4.3. Company Financials
- 13.1.4.4. SWOT Analysis
- 13.1.5 The Estee Lauder Company
- 13.1.5.1. Company Overview
- 13.1.5.2. Products
- 13.1.5.3. Company Financials
- 13.1.5.4. SWOT Analysis
- 13.1.6 Prada SpA
- 13.1.6.1. Company Overview
- 13.1.6.2. Products
- 13.1.6.3. Company Financials
- 13.1.6.4. SWOT Analysis
- 13.1.7 L'Oreal SA
- 13.1.7.1. Company Overview
- 13.1.7.2. Products
- 13.1.7.3. Company Financials
- 13.1.7.4. SWOT Analysis
- 13.1.8 Chanel SA
- 13.1.8.1. Company Overview
- 13.1.8.2. Products
- 13.1.8.3. Company Financials
- 13.1.8.4. SWOT Analysis
- 13.1.9 The Swatch Group*List Not Exhaustive
- 13.1.9.1. Company Overview
- 13.1.9.2. Products
- 13.1.9.3. Company Financials
- 13.1.9.4. SWOT Analysis
- 13.1.10 Rolex SA
- 13.1.10.1. Company Overview
- 13.1.10.2. Products
- 13.1.10.3. Company Financials
- 13.1.10.4. SWOT Analysis
- 13.1.1 LVMH Moet Hennessy
- 13.2. Market Entropy
- 13.2.1 Company's Key Areas Served
- 13.2.2 Recent Developments
- 13.3. Company Market Share Analysis 2025
- 13.3.1 Top 5 Companies Market Share Analysis
- 13.3.2 Top 3 Companies Market Share Analysis
- 13.4. List of Potential Customers
- 14. Research Methodology
List of Figures
- Figure 1: Asia Pacific Luxury Goods Industry Revenue Breakdown (Million, %) by Product 2025 & 2033
- Figure 2: Asia Pacific Luxury Goods Industry Share (%) by Company 2025
List of Tables
- Table 1: Asia Pacific Luxury Goods Industry Revenue Million Forecast, by Type 2020 & 2033
- Table 2: Asia Pacific Luxury Goods Industry Volume K Units Forecast, by Type 2020 & 2033
- Table 3: Asia Pacific Luxury Goods Industry Revenue Million Forecast, by Distribution Channel 2020 & 2033
- Table 4: Asia Pacific Luxury Goods Industry Volume K Units Forecast, by Distribution Channel 2020 & 2033
- Table 5: Asia Pacific Luxury Goods Industry Revenue Million Forecast, by Geography 2020 & 2033
- Table 6: Asia Pacific Luxury Goods Industry Volume K Units Forecast, by Geography 2020 & 2033
- Table 7: Asia Pacific Luxury Goods Industry Revenue Million Forecast, by Region 2020 & 2033
- Table 8: Asia Pacific Luxury Goods Industry Volume K Units Forecast, by Region 2020 & 2033
- Table 9: Asia Pacific Luxury Goods Industry Revenue Million Forecast, by Type 2020 & 2033
- Table 10: Asia Pacific Luxury Goods Industry Volume K Units Forecast, by Type 2020 & 2033
- Table 11: Asia Pacific Luxury Goods Industry Revenue Million Forecast, by Distribution Channel 2020 & 2033
- Table 12: Asia Pacific Luxury Goods Industry Volume K Units Forecast, by Distribution Channel 2020 & 2033
- Table 13: Asia Pacific Luxury Goods Industry Revenue Million Forecast, by Geography 2020 & 2033
- Table 14: Asia Pacific Luxury Goods Industry Volume K Units Forecast, by Geography 2020 & 2033
- Table 15: Asia Pacific Luxury Goods Industry Revenue Million Forecast, by Country 2020 & 2033
- Table 16: Asia Pacific Luxury Goods Industry Volume K Units Forecast, by Country 2020 & 2033
- Table 17: Asia Pacific Luxury Goods Industry Revenue Million Forecast, by Type 2020 & 2033
- Table 18: Asia Pacific Luxury Goods Industry Volume K Units Forecast, by Type 2020 & 2033
- Table 19: Asia Pacific Luxury Goods Industry Revenue Million Forecast, by Distribution Channel 2020 & 2033
- Table 20: Asia Pacific Luxury Goods Industry Volume K Units Forecast, by Distribution Channel 2020 & 2033
- Table 21: Asia Pacific Luxury Goods Industry Revenue Million Forecast, by Geography 2020 & 2033
- Table 22: Asia Pacific Luxury Goods Industry Volume K Units Forecast, by Geography 2020 & 2033
- Table 23: Asia Pacific Luxury Goods Industry Revenue Million Forecast, by Country 2020 & 2033
- Table 24: Asia Pacific Luxury Goods Industry Volume K Units Forecast, by Country 2020 & 2033
- Table 25: Asia Pacific Luxury Goods Industry Revenue Million Forecast, by Type 2020 & 2033
- Table 26: Asia Pacific Luxury Goods Industry Volume K Units Forecast, by Type 2020 & 2033
- Table 27: Asia Pacific Luxury Goods Industry Revenue Million Forecast, by Distribution Channel 2020 & 2033
- Table 28: Asia Pacific Luxury Goods Industry Volume K Units Forecast, by Distribution Channel 2020 & 2033
- Table 29: Asia Pacific Luxury Goods Industry Revenue Million Forecast, by Geography 2020 & 2033
- Table 30: Asia Pacific Luxury Goods Industry Volume K Units Forecast, by Geography 2020 & 2033
- Table 31: Asia Pacific Luxury Goods Industry Revenue Million Forecast, by Country 2020 & 2033
- Table 32: Asia Pacific Luxury Goods Industry Volume K Units Forecast, by Country 2020 & 2033
- Table 33: Asia Pacific Luxury Goods Industry Revenue Million Forecast, by Type 2020 & 2033
- Table 34: Asia Pacific Luxury Goods Industry Volume K Units Forecast, by Type 2020 & 2033
- Table 35: Asia Pacific Luxury Goods Industry Revenue Million Forecast, by Distribution Channel 2020 & 2033
- Table 36: Asia Pacific Luxury Goods Industry Volume K Units Forecast, by Distribution Channel 2020 & 2033
- Table 37: Asia Pacific Luxury Goods Industry Revenue Million Forecast, by Geography 2020 & 2033
- Table 38: Asia Pacific Luxury Goods Industry Volume K Units Forecast, by Geography 2020 & 2033
- Table 39: Asia Pacific Luxury Goods Industry Revenue Million Forecast, by Country 2020 & 2033
- Table 40: Asia Pacific Luxury Goods Industry Volume K Units Forecast, by Country 2020 & 2033
- Table 41: Asia Pacific Luxury Goods Industry Revenue Million Forecast, by Type 2020 & 2033
- Table 42: Asia Pacific Luxury Goods Industry Volume K Units Forecast, by Type 2020 & 2033
- Table 43: Asia Pacific Luxury Goods Industry Revenue Million Forecast, by Distribution Channel 2020 & 2033
- Table 44: Asia Pacific Luxury Goods Industry Volume K Units Forecast, by Distribution Channel 2020 & 2033
- Table 45: Asia Pacific Luxury Goods Industry Revenue Million Forecast, by Geography 2020 & 2033
- Table 46: Asia Pacific Luxury Goods Industry Volume K Units Forecast, by Geography 2020 & 2033
- Table 47: Asia Pacific Luxury Goods Industry Revenue Million Forecast, by Country 2020 & 2033
- Table 48: Asia Pacific Luxury Goods Industry Volume K Units Forecast, by Country 2020 & 2033
- Table 49: Asia Pacific Luxury Goods Industry Revenue Million Forecast, by Type 2020 & 2033
- Table 50: Asia Pacific Luxury Goods Industry Volume K Units Forecast, by Type 2020 & 2033
- Table 51: Asia Pacific Luxury Goods Industry Revenue Million Forecast, by Distribution Channel 2020 & 2033
- Table 52: Asia Pacific Luxury Goods Industry Volume K Units Forecast, by Distribution Channel 2020 & 2033
- Table 53: Asia Pacific Luxury Goods Industry Revenue Million Forecast, by Geography 2020 & 2033
- Table 54: Asia Pacific Luxury Goods Industry Volume K Units Forecast, by Geography 2020 & 2033
- Table 55: Asia Pacific Luxury Goods Industry Revenue Million Forecast, by Country 2020 & 2033
- Table 56: Asia Pacific Luxury Goods Industry Volume K Units Forecast, by Country 2020 & 2033
Frequently Asked Questions
1. What is the projected Compound Annual Growth Rate (CAGR) of the Asia Pacific Luxury Goods Industry?
The projected CAGR is approximately 4.06%.
2. Which companies are prominent players in the Asia Pacific Luxury Goods Industry?
Key companies in the market include LVMH Moet Hennessy, Hermes International SA, Kering SA, Compagnie Financiere Richemont SA, The Estee Lauder Company, Prada SpA, L'Oreal SA, Chanel SA, The Swatch Group*List Not Exhaustive, Rolex SA.
3. What are the main segments of the Asia Pacific Luxury Goods Industry?
The market segments include Type, Distribution Channel, Geography.
4. Can you provide details about the market size?
The market size is estimated to be USD 141.82 Million as of 2022.
5. What are some drivers contributing to market growth?
Product Innovations to Drive Demand for Watches; Rising Demand for Premium Fashion Items.
6. What are the notable trends driving market growth?
Rising Trend of Personalization and Customization of Goods.
7. Are there any restraints impacting market growth?
Presence of Counterfeit Products.
8. Can you provide examples of recent developments in the market?
June 2022: Estée Lauder's Luxury debuted its Fragrance Collection in Southeast Asia. This is Southeast Asia's first travel retail launch of the Estée Lauder Luxury Fragrance Collection. Estée Lauder has partnered with King Power Duty-Free [part of the King Power International Group] for the exclusive launch of the Luxury Fragrance Collection in Thailand.
9. What pricing options are available for accessing the report?
Pricing options include single-user, multi-user, and enterprise licenses priced at USD 4750, USD 5250, and USD 8750 respectively.
10. Is the market size provided in terms of value or volume?
The market size is provided in terms of value, measured in Million and volume, measured in K Units.
11. Are there any specific market keywords associated with the report?
Yes, the market keyword associated with the report is "Asia Pacific Luxury Goods Industry," which aids in identifying and referencing the specific market segment covered.
12. How do I determine which pricing option suits my needs best?
The pricing options vary based on user requirements and access needs. Individual users may opt for single-user licenses, while businesses requiring broader access may choose multi-user or enterprise licenses for cost-effective access to the report.
13. Are there any additional resources or data provided in the Asia Pacific Luxury Goods Industry report?
While the report offers comprehensive insights, it's advisable to review the specific contents or supplementary materials provided to ascertain if additional resources or data are available.
14. How can I stay updated on further developments or reports in the Asia Pacific Luxury Goods Industry?
To stay informed about further developments, trends, and reports in the Asia Pacific Luxury Goods Industry, consider subscribing to industry newsletters, following relevant companies and organizations, or regularly checking reputable industry news sources and publications.
Methodology
Step 1 - Identification of Relevant Samples Size from Population Database


Step 2 - Approaches for Defining Global Market Size (Value, Volume* & Price*)

Note*: In applicable scenarios
Step 3 - Data Sources
Primary Research
- Web Analytics
- Survey Reports
- Research Institute
- Latest Research Reports
- Opinion Leaders
Secondary Research
- Annual Reports
- White Paper
- Latest Press Release
- Industry Association
- Paid Database
- Investor Presentations

Step 4 - Data Triangulation
Involves using different sources of information in order to increase the validity of a study
These sources are likely to be stakeholders in a program - participants, other researchers, program staff, other community members, and so on.
Then we put all data in single framework & apply various statistical tools to find out the dynamic on the market.
During the analysis stage, feedback from the stakeholder groups would be compared to determine areas of agreement as well as areas of divergence