

Key Insights
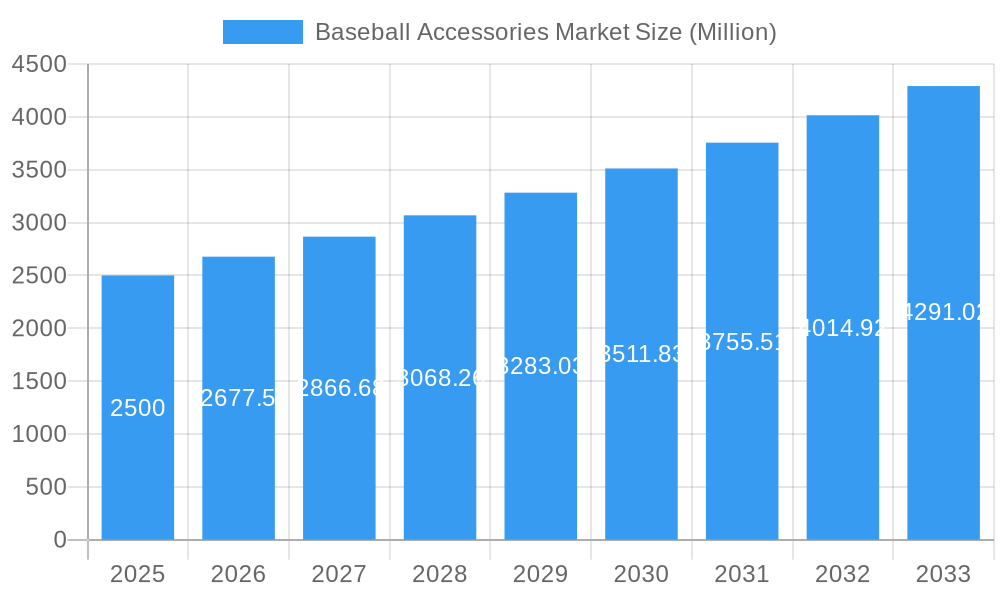
The global baseball accessories market is projected to reach $17.94 billion by 2025, with an estimated Compound Annual Growth Rate (CAGR) of 4.6% from 2025 to 2033. This sustained growth is primarily attributed to the rising popularity of baseball, especially among youth and amateur participants, driving consistent demand for essential equipment such as bats, balls, helmets, and gloves. Innovations in material science are yielding enhanced performance and durability in accessories, appealing to both professional athletes and recreational players. The proliferation of e-commerce platforms further facilitates market expansion by providing broader product accessibility and brand visibility. Strategic marketing initiatives and endorsements from influential baseball figures also play a crucial role in shaping consumer purchasing behavior.
Baseball Accessories Market Market Size (In Billion)
Despite positive growth trajectories, the market faces several hurdles. Economic downturns can suppress discretionary spending on sporting goods, potentially tempering market expansion. Intense competition among established brands and emerging niche players mandates ongoing innovation and effective marketing strategies. Fluctuations in raw material costs and supply chain disruptions present challenges to production expenses and profitability. In terms of segmentation, online retail channels are exhibiting significant growth, outpacing traditional outlets such as supermarkets and specialty sports stores. North America remains a dominant region due to its robust baseball culture and established leagues. However, the Asia-Pacific region is expected to witness considerable growth as baseball participation increases in countries like China and India. Market segmentation by product type (bats, balls, helmets, gloves, etc.) and distribution channel offers strategic opportunities for targeted marketing and product development efforts.
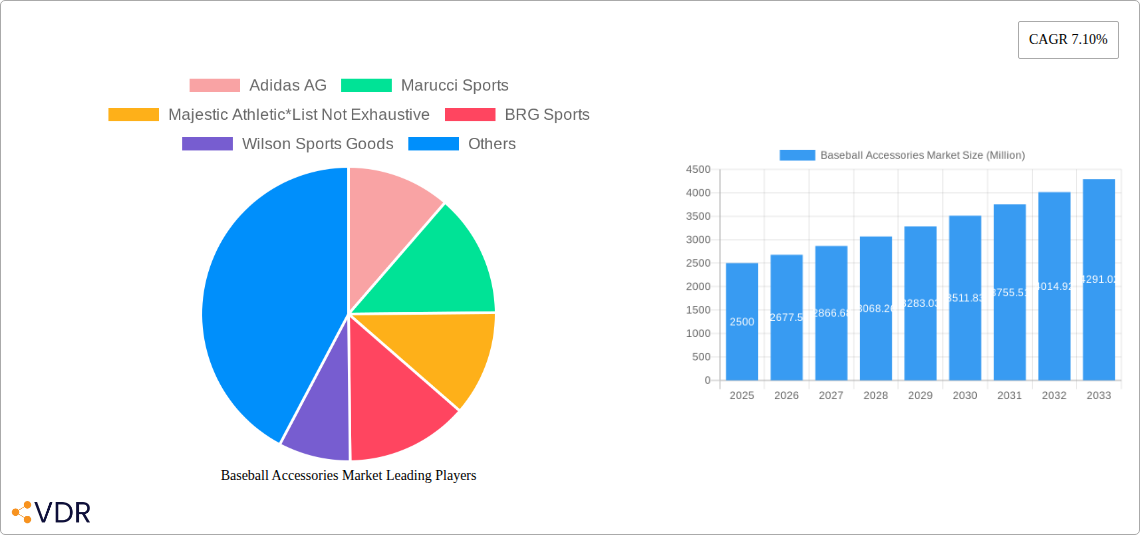
Baseball Accessories Market Company Market Share
Baseball Accessories Market: A Comprehensive Report (2019-2033)
This in-depth report provides a comprehensive analysis of the Baseball Accessories Market, encompassing market dynamics, growth trends, regional analysis, product landscape, key players, and future outlook. The study period covers 2019-2033, with 2025 as the base year and a forecast period of 2025-2033. The report segments the market by product type (Bats, Balls, Helmets, Gloves, Other Products) and distribution channel (Supermarkets/Hypermarkets, Specialty Sports Stores, Online Stores, Other Distribution Channels), offering granular insights into market size and growth potential across various segments. The market is valued at xx Million units in 2025 and is projected to reach xx Million units by 2033.
Baseball Accessories Market Market Dynamics & Structure
The Baseball Accessories market, a sub-segment of the broader Sporting Goods market, is characterized by moderate concentration with several key players vying for market share. Technological innovation, particularly in materials science (e.g., composite bats) and manufacturing processes, is a significant driver. Regulatory frameworks concerning safety standards and product certifications play a crucial role. Competitive substitutes, such as alternative sports equipment, exert some influence. The end-user demographics skew towards youth and amateur leagues, but professional leagues also significantly influence market demand. Mergers and acquisitions (M&A) activity has been relatively moderate in recent years, with a total of xx M&A deals recorded between 2019 and 2024.
- Market Concentration: Moderately concentrated, with top 5 players holding approximately xx% market share in 2024.
- Technological Innovation: Focus on lightweight, high-performance materials; 3D printing and customization gaining traction.
- Regulatory Frameworks: Safety standards for helmets and bats; impact on material selection and manufacturing.
- Competitive Substitutes: Other sports and recreational activities competing for consumer spending.
- End-User Demographics: Predominantly youth and amateur leagues, influencing product design and pricing.
- M&A Trends: Consolidation expected to increase, driven by economies of scale and expansion into new markets. xx M&A deals from 2019-2024.
Baseball Accessories Market Growth Trends & Insights
The Baseball Accessories market experienced steady growth during the historical period (2019-2024), with a CAGR of xx%. This growth is attributed to rising participation rates in baseball at various levels, increasing disposable incomes in key markets, and the growing popularity of youth leagues. Technological disruptions, such as the introduction of advanced composite materials in bats and gloves, have further fueled market expansion. Consumer behavior shifts towards premium products and personalized equipment have also contributed to market growth. The market penetration of advanced composite bats has increased from xx% in 2019 to xx% in 2024, indicating a shift in consumer preferences. The forecast period (2025-2033) anticipates continued growth, driven by factors such as increasing investment in youth baseball infrastructure and expansion into new geographic markets. The market is projected to achieve a CAGR of xx% during this period, reaching a value of xx Million units by 2033.
Dominant Regions, Countries, or Segments in Baseball Accessories Market
The North American market, particularly the United States, holds the dominant position in the global Baseball Accessories market, accounting for approximately xx% of the total market value in 2024. This dominance is attributable to the high popularity of baseball in the region, well-established leagues at all levels, and a robust sporting goods retail infrastructure. Within product types, bats and gloves contribute the largest share of the market, followed by helmets and balls. The online distribution channel is experiencing significant growth, driven by increased internet penetration and e-commerce adoption.
- Key Drivers in North America: Strong baseball culture, well-developed youth leagues, high disposable incomes.
- Growth Potential in Asia-Pacific: Rising participation rates and increasing investments in sports infrastructure.
- Europe: Moderate growth, driven by increasing participation in amateur leagues.
- Dominant Product Type: Bats and Gloves.
- Fastest-Growing Distribution Channel: Online Stores.
Baseball Accessories Market Product Landscape
Baseball accessories are continuously evolving, with innovations focused on enhancing performance, durability, and comfort. Recent advancements include the use of lighter, stronger composite materials in bats, improved glove designs for enhanced grip and ball control, and helmets with advanced safety features. Unique selling propositions often center around enhanced performance metrics, such as bat speed, ball trajectory, and glove durability. Technological advancements are driven by material science, ergonomics, and data analytics, leading to more specialized and personalized equipment.
Key Drivers, Barriers & Challenges in Baseball Accessories Market
Key Drivers: Rising participation in baseball, increasing disposable incomes, technological advancements in materials and design, and the growing popularity of youth leagues. Government investment in sports infrastructure is also a key driver.
Key Challenges & Restraints: Fluctuations in raw material prices, increasing competition, stringent regulatory compliance requirements, and potential supply chain disruptions (estimated to have impacted sales by xx% in 2022 due to material shortages).
Emerging Opportunities in Baseball Accessories Market
Emerging opportunities include the expansion into untapped markets in developing countries, the development of specialized equipment for niche segments (e.g., slow-pitch softball), and leveraging data analytics to improve product design and personalization. The increasing popularity of fantasy baseball and the use of wearable technology also present potential avenues for growth.
Growth Accelerators in the Baseball Accessories Market Industry
Strategic partnerships between equipment manufacturers and leagues or organizations can drive market growth, providing access to new markets and enhancing product visibility. Technological breakthroughs in materials science, such as the development of more durable and lighter materials, will continue to be a significant driver of growth. Investment in research and development will be essential in sustaining the innovation needed for continued expansion.
Key Players Shaping the Baseball Accessories Market Market
- Adidas AG
- Marucci Sports
- Majestic Athletic
- BRG Sports
- Wilson Sports Goods
- Franklin Sports Inc
- Amer Sports Oyj
- Mizuno Corporation
- Rawlings Sporting Goods
- Nike Inc
Notable Milestones in Baseball Accessories Market Sector
- July 2022: Rawlings Sporting Goods launched a new digital venture for baseball gloves.
- September 2021: Easton (BRG Sports) launched its 2022 bat line-up, including the ADV Hype bat.
- March 2021: Baseball Outlet became the official equipment supplier for Baseballsoftball UK (BSUK) events until at least 2024.
In-Depth Baseball Accessories Market Market Outlook
The Baseball Accessories market is poised for continued growth, driven by strong underlying trends such as rising participation rates, technological innovation, and expanding distribution channels. Strategic investments in research and development, coupled with strategic partnerships and effective marketing, will be crucial for companies to capitalize on the market's considerable growth potential. The market's long-term prospects remain positive, offering significant opportunities for both established players and new entrants.
Baseball Accessories Market Segmentation
-
1. Products Type
- 1.1. Bat
- 1.2. Ball
- 1.3. Helmet
- 1.4. Gloves
- 1.5. Other Products Types
-
2. Distribution Channel
- 2.1. Supermarkets/Hypermarkets
- 2.2. Speciality Sports Stores
- 2.3. Online Stores
- 2.4. Other Distribution Channels
Baseball Accessories Market Segmentation By Geography
-
1. North America
- 1.1. United States
- 1.2. Canada
- 1.3. Mexico
- 1.4. Rest of North America
-
2. Europe
- 2.1. United Kingdom
- 2.2. Germany
- 2.3. Spain
- 2.4. France
- 2.5. Italy
- 2.6. Russia
- 2.7. Rest of Europe
-
3. Asia Pacific
- 3.1. China
- 3.2. Japan
- 3.3. India
- 3.4. Australia
- 3.5. Rest of Asia Pacific
-
4. South America
- 4.1. Brazil
- 4.2. Argentina
- 4.3. Rest of South America
-
5. Middle East and Africa
- 5.1. Saudi Arabia
- 5.2. South Africa
- 5.3. Rest of Middle East and Africa
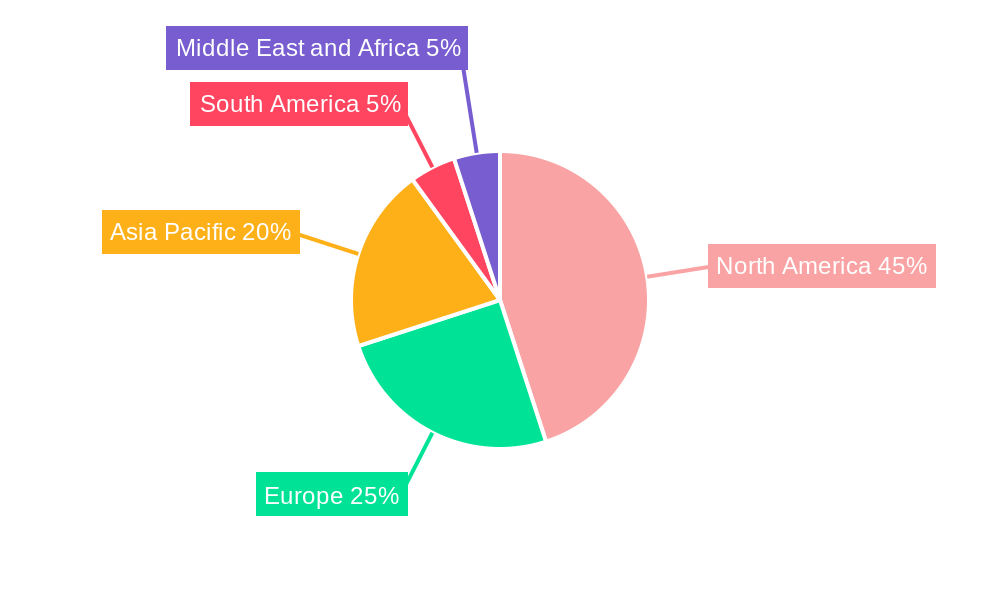
Baseball Accessories Market Regional Market Share
Geographic Coverage of Baseball Accessories Market
Baseball Accessories Market REPORT HIGHLIGHTS
| Aspects | Details |
|---|---|
| Study Period | 2020-2034 |
| Base Year | 2025 |
| Estimated Year | 2026 |
| Forecast Period | 2026-2034 |
| Historical Period | 2020-2025 |
| Growth Rate | CAGR of 4.6% from 2020-2034 |
| Segmentation |
|
Table of Contents
- 1. Introduction
- 1.1. Research Scope
- 1.2. Market Segmentation
- 1.3. Research Objective
- 1.4. Definitions and Assumptions
- 2. Executive Summary
- 2.1. Market Snapshot
- 3. Market Dynamics
- 3.1. Market Drivers
- 3.2. Market Restrains
- 3.3. Market Trends
- 3.4. Market Opportunities
- 4. Market Factor Analysis
- 4.1. Porters Five Forces
- 4.1.1. Bargaining Power of Suppliers
- 4.1.2. Bargaining Power of Buyers
- 4.1.3. Threat of New Entrants
- 4.1.4. Threat of Substitutes
- 4.1.5. Competitive Rivalry
- 4.2. PESTEL analysis
- 4.3. BCG Analysis
- 4.3.1. Stars (High Growth, High Market Share)
- 4.3.2. Cash Cows (Low Growth, High Market Share)
- 4.3.3. Question Mark (High Growth, Low Market Share)
- 4.3.4. Dogs (Low Growth, Low Market Share)
- 4.4. Ansoff Matrix Analysis
- 4.5. Supply Chain Analysis
- 4.6. Regulatory Landscape
- 4.7. Current Market Potential and Opportunity Assessment (TAM–SAM–SOM Framework)
- 4.8. VDR Analyst Note
- 4.1. Porters Five Forces
- 5. Market Analysis, Insights and Forecast 2021-2033
- 5.1. Market Analysis, Insights and Forecast - by Products Type
- 5.1.1. Bat
- 5.1.2. Ball
- 5.1.3. Helmet
- 5.1.4. Gloves
- 5.1.5. Other Products Types
- 5.2. Market Analysis, Insights and Forecast - by Distribution Channel
- 5.2.1. Supermarkets/Hypermarkets
- 5.2.2. Speciality Sports Stores
- 5.2.3. Online Stores
- 5.2.4. Other Distribution Channels
- 5.3. Market Analysis, Insights and Forecast - by Region
- 5.3.1. North America
- 5.3.2. Europe
- 5.3.3. Asia Pacific
- 5.3.4. South America
- 5.3.5. Middle East and Africa
- 5.1. Market Analysis, Insights and Forecast - by Products Type
- 6. Global Baseball Accessories Market Analysis, Insights and Forecast, 2021-2033
- 6.1. Market Analysis, Insights and Forecast - by Products Type
- 6.1.1. Bat
- 6.1.2. Ball
- 6.1.3. Helmet
- 6.1.4. Gloves
- 6.1.5. Other Products Types
- 6.2. Market Analysis, Insights and Forecast - by Distribution Channel
- 6.2.1. Supermarkets/Hypermarkets
- 6.2.2. Speciality Sports Stores
- 6.2.3. Online Stores
- 6.2.4. Other Distribution Channels
- 6.1. Market Analysis, Insights and Forecast - by Products Type
- 7. North America Baseball Accessories Market Analysis, Insights and Forecast, 2021-2033
- 7.1. Market Analysis, Insights and Forecast - by Products Type
- 7.1.1. Bat
- 7.1.2. Ball
- 7.1.3. Helmet
- 7.1.4. Gloves
- 7.1.5. Other Products Types
- 7.2. Market Analysis, Insights and Forecast - by Distribution Channel
- 7.2.1. Supermarkets/Hypermarkets
- 7.2.2. Speciality Sports Stores
- 7.2.3. Online Stores
- 7.2.4. Other Distribution Channels
- 7.1. Market Analysis, Insights and Forecast - by Products Type
- 8. Europe Baseball Accessories Market Analysis, Insights and Forecast, 2021-2033
- 8.1. Market Analysis, Insights and Forecast - by Products Type
- 8.1.1. Bat
- 8.1.2. Ball
- 8.1.3. Helmet
- 8.1.4. Gloves
- 8.1.5. Other Products Types
- 8.2. Market Analysis, Insights and Forecast - by Distribution Channel
- 8.2.1. Supermarkets/Hypermarkets
- 8.2.2. Speciality Sports Stores
- 8.2.3. Online Stores
- 8.2.4. Other Distribution Channels
- 8.1. Market Analysis, Insights and Forecast - by Products Type
- 9. Asia Pacific Baseball Accessories Market Analysis, Insights and Forecast, 2021-2033
- 9.1. Market Analysis, Insights and Forecast - by Products Type
- 9.1.1. Bat
- 9.1.2. Ball
- 9.1.3. Helmet
- 9.1.4. Gloves
- 9.1.5. Other Products Types
- 9.2. Market Analysis, Insights and Forecast - by Distribution Channel
- 9.2.1. Supermarkets/Hypermarkets
- 9.2.2. Speciality Sports Stores
- 9.2.3. Online Stores
- 9.2.4. Other Distribution Channels
- 9.1. Market Analysis, Insights and Forecast - by Products Type
- 10. South America Baseball Accessories Market Analysis, Insights and Forecast, 2021-2033
- 10.1. Market Analysis, Insights and Forecast - by Products Type
- 10.1.1. Bat
- 10.1.2. Ball
- 10.1.3. Helmet
- 10.1.4. Gloves
- 10.1.5. Other Products Types
- 10.2. Market Analysis, Insights and Forecast - by Distribution Channel
- 10.2.1. Supermarkets/Hypermarkets
- 10.2.2. Speciality Sports Stores
- 10.2.3. Online Stores
- 10.2.4. Other Distribution Channels
- 10.1. Market Analysis, Insights and Forecast - by Products Type
- 11. Middle East and Africa Baseball Accessories Market Analysis, Insights and Forecast, 2021-2033
- 11.1. Market Analysis, Insights and Forecast - by Products Type
- 11.1.1. Bat
- 11.1.2. Ball
- 11.1.3. Helmet
- 11.1.4. Gloves
- 11.1.5. Other Products Types
- 11.2. Market Analysis, Insights and Forecast - by Distribution Channel
- 11.2.1. Supermarkets/Hypermarkets
- 11.2.2. Speciality Sports Stores
- 11.2.3. Online Stores
- 11.2.4. Other Distribution Channels
- 11.1. Market Analysis, Insights and Forecast - by Products Type
- 12. Competitive Analysis
- 12.1. Company Profiles
- 12.1.1 Adidas AG
- 12.1.1.1. Company Overview
- 12.1.1.2. Products
- 12.1.1.3. Company Financials
- 12.1.1.4. SWOT Analysis
- 12.1.2 Marucci Sports
- 12.1.2.1. Company Overview
- 12.1.2.2. Products
- 12.1.2.3. Company Financials
- 12.1.2.4. SWOT Analysis
- 12.1.3 Majestic Athletic*List Not Exhaustive
- 12.1.3.1. Company Overview
- 12.1.3.2. Products
- 12.1.3.3. Company Financials
- 12.1.3.4. SWOT Analysis
- 12.1.4 BRG Sports
- 12.1.4.1. Company Overview
- 12.1.4.2. Products
- 12.1.4.3. Company Financials
- 12.1.4.4. SWOT Analysis
- 12.1.5 Wilson Sports Goods
- 12.1.5.1. Company Overview
- 12.1.5.2. Products
- 12.1.5.3. Company Financials
- 12.1.5.4. SWOT Analysis
- 12.1.6 Franklin Sports Inc
- 12.1.6.1. Company Overview
- 12.1.6.2. Products
- 12.1.6.3. Company Financials
- 12.1.6.4. SWOT Analysis
- 12.1.7 Amer Sports Oyj
- 12.1.7.1. Company Overview
- 12.1.7.2. Products
- 12.1.7.3. Company Financials
- 12.1.7.4. SWOT Analysis
- 12.1.8 Mizuno Corporation
- 12.1.8.1. Company Overview
- 12.1.8.2. Products
- 12.1.8.3. Company Financials
- 12.1.8.4. SWOT Analysis
- 12.1.9 Rawlings Sporting Goods
- 12.1.9.1. Company Overview
- 12.1.9.2. Products
- 12.1.9.3. Company Financials
- 12.1.9.4. SWOT Analysis
- 12.1.10 Nike Inc
- 12.1.10.1. Company Overview
- 12.1.10.2. Products
- 12.1.10.3. Company Financials
- 12.1.10.4. SWOT Analysis
- 12.1.1 Adidas AG
- 12.2. Market Entropy
- 12.2.1 Company's Key Areas Served
- 12.2.2 Recent Developments
- 12.3. Company Market Share Analysis 2025
- 12.3.1 Top 5 Companies Market Share Analysis
- 12.3.2 Top 3 Companies Market Share Analysis
- 12.4. List of Potential Customers
- 13. Research Methodology
List of Figures
- Figure 1: Global Baseball Accessories Market Revenue Breakdown (billion, %) by Region 2025 & 2033
- Figure 2: Global Baseball Accessories Market Volume Breakdown (K Units, %) by Region 2025 & 2033
- Figure 3: North America Baseball Accessories Market Revenue (billion), by Products Type 2025 & 2033
- Figure 4: North America Baseball Accessories Market Volume (K Units), by Products Type 2025 & 2033
- Figure 5: North America Baseball Accessories Market Revenue Share (%), by Products Type 2025 & 2033
- Figure 6: North America Baseball Accessories Market Volume Share (%), by Products Type 2025 & 2033
- Figure 7: North America Baseball Accessories Market Revenue (billion), by Distribution Channel 2025 & 2033
- Figure 8: North America Baseball Accessories Market Volume (K Units), by Distribution Channel 2025 & 2033
- Figure 9: North America Baseball Accessories Market Revenue Share (%), by Distribution Channel 2025 & 2033
- Figure 10: North America Baseball Accessories Market Volume Share (%), by Distribution Channel 2025 & 2033
- Figure 11: North America Baseball Accessories Market Revenue (billion), by Country 2025 & 2033
- Figure 12: North America Baseball Accessories Market Volume (K Units), by Country 2025 & 2033
- Figure 13: North America Baseball Accessories Market Revenue Share (%), by Country 2025 & 2033
- Figure 14: North America Baseball Accessories Market Volume Share (%), by Country 2025 & 2033
- Figure 15: Europe Baseball Accessories Market Revenue (billion), by Products Type 2025 & 2033
- Figure 16: Europe Baseball Accessories Market Volume (K Units), by Products Type 2025 & 2033
- Figure 17: Europe Baseball Accessories Market Revenue Share (%), by Products Type 2025 & 2033
- Figure 18: Europe Baseball Accessories Market Volume Share (%), by Products Type 2025 & 2033
- Figure 19: Europe Baseball Accessories Market Revenue (billion), by Distribution Channel 2025 & 2033
- Figure 20: Europe Baseball Accessories Market Volume (K Units), by Distribution Channel 2025 & 2033
- Figure 21: Europe Baseball Accessories Market Revenue Share (%), by Distribution Channel 2025 & 2033
- Figure 22: Europe Baseball Accessories Market Volume Share (%), by Distribution Channel 2025 & 2033
- Figure 23: Europe Baseball Accessories Market Revenue (billion), by Country 2025 & 2033
- Figure 24: Europe Baseball Accessories Market Volume (K Units), by Country 2025 & 2033
- Figure 25: Europe Baseball Accessories Market Revenue Share (%), by Country 2025 & 2033
- Figure 26: Europe Baseball Accessories Market Volume Share (%), by Country 2025 & 2033
- Figure 27: Asia Pacific Baseball Accessories Market Revenue (billion), by Products Type 2025 & 2033
- Figure 28: Asia Pacific Baseball Accessories Market Volume (K Units), by Products Type 2025 & 2033
- Figure 29: Asia Pacific Baseball Accessories Market Revenue Share (%), by Products Type 2025 & 2033
- Figure 30: Asia Pacific Baseball Accessories Market Volume Share (%), by Products Type 2025 & 2033
- Figure 31: Asia Pacific Baseball Accessories Market Revenue (billion), by Distribution Channel 2025 & 2033
- Figure 32: Asia Pacific Baseball Accessories Market Volume (K Units), by Distribution Channel 2025 & 2033
- Figure 33: Asia Pacific Baseball Accessories Market Revenue Share (%), by Distribution Channel 2025 & 2033
- Figure 34: Asia Pacific Baseball Accessories Market Volume Share (%), by Distribution Channel 2025 & 2033
- Figure 35: Asia Pacific Baseball Accessories Market Revenue (billion), by Country 2025 & 2033
- Figure 36: Asia Pacific Baseball Accessories Market Volume (K Units), by Country 2025 & 2033
- Figure 37: Asia Pacific Baseball Accessories Market Revenue Share (%), by Country 2025 & 2033
- Figure 38: Asia Pacific Baseball Accessories Market Volume Share (%), by Country 2025 & 2033
- Figure 39: South America Baseball Accessories Market Revenue (billion), by Products Type 2025 & 2033
- Figure 40: South America Baseball Accessories Market Volume (K Units), by Products Type 2025 & 2033
- Figure 41: South America Baseball Accessories Market Revenue Share (%), by Products Type 2025 & 2033
- Figure 42: South America Baseball Accessories Market Volume Share (%), by Products Type 2025 & 2033
- Figure 43: South America Baseball Accessories Market Revenue (billion), by Distribution Channel 2025 & 2033
- Figure 44: South America Baseball Accessories Market Volume (K Units), by Distribution Channel 2025 & 2033
- Figure 45: South America Baseball Accessories Market Revenue Share (%), by Distribution Channel 2025 & 2033
- Figure 46: South America Baseball Accessories Market Volume Share (%), by Distribution Channel 2025 & 2033
- Figure 47: South America Baseball Accessories Market Revenue (billion), by Country 2025 & 2033
- Figure 48: South America Baseball Accessories Market Volume (K Units), by Country 2025 & 2033
- Figure 49: South America Baseball Accessories Market Revenue Share (%), by Country 2025 & 2033
- Figure 50: South America Baseball Accessories Market Volume Share (%), by Country 2025 & 2033
- Figure 51: Middle East and Africa Baseball Accessories Market Revenue (billion), by Products Type 2025 & 2033
- Figure 52: Middle East and Africa Baseball Accessories Market Volume (K Units), by Products Type 2025 & 2033
- Figure 53: Middle East and Africa Baseball Accessories Market Revenue Share (%), by Products Type 2025 & 2033
- Figure 54: Middle East and Africa Baseball Accessories Market Volume Share (%), by Products Type 2025 & 2033
- Figure 55: Middle East and Africa Baseball Accessories Market Revenue (billion), by Distribution Channel 2025 & 2033
- Figure 56: Middle East and Africa Baseball Accessories Market Volume (K Units), by Distribution Channel 2025 & 2033
- Figure 57: Middle East and Africa Baseball Accessories Market Revenue Share (%), by Distribution Channel 2025 & 2033
- Figure 58: Middle East and Africa Baseball Accessories Market Volume Share (%), by Distribution Channel 2025 & 2033
- Figure 59: Middle East and Africa Baseball Accessories Market Revenue (billion), by Country 2025 & 2033
- Figure 60: Middle East and Africa Baseball Accessories Market Volume (K Units), by Country 2025 & 2033
- Figure 61: Middle East and Africa Baseball Accessories Market Revenue Share (%), by Country 2025 & 2033
- Figure 62: Middle East and Africa Baseball Accessories Market Volume Share (%), by Country 2025 & 2033
List of Tables
- Table 1: Global Baseball Accessories Market Revenue billion Forecast, by Products Type 2020 & 2033
- Table 2: Global Baseball Accessories Market Volume K Units Forecast, by Products Type 2020 & 2033
- Table 3: Global Baseball Accessories Market Revenue billion Forecast, by Distribution Channel 2020 & 2033
- Table 4: Global Baseball Accessories Market Volume K Units Forecast, by Distribution Channel 2020 & 2033
- Table 5: Global Baseball Accessories Market Revenue billion Forecast, by Region 2020 & 2033
- Table 6: Global Baseball Accessories Market Volume K Units Forecast, by Region 2020 & 2033
- Table 7: Global Baseball Accessories Market Revenue billion Forecast, by Products Type 2020 & 2033
- Table 8: Global Baseball Accessories Market Volume K Units Forecast, by Products Type 2020 & 2033
- Table 9: Global Baseball Accessories Market Revenue billion Forecast, by Distribution Channel 2020 & 2033
- Table 10: Global Baseball Accessories Market Volume K Units Forecast, by Distribution Channel 2020 & 2033
- Table 11: Global Baseball Accessories Market Revenue billion Forecast, by Country 2020 & 2033
- Table 12: Global Baseball Accessories Market Volume K Units Forecast, by Country 2020 & 2033
- Table 13: United States Baseball Accessories Market Revenue (billion) Forecast, by Application 2020 & 2033
- Table 14: United States Baseball Accessories Market Volume (K Units) Forecast, by Application 2020 & 2033
- Table 15: Canada Baseball Accessories Market Revenue (billion) Forecast, by Application 2020 & 2033
- Table 16: Canada Baseball Accessories Market Volume (K Units) Forecast, by Application 2020 & 2033
- Table 17: Mexico Baseball Accessories Market Revenue (billion) Forecast, by Application 2020 & 2033
- Table 18: Mexico Baseball Accessories Market Volume (K Units) Forecast, by Application 2020 & 2033
- Table 19: Rest of North America Baseball Accessories Market Revenue (billion) Forecast, by Application 2020 & 2033
- Table 20: Rest of North America Baseball Accessories Market Volume (K Units) Forecast, by Application 2020 & 2033
- Table 21: Global Baseball Accessories Market Revenue billion Forecast, by Products Type 2020 & 2033
- Table 22: Global Baseball Accessories Market Volume K Units Forecast, by Products Type 2020 & 2033
- Table 23: Global Baseball Accessories Market Revenue billion Forecast, by Distribution Channel 2020 & 2033
- Table 24: Global Baseball Accessories Market Volume K Units Forecast, by Distribution Channel 2020 & 2033
- Table 25: Global Baseball Accessories Market Revenue billion Forecast, by Country 2020 & 2033
- Table 26: Global Baseball Accessories Market Volume K Units Forecast, by Country 2020 & 2033
- Table 27: United Kingdom Baseball Accessories Market Revenue (billion) Forecast, by Application 2020 & 2033
- Table 28: United Kingdom Baseball Accessories Market Volume (K Units) Forecast, by Application 2020 & 2033
- Table 29: Germany Baseball Accessories Market Revenue (billion) Forecast, by Application 2020 & 2033
- Table 30: Germany Baseball Accessories Market Volume (K Units) Forecast, by Application 2020 & 2033
- Table 31: Spain Baseball Accessories Market Revenue (billion) Forecast, by Application 2020 & 2033
- Table 32: Spain Baseball Accessories Market Volume (K Units) Forecast, by Application 2020 & 2033
- Table 33: France Baseball Accessories Market Revenue (billion) Forecast, by Application 2020 & 2033
- Table 34: France Baseball Accessories Market Volume (K Units) Forecast, by Application 2020 & 2033
- Table 35: Italy Baseball Accessories Market Revenue (billion) Forecast, by Application 2020 & 2033
- Table 36: Italy Baseball Accessories Market Volume (K Units) Forecast, by Application 2020 & 2033
- Table 37: Russia Baseball Accessories Market Revenue (billion) Forecast, by Application 2020 & 2033
- Table 38: Russia Baseball Accessories Market Volume (K Units) Forecast, by Application 2020 & 2033
- Table 39: Rest of Europe Baseball Accessories Market Revenue (billion) Forecast, by Application 2020 & 2033
- Table 40: Rest of Europe Baseball Accessories Market Volume (K Units) Forecast, by Application 2020 & 2033
- Table 41: Global Baseball Accessories Market Revenue billion Forecast, by Products Type 2020 & 2033
- Table 42: Global Baseball Accessories Market Volume K Units Forecast, by Products Type 2020 & 2033
- Table 43: Global Baseball Accessories Market Revenue billion Forecast, by Distribution Channel 2020 & 2033
- Table 44: Global Baseball Accessories Market Volume K Units Forecast, by Distribution Channel 2020 & 2033
- Table 45: Global Baseball Accessories Market Revenue billion Forecast, by Country 2020 & 2033
- Table 46: Global Baseball Accessories Market Volume K Units Forecast, by Country 2020 & 2033
- Table 47: China Baseball Accessories Market Revenue (billion) Forecast, by Application 2020 & 2033
- Table 48: China Baseball Accessories Market Volume (K Units) Forecast, by Application 2020 & 2033
- Table 49: Japan Baseball Accessories Market Revenue (billion) Forecast, by Application 2020 & 2033
- Table 50: Japan Baseball Accessories Market Volume (K Units) Forecast, by Application 2020 & 2033
- Table 51: India Baseball Accessories Market Revenue (billion) Forecast, by Application 2020 & 2033
- Table 52: India Baseball Accessories Market Volume (K Units) Forecast, by Application 2020 & 2033
- Table 53: Australia Baseball Accessories Market Revenue (billion) Forecast, by Application 2020 & 2033
- Table 54: Australia Baseball Accessories Market Volume (K Units) Forecast, by Application 2020 & 2033
- Table 55: Rest of Asia Pacific Baseball Accessories Market Revenue (billion) Forecast, by Application 2020 & 2033
- Table 56: Rest of Asia Pacific Baseball Accessories Market Volume (K Units) Forecast, by Application 2020 & 2033
- Table 57: Global Baseball Accessories Market Revenue billion Forecast, by Products Type 2020 & 2033
- Table 58: Global Baseball Accessories Market Volume K Units Forecast, by Products Type 2020 & 2033
- Table 59: Global Baseball Accessories Market Revenue billion Forecast, by Distribution Channel 2020 & 2033
- Table 60: Global Baseball Accessories Market Volume K Units Forecast, by Distribution Channel 2020 & 2033
- Table 61: Global Baseball Accessories Market Revenue billion Forecast, by Country 2020 & 2033
- Table 62: Global Baseball Accessories Market Volume K Units Forecast, by Country 2020 & 2033
- Table 63: Brazil Baseball Accessories Market Revenue (billion) Forecast, by Application 2020 & 2033
- Table 64: Brazil Baseball Accessories Market Volume (K Units) Forecast, by Application 2020 & 2033
- Table 65: Argentina Baseball Accessories Market Revenue (billion) Forecast, by Application 2020 & 2033
- Table 66: Argentina Baseball Accessories Market Volume (K Units) Forecast, by Application 2020 & 2033
- Table 67: Rest of South America Baseball Accessories Market Revenue (billion) Forecast, by Application 2020 & 2033
- Table 68: Rest of South America Baseball Accessories Market Volume (K Units) Forecast, by Application 2020 & 2033
- Table 69: Global Baseball Accessories Market Revenue billion Forecast, by Products Type 2020 & 2033
- Table 70: Global Baseball Accessories Market Volume K Units Forecast, by Products Type 2020 & 2033
- Table 71: Global Baseball Accessories Market Revenue billion Forecast, by Distribution Channel 2020 & 2033
- Table 72: Global Baseball Accessories Market Volume K Units Forecast, by Distribution Channel 2020 & 2033
- Table 73: Global Baseball Accessories Market Revenue billion Forecast, by Country 2020 & 2033
- Table 74: Global Baseball Accessories Market Volume K Units Forecast, by Country 2020 & 2033
- Table 75: Saudi Arabia Baseball Accessories Market Revenue (billion) Forecast, by Application 2020 & 2033
- Table 76: Saudi Arabia Baseball Accessories Market Volume (K Units) Forecast, by Application 2020 & 2033
- Table 77: South Africa Baseball Accessories Market Revenue (billion) Forecast, by Application 2020 & 2033
- Table 78: South Africa Baseball Accessories Market Volume (K Units) Forecast, by Application 2020 & 2033
- Table 79: Rest of Middle East and Africa Baseball Accessories Market Revenue (billion) Forecast, by Application 2020 & 2033
- Table 80: Rest of Middle East and Africa Baseball Accessories Market Volume (K Units) Forecast, by Application 2020 & 2033
Frequently Asked Questions
1. What is the projected Compound Annual Growth Rate (CAGR) of the Baseball Accessories Market?
The projected CAGR is approximately 4.6%.
2. Which companies are prominent players in the Baseball Accessories Market?
Key companies in the market include Adidas AG, Marucci Sports, Majestic Athletic*List Not Exhaustive, BRG Sports, Wilson Sports Goods, Franklin Sports Inc, Amer Sports Oyj, Mizuno Corporation, Rawlings Sporting Goods, Nike Inc.
3. What are the main segments of the Baseball Accessories Market?
The market segments include Products Type, Distribution Channel.
4. Can you provide details about the market size?
The market size is estimated to be USD 17.94 billion as of 2022.
5. What are some drivers contributing to market growth?
Increase in Sports Participation; Trend of Athleisure.
6. What are the notable trends driving market growth?
Increased Participation Rate.
7. Are there any restraints impacting market growth?
Availability of Fake and Counterfeit Products.
8. Can you provide examples of recent developments in the market?
in July 2022, Rawlings Sporting Goods Company, Inc. launched its new digital venture marking the first of its kind for the long-established baseball and softball brand under the product category of baseball gloves.
9. What pricing options are available for accessing the report?
Pricing options include single-user, multi-user, and enterprise licenses priced at USD 4750, USD 5250, and USD 8750 respectively.
10. Is the market size provided in terms of value or volume?
The market size is provided in terms of value, measured in billion and volume, measured in K Units.
11. Are there any specific market keywords associated with the report?
Yes, the market keyword associated with the report is "Baseball Accessories Market," which aids in identifying and referencing the specific market segment covered.
12. How do I determine which pricing option suits my needs best?
The pricing options vary based on user requirements and access needs. Individual users may opt for single-user licenses, while businesses requiring broader access may choose multi-user or enterprise licenses for cost-effective access to the report.
13. Are there any additional resources or data provided in the Baseball Accessories Market report?
While the report offers comprehensive insights, it's advisable to review the specific contents or supplementary materials provided to ascertain if additional resources or data are available.
14. How can I stay updated on further developments or reports in the Baseball Accessories Market?
To stay informed about further developments, trends, and reports in the Baseball Accessories Market, consider subscribing to industry newsletters, following relevant companies and organizations, or regularly checking reputable industry news sources and publications.
Methodology
Step 1 - Identification of Relevant Samples Size from Population Database


Step 2 - Approaches for Defining Global Market Size (Value, Volume* & Price*)

Note*: In applicable scenarios
Step 3 - Data Sources
Primary Research
- Web Analytics
- Survey Reports
- Research Institute
- Latest Research Reports
- Opinion Leaders
Secondary Research
- Annual Reports
- White Paper
- Latest Press Release
- Industry Association
- Paid Database
- Investor Presentations

Step 4 - Data Triangulation
Involves using different sources of information in order to increase the validity of a study
These sources are likely to be stakeholders in a program - participants, other researchers, program staff, other community members, and so on.
Then we put all data in single framework & apply various statistical tools to find out the dynamic on the market.
During the analysis stage, feedback from the stakeholder groups would be compared to determine areas of agreement as well as areas of divergence