

Key Insights
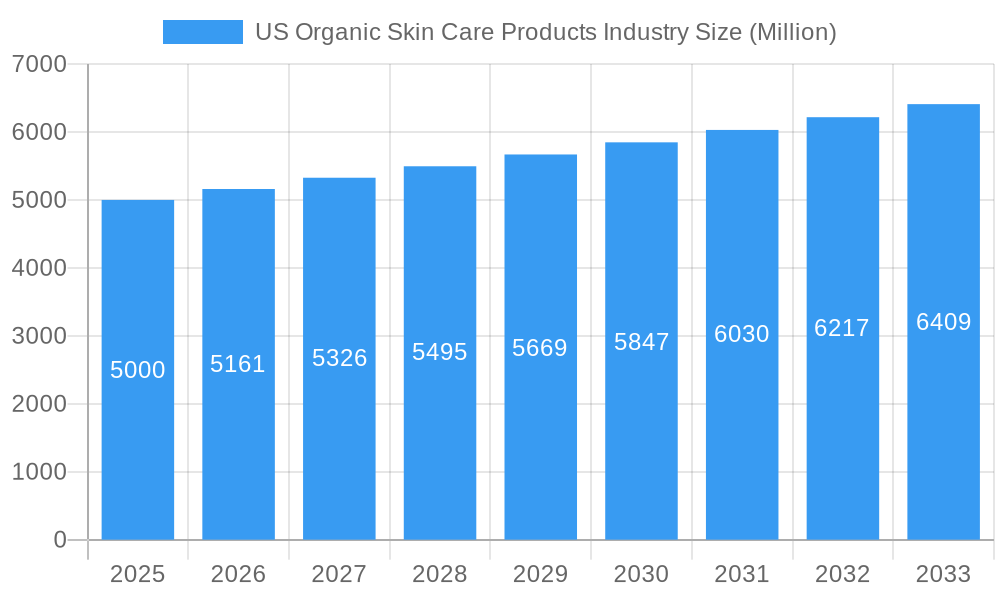
The US organic skincare products market is experiencing robust growth, driven by increasing consumer awareness of the harmful effects of synthetic chemicals in conventional skincare and a rising preference for natural and sustainable products. The market, valued at approximately $5 billion in 2025, is projected to maintain a steady Compound Annual Growth Rate (CAGR) of 3.22% from 2025 to 2033, reaching an estimated value exceeding $7 billion by 2033. This growth is fueled by several key trends, including the increasing popularity of vegan and cruelty-free products, the growing demand for personalized skincare solutions, and the expansion of e-commerce channels providing wider access to organic brands. Consumers are increasingly seeking out products with transparent ingredient lists and certifications verifying their organic status, contributing to market expansion. The segment encompassing facial care products currently dominates market share, followed by body care, with online retail stores experiencing the fastest growth in distribution channels due to their convenience and accessibility.
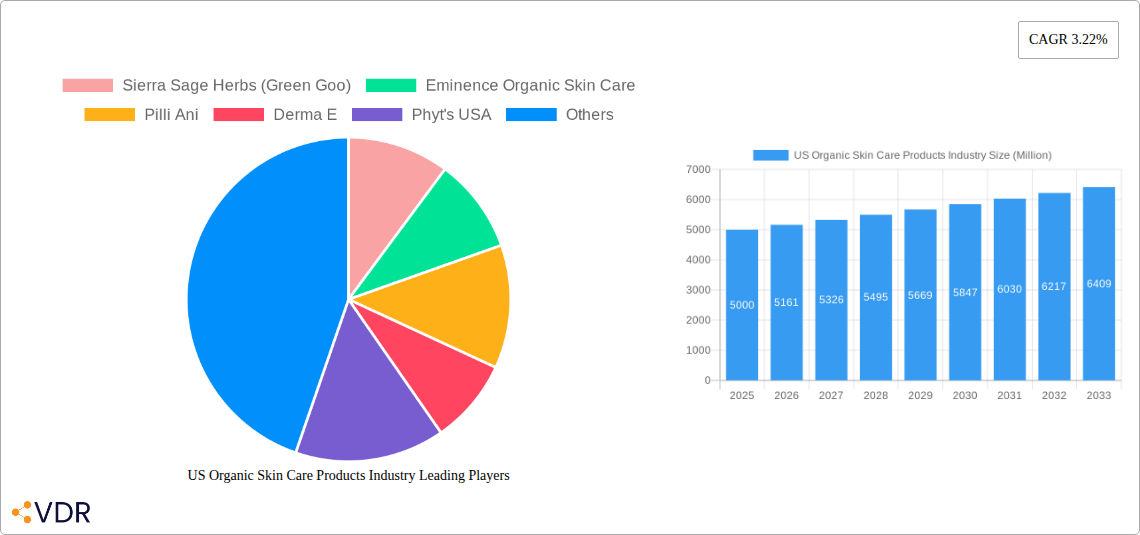
US Organic Skin Care Products Industry Market Size (In Billion)
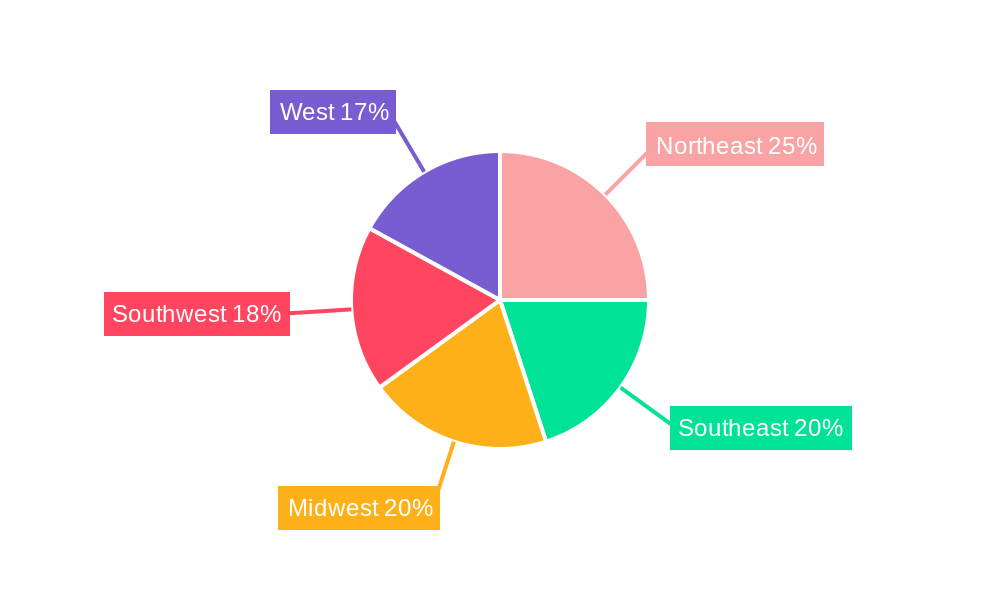
While the market faces restraints such as the higher price point of organic products compared to conventional alternatives and potential supply chain complexities in sourcing sustainably grown and ethically harvested ingredients, these challenges are being overcome through innovations in production and distribution, along with increased consumer willingness to invest in premium, healthier skincare options. The competitive landscape includes both established multinational corporations like L'Oreal and Johnson & Johnson, alongside a thriving ecosystem of smaller, niche organic brands focusing on specific consumer needs and values. This diverse range of offerings caters to a widening consumer base seeking effective and ethically sourced skincare solutions. Regional variations exist within the US market, with regions like the West Coast exhibiting stronger adoption rates of organic products due to existing environmentally conscious consumer bases. The continued expansion of the organic skincare market in the US will be shaped by further technological advancements in formulation, marketing, and distribution.
US Organic Skin Care Products Industry Company Market Share
US Organic Skin Care Products Industry Market Report: 2019-2033
This comprehensive report provides an in-depth analysis of the US organic skin care products industry, covering market dynamics, growth trends, competitive landscape, and future outlook. The report utilizes data from the historical period (2019-2024), base year (2025), and estimated year (2025) to forecast market trends through 2033. This report is essential for industry professionals, investors, and anyone seeking a complete understanding of this rapidly expanding market segment. The market is segmented by product type (facial care, body care, other) and distribution channel (supermarkets/hypermarkets, specialty retail stores, online retail stores, other).
US Organic Skin Care Products Industry Market Dynamics & Structure
The US organic skin care products market is characterized by a dynamic interplay of factors influencing its structure and growth. Market concentration is moderate, with a mix of large multinational corporations and smaller, niche players. Technological innovation, driven by advancements in organic ingredient sourcing and formulation, plays a significant role. Stringent regulatory frameworks, particularly concerning labeling and ingredient claims, shape the competitive landscape. The market witnesses continuous innovation in product formulations, packaging, and delivery systems, enhancing consumer appeal. The growing consumer awareness of harmful chemicals in conventional skincare products fuels demand for organic alternatives. Mergers and acquisitions (M&A) activity is relatively moderate, with strategic acquisitions aimed at expanding product portfolios or gaining market share.
- Market Concentration: Moderately concentrated, with top 5 players holding xx% market share (2025).
- Technological Innovation: Focus on sustainable sourcing, eco-friendly packaging, and advanced delivery systems.
- Regulatory Framework: Stringent FDA guidelines regarding labeling and ingredient safety.
- Competitive Substitutes: Conventional skin care products.
- End-User Demographics: Primarily millennials and Gen Z, health-conscious consumers.
- M&A Trends: Strategic acquisitions to expand product lines and distribution networks; xx M&A deals in the last 5 years.
US Organic Skin Care Products Industry Growth Trends & Insights
The US organic skin care market exhibits robust growth, driven by escalating consumer demand for natural and sustainable products. The market size is projected to reach xx million units by 2025, with a Compound Annual Growth Rate (CAGR) of xx% during the forecast period (2025-2033). Increased consumer awareness regarding the potential harmful effects of chemicals in conventional cosmetics fuels the adoption of organic alternatives. Technological disruptions, particularly in ingredient extraction and formulation, further contribute to market expansion. Shifting consumer preferences toward personalized skincare solutions and clean beauty trends significantly influence market growth. Market penetration of organic skin care products continues to rise, driven by increasing affordability and wider availability.
Dominant Regions, Countries, or Segments in US Organic Skin Care Products Industry
The US organic skin care market is geographically diverse, with significant growth observed across various regions. However, the highest growth is projected for [Specific Region, e.g., Western US] due to [Reason, e.g., higher consumer disposable income and adoption of eco-conscious lifestyles]. Within product types, facial care dominates, accounting for xx% of the market in 2025, driven by the wide range of products available, from cleansers and toners to serums and masks. Similarly, online retail stores are the fastest-growing distribution channel, accounting for xx% of sales in 2025, reflecting the rising popularity of e-commerce and online shopping.
- Leading Region: [Specific Region, e.g., Western US], driven by [Reasons, e.g., high consumer spending and environmental consciousness].
- Leading Product Type: Facial care, owing to its versatility and diverse product offerings.
- Leading Distribution Channel: Online retail stores, reflecting the growing e-commerce adoption.
US Organic Skin Care Products Industry Product Landscape
The US organic skin care product landscape is dynamic, characterized by continuous innovation in formulations, packaging, and delivery systems. Products are formulated using certified organic ingredients, emphasizing natural efficacy and minimal environmental impact. Brands often highlight unique selling propositions (USPs) like sustainability, ethical sourcing, and cruelty-free practices. Technological advancements include the use of nanotechnology for enhanced ingredient absorption and bio-fermentation for producing potent active compounds.
Key Drivers, Barriers & Challenges in US Organic Skin Care Products Industry
Key Drivers: Growing consumer awareness of harmful chemicals in conventional skincare, rising demand for natural and sustainable products, increased disposable income, and technological advancements in organic formulations.
Key Challenges: Supply chain complexities, particularly ensuring consistent quality and availability of organic ingredients, regulatory hurdles around labeling and ingredient claims, and intense competition from established players and new entrants, leading to price wars and impacting profitability. xx% of companies report supply chain issues impacting production.
Emerging Opportunities in US Organic Skin Care Products Industry
Emerging opportunities include the rise of personalized skincare solutions based on individual skin needs, growing demand for organic men's grooming products, and the untapped potential in niche markets like organic sunscreens and anti-aging treatments.
Growth Accelerators in the US Organic Skin Care Products Industry
Long-term growth is fueled by strategic partnerships between organic ingredient suppliers and skincare brands, expansion into new markets, and innovative product development focused on addressing specific consumer needs like sensitive skin or acne-prone skin.
Key Players Shaping the US Organic Skin Care Products Industry Market
- Sierra Sage Herbs (Green Goo)
- Eminence Organic Skin Care
- Pilli Ani
- Derma E
- Phyt's USA
- Starflower Essentials Organic Skin Care
- L'Oreal SA
- Botanic Organic LLC
- Johnson & Johnson (Neutrogena)
- Renee Cosmetics
- Thesis Beauty
- The Hain Celestial Group (Avalon Natural Products Inc)
Notable Milestones in US Organic Skin Care Products Industry Sector
- January 2021: Renee Cosmetics launched premium face oils, expanding the organic facial care segment.
- January 2022: Pilli Ani expanded its US portfolio with a cleanser and toner, increasing competition in the facial care segment.
- November 2022: Eminence Organic Skin Care launched a range of cleansers for different skin types, enhancing its product portfolio and market position.
In-Depth US Organic Skin Care Products Industry Market Outlook
The future of the US organic skin care market is promising, with continuous growth expected due to evolving consumer preferences and technological advancements. Strategic opportunities exist in personalized skincare, men's grooming, and the development of innovative organic formulations addressing unmet consumer needs. The market’s expansion will be driven by increasing consumer awareness, strong regulatory support of organic products, and the continued efforts of key players to innovate and expand their product offerings.
US Organic Skin Care Products Industry Segmentation
-
1. Product Type
-
1.1. Facial Care
- 1.1.1. Cleansers (including Exfoliators/Facial Scrubs)
- 1.1.2. Moisturizers and Oils/Serums
- 1.1.3. Face Masks and Packs
- 1.1.4. Other Facial Care Products
-
1.2. Body Care
- 1.2.1. Body Lotions
- 1.2.2. Body Wash
- 1.2.3. Other Body Care Products
-
1.1. Facial Care
-
2. Distribution Channel
- 2.1. Supermarkets/Hypermarkets
- 2.2. Specialty Retail Stores
- 2.3. Online Retail Stores
- 2.4. Other Distribution Channels
US Organic Skin Care Products Industry Segmentation By Geography
-
1. North America
- 1.1. United States
- 1.2. Canada
- 1.3. Mexico
-
2. South America
- 2.1. Brazil
- 2.2. Argentina
- 2.3. Rest of South America
-
3. Europe
- 3.1. United Kingdom
- 3.2. Germany
- 3.3. France
- 3.4. Italy
- 3.5. Spain
- 3.6. Russia
- 3.7. Benelux
- 3.8. Nordics
- 3.9. Rest of Europe
-
4. Middle East & Africa
- 4.1. Turkey
- 4.2. Israel
- 4.3. GCC
- 4.4. North Africa
- 4.5. South Africa
- 4.6. Rest of Middle East & Africa
-
5. Asia Pacific
- 5.1. China
- 5.2. India
- 5.3. Japan
- 5.4. South Korea
- 5.5. ASEAN
- 5.6. Oceania
- 5.7. Rest of Asia Pacific
US Organic Skin Care Products Industry Regional Market Share
Geographic Coverage of US Organic Skin Care Products Industry
US Organic Skin Care Products Industry REPORT HIGHLIGHTS
| Aspects | Details |
|---|---|
| Study Period | 2020-2034 |
| Base Year | 2025 |
| Estimated Year | 2026 |
| Forecast Period | 2026-2034 |
| Historical Period | 2020-2025 |
| Growth Rate | CAGR of 8.9% from 2020-2034 |
| Segmentation |
|
Table of Contents
- 1. Introduction
- 1.1. Research Scope
- 1.2. Market Segmentation
- 1.3. Research Objective
- 1.4. Definitions and Assumptions
- 2. Executive Summary
- 2.1. Market Snapshot
- 3. Market Dynamics
- 3.1. Market Drivers
- 3.2. Market Restrains
- 3.3. Market Trends
- 3.4. Market Opportunities
- 4. Market Factor Analysis
- 4.1. Porters Five Forces
- 4.1.1. Bargaining Power of Suppliers
- 4.1.2. Bargaining Power of Buyers
- 4.1.3. Threat of New Entrants
- 4.1.4. Threat of Substitutes
- 4.1.5. Competitive Rivalry
- 4.2. PESTEL analysis
- 4.3. BCG Analysis
- 4.3.1. Stars (High Growth, High Market Share)
- 4.3.2. Cash Cows (Low Growth, High Market Share)
- 4.3.3. Question Mark (High Growth, Low Market Share)
- 4.3.4. Dogs (Low Growth, Low Market Share)
- 4.4. Ansoff Matrix Analysis
- 4.5. Supply Chain Analysis
- 4.6. Regulatory Landscape
- 4.7. Current Market Potential and Opportunity Assessment (TAM–SAM–SOM Framework)
- 4.8. VDR Analyst Note
- 4.1. Porters Five Forces
- 5. Market Analysis, Insights and Forecast 2021-2033
- 5.1. Market Analysis, Insights and Forecast - by Product Type
- 5.1.1. Facial Care
- 5.1.1.1. Cleansers (including Exfoliators/Facial Scrubs)
- 5.1.1.2. Moisturizers and Oils/Serums
- 5.1.1.3. Face Masks and Packs
- 5.1.1.4. Other Facial Care Products
- 5.1.2. Body Care
- 5.1.2.1. Body Lotions
- 5.1.2.2. Body Wash
- 5.1.2.3. Other Body Care Products
- 5.1.1. Facial Care
- 5.2. Market Analysis, Insights and Forecast - by Distribution Channel
- 5.2.1. Supermarkets/Hypermarkets
- 5.2.2. Specialty Retail Stores
- 5.2.3. Online Retail Stores
- 5.2.4. Other Distribution Channels
- 5.3. Market Analysis, Insights and Forecast - by Region
- 5.3.1. North America
- 5.3.2. South America
- 5.3.3. Europe
- 5.3.4. Middle East & Africa
- 5.3.5. Asia Pacific
- 5.1. Market Analysis, Insights and Forecast - by Product Type
- 6. Global US Organic Skin Care Products Industry Analysis, Insights and Forecast, 2021-2033
- 6.1. Market Analysis, Insights and Forecast - by Product Type
- 6.1.1. Facial Care
- 6.1.1.1. Cleansers (including Exfoliators/Facial Scrubs)
- 6.1.1.2. Moisturizers and Oils/Serums
- 6.1.1.3. Face Masks and Packs
- 6.1.1.4. Other Facial Care Products
- 6.1.2. Body Care
- 6.1.2.1. Body Lotions
- 6.1.2.2. Body Wash
- 6.1.2.3. Other Body Care Products
- 6.1.1. Facial Care
- 6.2. Market Analysis, Insights and Forecast - by Distribution Channel
- 6.2.1. Supermarkets/Hypermarkets
- 6.2.2. Specialty Retail Stores
- 6.2.3. Online Retail Stores
- 6.2.4. Other Distribution Channels
- 6.1. Market Analysis, Insights and Forecast - by Product Type
- 7. North America US Organic Skin Care Products Industry Analysis, Insights and Forecast, 2021-2033
- 7.1. Market Analysis, Insights and Forecast - by Product Type
- 7.1.1. Facial Care
- 7.1.1.1. Cleansers (including Exfoliators/Facial Scrubs)
- 7.1.1.2. Moisturizers and Oils/Serums
- 7.1.1.3. Face Masks and Packs
- 7.1.1.4. Other Facial Care Products
- 7.1.2. Body Care
- 7.1.2.1. Body Lotions
- 7.1.2.2. Body Wash
- 7.1.2.3. Other Body Care Products
- 7.1.1. Facial Care
- 7.2. Market Analysis, Insights and Forecast - by Distribution Channel
- 7.2.1. Supermarkets/Hypermarkets
- 7.2.2. Specialty Retail Stores
- 7.2.3. Online Retail Stores
- 7.2.4. Other Distribution Channels
- 7.1. Market Analysis, Insights and Forecast - by Product Type
- 8. South America US Organic Skin Care Products Industry Analysis, Insights and Forecast, 2021-2033
- 8.1. Market Analysis, Insights and Forecast - by Product Type
- 8.1.1. Facial Care
- 8.1.1.1. Cleansers (including Exfoliators/Facial Scrubs)
- 8.1.1.2. Moisturizers and Oils/Serums
- 8.1.1.3. Face Masks and Packs
- 8.1.1.4. Other Facial Care Products
- 8.1.2. Body Care
- 8.1.2.1. Body Lotions
- 8.1.2.2. Body Wash
- 8.1.2.3. Other Body Care Products
- 8.1.1. Facial Care
- 8.2. Market Analysis, Insights and Forecast - by Distribution Channel
- 8.2.1. Supermarkets/Hypermarkets
- 8.2.2. Specialty Retail Stores
- 8.2.3. Online Retail Stores
- 8.2.4. Other Distribution Channels
- 8.1. Market Analysis, Insights and Forecast - by Product Type
- 9. Europe US Organic Skin Care Products Industry Analysis, Insights and Forecast, 2021-2033
- 9.1. Market Analysis, Insights and Forecast - by Product Type
- 9.1.1. Facial Care
- 9.1.1.1. Cleansers (including Exfoliators/Facial Scrubs)
- 9.1.1.2. Moisturizers and Oils/Serums
- 9.1.1.3. Face Masks and Packs
- 9.1.1.4. Other Facial Care Products
- 9.1.2. Body Care
- 9.1.2.1. Body Lotions
- 9.1.2.2. Body Wash
- 9.1.2.3. Other Body Care Products
- 9.1.1. Facial Care
- 9.2. Market Analysis, Insights and Forecast - by Distribution Channel
- 9.2.1. Supermarkets/Hypermarkets
- 9.2.2. Specialty Retail Stores
- 9.2.3. Online Retail Stores
- 9.2.4. Other Distribution Channels
- 9.1. Market Analysis, Insights and Forecast - by Product Type
- 10. Middle East & Africa US Organic Skin Care Products Industry Analysis, Insights and Forecast, 2021-2033
- 10.1. Market Analysis, Insights and Forecast - by Product Type
- 10.1.1. Facial Care
- 10.1.1.1. Cleansers (including Exfoliators/Facial Scrubs)
- 10.1.1.2. Moisturizers and Oils/Serums
- 10.1.1.3. Face Masks and Packs
- 10.1.1.4. Other Facial Care Products
- 10.1.2. Body Care
- 10.1.2.1. Body Lotions
- 10.1.2.2. Body Wash
- 10.1.2.3. Other Body Care Products
- 10.1.1. Facial Care
- 10.2. Market Analysis, Insights and Forecast - by Distribution Channel
- 10.2.1. Supermarkets/Hypermarkets
- 10.2.2. Specialty Retail Stores
- 10.2.3. Online Retail Stores
- 10.2.4. Other Distribution Channels
- 10.1. Market Analysis, Insights and Forecast - by Product Type
- 11. Asia Pacific US Organic Skin Care Products Industry Analysis, Insights and Forecast, 2021-2033
- 11.1. Market Analysis, Insights and Forecast - by Product Type
- 11.1.1. Facial Care
- 11.1.1.1. Cleansers (including Exfoliators/Facial Scrubs)
- 11.1.1.2. Moisturizers and Oils/Serums
- 11.1.1.3. Face Masks and Packs
- 11.1.1.4. Other Facial Care Products
- 11.1.2. Body Care
- 11.1.2.1. Body Lotions
- 11.1.2.2. Body Wash
- 11.1.2.3. Other Body Care Products
- 11.1.1. Facial Care
- 11.2. Market Analysis, Insights and Forecast - by Distribution Channel
- 11.2.1. Supermarkets/Hypermarkets
- 11.2.2. Specialty Retail Stores
- 11.2.3. Online Retail Stores
- 11.2.4. Other Distribution Channels
- 11.1. Market Analysis, Insights and Forecast - by Product Type
- 12. Competitive Analysis
- 12.1. Company Profiles
- 12.1.1 Sierra Sage Herbs (Green Goo)
- 12.1.1.1. Company Overview
- 12.1.1.2. Products
- 12.1.1.3. Company Financials
- 12.1.1.4. SWOT Analysis
- 12.1.2 Eminence Organic Skin Care
- 12.1.2.1. Company Overview
- 12.1.2.2. Products
- 12.1.2.3. Company Financials
- 12.1.2.4. SWOT Analysis
- 12.1.3 Pilli Ani
- 12.1.3.1. Company Overview
- 12.1.3.2. Products
- 12.1.3.3. Company Financials
- 12.1.3.4. SWOT Analysis
- 12.1.4 Derma E
- 12.1.4.1. Company Overview
- 12.1.4.2. Products
- 12.1.4.3. Company Financials
- 12.1.4.4. SWOT Analysis
- 12.1.5 Phyt's USA
- 12.1.5.1. Company Overview
- 12.1.5.2. Products
- 12.1.5.3. Company Financials
- 12.1.5.4. SWOT Analysis
- 12.1.6 Starflower Essentials Organic Skin Care
- 12.1.6.1. Company Overview
- 12.1.6.2. Products
- 12.1.6.3. Company Financials
- 12.1.6.4. SWOT Analysis
- 12.1.7 L'Oreal SA
- 12.1.7.1. Company Overview
- 12.1.7.2. Products
- 12.1.7.3. Company Financials
- 12.1.7.4. SWOT Analysis
- 12.1.8 Botanic Organic LLC
- 12.1.8.1. Company Overview
- 12.1.8.2. Products
- 12.1.8.3. Company Financials
- 12.1.8.4. SWOT Analysis
- 12.1.9 Johnson & Johnson (Neutrogena)
- 12.1.9.1. Company Overview
- 12.1.9.2. Products
- 12.1.9.3. Company Financials
- 12.1.9.4. SWOT Analysis
- 12.1.10 Renee Cosmetics*List Not Exhaustive
- 12.1.10.1. Company Overview
- 12.1.10.2. Products
- 12.1.10.3. Company Financials
- 12.1.10.4. SWOT Analysis
- 12.1.11 Thesis Beauty
- 12.1.11.1. Company Overview
- 12.1.11.2. Products
- 12.1.11.3. Company Financials
- 12.1.11.4. SWOT Analysis
- 12.1.12 The Hain Celestial Group (Avalon Natural Products Inc)
- 12.1.12.1. Company Overview
- 12.1.12.2. Products
- 12.1.12.3. Company Financials
- 12.1.12.4. SWOT Analysis
- 12.1.1 Sierra Sage Herbs (Green Goo)
- 12.2. Market Entropy
- 12.2.1 Company's Key Areas Served
- 12.2.2 Recent Developments
- 12.3. Company Market Share Analysis 2025
- 12.3.1 Top 5 Companies Market Share Analysis
- 12.3.2 Top 3 Companies Market Share Analysis
- 12.4. List of Potential Customers
- 13. Research Methodology
List of Figures
- Figure 1: Global US Organic Skin Care Products Industry Revenue Breakdown (billion, %) by Region 2025 & 2033
- Figure 2: Global US Organic Skin Care Products Industry Volume Breakdown (K Units, %) by Region 2025 & 2033
- Figure 3: North America US Organic Skin Care Products Industry Revenue (billion), by Product Type 2025 & 2033
- Figure 4: North America US Organic Skin Care Products Industry Volume (K Units), by Product Type 2025 & 2033
- Figure 5: North America US Organic Skin Care Products Industry Revenue Share (%), by Product Type 2025 & 2033
- Figure 6: North America US Organic Skin Care Products Industry Volume Share (%), by Product Type 2025 & 2033
- Figure 7: North America US Organic Skin Care Products Industry Revenue (billion), by Distribution Channel 2025 & 2033
- Figure 8: North America US Organic Skin Care Products Industry Volume (K Units), by Distribution Channel 2025 & 2033
- Figure 9: North America US Organic Skin Care Products Industry Revenue Share (%), by Distribution Channel 2025 & 2033
- Figure 10: North America US Organic Skin Care Products Industry Volume Share (%), by Distribution Channel 2025 & 2033
- Figure 11: North America US Organic Skin Care Products Industry Revenue (billion), by Country 2025 & 2033
- Figure 12: North America US Organic Skin Care Products Industry Volume (K Units), by Country 2025 & 2033
- Figure 13: North America US Organic Skin Care Products Industry Revenue Share (%), by Country 2025 & 2033
- Figure 14: North America US Organic Skin Care Products Industry Volume Share (%), by Country 2025 & 2033
- Figure 15: South America US Organic Skin Care Products Industry Revenue (billion), by Product Type 2025 & 2033
- Figure 16: South America US Organic Skin Care Products Industry Volume (K Units), by Product Type 2025 & 2033
- Figure 17: South America US Organic Skin Care Products Industry Revenue Share (%), by Product Type 2025 & 2033
- Figure 18: South America US Organic Skin Care Products Industry Volume Share (%), by Product Type 2025 & 2033
- Figure 19: South America US Organic Skin Care Products Industry Revenue (billion), by Distribution Channel 2025 & 2033
- Figure 20: South America US Organic Skin Care Products Industry Volume (K Units), by Distribution Channel 2025 & 2033
- Figure 21: South America US Organic Skin Care Products Industry Revenue Share (%), by Distribution Channel 2025 & 2033
- Figure 22: South America US Organic Skin Care Products Industry Volume Share (%), by Distribution Channel 2025 & 2033
- Figure 23: South America US Organic Skin Care Products Industry Revenue (billion), by Country 2025 & 2033
- Figure 24: South America US Organic Skin Care Products Industry Volume (K Units), by Country 2025 & 2033
- Figure 25: South America US Organic Skin Care Products Industry Revenue Share (%), by Country 2025 & 2033
- Figure 26: South America US Organic Skin Care Products Industry Volume Share (%), by Country 2025 & 2033
- Figure 27: Europe US Organic Skin Care Products Industry Revenue (billion), by Product Type 2025 & 2033
- Figure 28: Europe US Organic Skin Care Products Industry Volume (K Units), by Product Type 2025 & 2033
- Figure 29: Europe US Organic Skin Care Products Industry Revenue Share (%), by Product Type 2025 & 2033
- Figure 30: Europe US Organic Skin Care Products Industry Volume Share (%), by Product Type 2025 & 2033
- Figure 31: Europe US Organic Skin Care Products Industry Revenue (billion), by Distribution Channel 2025 & 2033
- Figure 32: Europe US Organic Skin Care Products Industry Volume (K Units), by Distribution Channel 2025 & 2033
- Figure 33: Europe US Organic Skin Care Products Industry Revenue Share (%), by Distribution Channel 2025 & 2033
- Figure 34: Europe US Organic Skin Care Products Industry Volume Share (%), by Distribution Channel 2025 & 2033
- Figure 35: Europe US Organic Skin Care Products Industry Revenue (billion), by Country 2025 & 2033
- Figure 36: Europe US Organic Skin Care Products Industry Volume (K Units), by Country 2025 & 2033
- Figure 37: Europe US Organic Skin Care Products Industry Revenue Share (%), by Country 2025 & 2033
- Figure 38: Europe US Organic Skin Care Products Industry Volume Share (%), by Country 2025 & 2033
- Figure 39: Middle East & Africa US Organic Skin Care Products Industry Revenue (billion), by Product Type 2025 & 2033
- Figure 40: Middle East & Africa US Organic Skin Care Products Industry Volume (K Units), by Product Type 2025 & 2033
- Figure 41: Middle East & Africa US Organic Skin Care Products Industry Revenue Share (%), by Product Type 2025 & 2033
- Figure 42: Middle East & Africa US Organic Skin Care Products Industry Volume Share (%), by Product Type 2025 & 2033
- Figure 43: Middle East & Africa US Organic Skin Care Products Industry Revenue (billion), by Distribution Channel 2025 & 2033
- Figure 44: Middle East & Africa US Organic Skin Care Products Industry Volume (K Units), by Distribution Channel 2025 & 2033
- Figure 45: Middle East & Africa US Organic Skin Care Products Industry Revenue Share (%), by Distribution Channel 2025 & 2033
- Figure 46: Middle East & Africa US Organic Skin Care Products Industry Volume Share (%), by Distribution Channel 2025 & 2033
- Figure 47: Middle East & Africa US Organic Skin Care Products Industry Revenue (billion), by Country 2025 & 2033
- Figure 48: Middle East & Africa US Organic Skin Care Products Industry Volume (K Units), by Country 2025 & 2033
- Figure 49: Middle East & Africa US Organic Skin Care Products Industry Revenue Share (%), by Country 2025 & 2033
- Figure 50: Middle East & Africa US Organic Skin Care Products Industry Volume Share (%), by Country 2025 & 2033
- Figure 51: Asia Pacific US Organic Skin Care Products Industry Revenue (billion), by Product Type 2025 & 2033
- Figure 52: Asia Pacific US Organic Skin Care Products Industry Volume (K Units), by Product Type 2025 & 2033
- Figure 53: Asia Pacific US Organic Skin Care Products Industry Revenue Share (%), by Product Type 2025 & 2033
- Figure 54: Asia Pacific US Organic Skin Care Products Industry Volume Share (%), by Product Type 2025 & 2033
- Figure 55: Asia Pacific US Organic Skin Care Products Industry Revenue (billion), by Distribution Channel 2025 & 2033
- Figure 56: Asia Pacific US Organic Skin Care Products Industry Volume (K Units), by Distribution Channel 2025 & 2033
- Figure 57: Asia Pacific US Organic Skin Care Products Industry Revenue Share (%), by Distribution Channel 2025 & 2033
- Figure 58: Asia Pacific US Organic Skin Care Products Industry Volume Share (%), by Distribution Channel 2025 & 2033
- Figure 59: Asia Pacific US Organic Skin Care Products Industry Revenue (billion), by Country 2025 & 2033
- Figure 60: Asia Pacific US Organic Skin Care Products Industry Volume (K Units), by Country 2025 & 2033
- Figure 61: Asia Pacific US Organic Skin Care Products Industry Revenue Share (%), by Country 2025 & 2033
- Figure 62: Asia Pacific US Organic Skin Care Products Industry Volume Share (%), by Country 2025 & 2033
List of Tables
- Table 1: Global US Organic Skin Care Products Industry Revenue billion Forecast, by Product Type 2020 & 2033
- Table 2: Global US Organic Skin Care Products Industry Volume K Units Forecast, by Product Type 2020 & 2033
- Table 3: Global US Organic Skin Care Products Industry Revenue billion Forecast, by Distribution Channel 2020 & 2033
- Table 4: Global US Organic Skin Care Products Industry Volume K Units Forecast, by Distribution Channel 2020 & 2033
- Table 5: Global US Organic Skin Care Products Industry Revenue billion Forecast, by Region 2020 & 2033
- Table 6: Global US Organic Skin Care Products Industry Volume K Units Forecast, by Region 2020 & 2033
- Table 7: Global US Organic Skin Care Products Industry Revenue billion Forecast, by Product Type 2020 & 2033
- Table 8: Global US Organic Skin Care Products Industry Volume K Units Forecast, by Product Type 2020 & 2033
- Table 9: Global US Organic Skin Care Products Industry Revenue billion Forecast, by Distribution Channel 2020 & 2033
- Table 10: Global US Organic Skin Care Products Industry Volume K Units Forecast, by Distribution Channel 2020 & 2033
- Table 11: Global US Organic Skin Care Products Industry Revenue billion Forecast, by Country 2020 & 2033
- Table 12: Global US Organic Skin Care Products Industry Volume K Units Forecast, by Country 2020 & 2033
- Table 13: United States US Organic Skin Care Products Industry Revenue (billion) Forecast, by Application 2020 & 2033
- Table 14: United States US Organic Skin Care Products Industry Volume (K Units) Forecast, by Application 2020 & 2033
- Table 15: Canada US Organic Skin Care Products Industry Revenue (billion) Forecast, by Application 2020 & 2033
- Table 16: Canada US Organic Skin Care Products Industry Volume (K Units) Forecast, by Application 2020 & 2033
- Table 17: Mexico US Organic Skin Care Products Industry Revenue (billion) Forecast, by Application 2020 & 2033
- Table 18: Mexico US Organic Skin Care Products Industry Volume (K Units) Forecast, by Application 2020 & 2033
- Table 19: Global US Organic Skin Care Products Industry Revenue billion Forecast, by Product Type 2020 & 2033
- Table 20: Global US Organic Skin Care Products Industry Volume K Units Forecast, by Product Type 2020 & 2033
- Table 21: Global US Organic Skin Care Products Industry Revenue billion Forecast, by Distribution Channel 2020 & 2033
- Table 22: Global US Organic Skin Care Products Industry Volume K Units Forecast, by Distribution Channel 2020 & 2033
- Table 23: Global US Organic Skin Care Products Industry Revenue billion Forecast, by Country 2020 & 2033
- Table 24: Global US Organic Skin Care Products Industry Volume K Units Forecast, by Country 2020 & 2033
- Table 25: Brazil US Organic Skin Care Products Industry Revenue (billion) Forecast, by Application 2020 & 2033
- Table 26: Brazil US Organic Skin Care Products Industry Volume (K Units) Forecast, by Application 2020 & 2033
- Table 27: Argentina US Organic Skin Care Products Industry Revenue (billion) Forecast, by Application 2020 & 2033
- Table 28: Argentina US Organic Skin Care Products Industry Volume (K Units) Forecast, by Application 2020 & 2033
- Table 29: Rest of South America US Organic Skin Care Products Industry Revenue (billion) Forecast, by Application 2020 & 2033
- Table 30: Rest of South America US Organic Skin Care Products Industry Volume (K Units) Forecast, by Application 2020 & 2033
- Table 31: Global US Organic Skin Care Products Industry Revenue billion Forecast, by Product Type 2020 & 2033
- Table 32: Global US Organic Skin Care Products Industry Volume K Units Forecast, by Product Type 2020 & 2033
- Table 33: Global US Organic Skin Care Products Industry Revenue billion Forecast, by Distribution Channel 2020 & 2033
- Table 34: Global US Organic Skin Care Products Industry Volume K Units Forecast, by Distribution Channel 2020 & 2033
- Table 35: Global US Organic Skin Care Products Industry Revenue billion Forecast, by Country 2020 & 2033
- Table 36: Global US Organic Skin Care Products Industry Volume K Units Forecast, by Country 2020 & 2033
- Table 37: United Kingdom US Organic Skin Care Products Industry Revenue (billion) Forecast, by Application 2020 & 2033
- Table 38: United Kingdom US Organic Skin Care Products Industry Volume (K Units) Forecast, by Application 2020 & 2033
- Table 39: Germany US Organic Skin Care Products Industry Revenue (billion) Forecast, by Application 2020 & 2033
- Table 40: Germany US Organic Skin Care Products Industry Volume (K Units) Forecast, by Application 2020 & 2033
- Table 41: France US Organic Skin Care Products Industry Revenue (billion) Forecast, by Application 2020 & 2033
- Table 42: France US Organic Skin Care Products Industry Volume (K Units) Forecast, by Application 2020 & 2033
- Table 43: Italy US Organic Skin Care Products Industry Revenue (billion) Forecast, by Application 2020 & 2033
- Table 44: Italy US Organic Skin Care Products Industry Volume (K Units) Forecast, by Application 2020 & 2033
- Table 45: Spain US Organic Skin Care Products Industry Revenue (billion) Forecast, by Application 2020 & 2033
- Table 46: Spain US Organic Skin Care Products Industry Volume (K Units) Forecast, by Application 2020 & 2033
- Table 47: Russia US Organic Skin Care Products Industry Revenue (billion) Forecast, by Application 2020 & 2033
- Table 48: Russia US Organic Skin Care Products Industry Volume (K Units) Forecast, by Application 2020 & 2033
- Table 49: Benelux US Organic Skin Care Products Industry Revenue (billion) Forecast, by Application 2020 & 2033
- Table 50: Benelux US Organic Skin Care Products Industry Volume (K Units) Forecast, by Application 2020 & 2033
- Table 51: Nordics US Organic Skin Care Products Industry Revenue (billion) Forecast, by Application 2020 & 2033
- Table 52: Nordics US Organic Skin Care Products Industry Volume (K Units) Forecast, by Application 2020 & 2033
- Table 53: Rest of Europe US Organic Skin Care Products Industry Revenue (billion) Forecast, by Application 2020 & 2033
- Table 54: Rest of Europe US Organic Skin Care Products Industry Volume (K Units) Forecast, by Application 2020 & 2033
- Table 55: Global US Organic Skin Care Products Industry Revenue billion Forecast, by Product Type 2020 & 2033
- Table 56: Global US Organic Skin Care Products Industry Volume K Units Forecast, by Product Type 2020 & 2033
- Table 57: Global US Organic Skin Care Products Industry Revenue billion Forecast, by Distribution Channel 2020 & 2033
- Table 58: Global US Organic Skin Care Products Industry Volume K Units Forecast, by Distribution Channel 2020 & 2033
- Table 59: Global US Organic Skin Care Products Industry Revenue billion Forecast, by Country 2020 & 2033
- Table 60: Global US Organic Skin Care Products Industry Volume K Units Forecast, by Country 2020 & 2033
- Table 61: Turkey US Organic Skin Care Products Industry Revenue (billion) Forecast, by Application 2020 & 2033
- Table 62: Turkey US Organic Skin Care Products Industry Volume (K Units) Forecast, by Application 2020 & 2033
- Table 63: Israel US Organic Skin Care Products Industry Revenue (billion) Forecast, by Application 2020 & 2033
- Table 64: Israel US Organic Skin Care Products Industry Volume (K Units) Forecast, by Application 2020 & 2033
- Table 65: GCC US Organic Skin Care Products Industry Revenue (billion) Forecast, by Application 2020 & 2033
- Table 66: GCC US Organic Skin Care Products Industry Volume (K Units) Forecast, by Application 2020 & 2033
- Table 67: North Africa US Organic Skin Care Products Industry Revenue (billion) Forecast, by Application 2020 & 2033
- Table 68: North Africa US Organic Skin Care Products Industry Volume (K Units) Forecast, by Application 2020 & 2033
- Table 69: South Africa US Organic Skin Care Products Industry Revenue (billion) Forecast, by Application 2020 & 2033
- Table 70: South Africa US Organic Skin Care Products Industry Volume (K Units) Forecast, by Application 2020 & 2033
- Table 71: Rest of Middle East & Africa US Organic Skin Care Products Industry Revenue (billion) Forecast, by Application 2020 & 2033
- Table 72: Rest of Middle East & Africa US Organic Skin Care Products Industry Volume (K Units) Forecast, by Application 2020 & 2033
- Table 73: Global US Organic Skin Care Products Industry Revenue billion Forecast, by Product Type 2020 & 2033
- Table 74: Global US Organic Skin Care Products Industry Volume K Units Forecast, by Product Type 2020 & 2033
- Table 75: Global US Organic Skin Care Products Industry Revenue billion Forecast, by Distribution Channel 2020 & 2033
- Table 76: Global US Organic Skin Care Products Industry Volume K Units Forecast, by Distribution Channel 2020 & 2033
- Table 77: Global US Organic Skin Care Products Industry Revenue billion Forecast, by Country 2020 & 2033
- Table 78: Global US Organic Skin Care Products Industry Volume K Units Forecast, by Country 2020 & 2033
- Table 79: China US Organic Skin Care Products Industry Revenue (billion) Forecast, by Application 2020 & 2033
- Table 80: China US Organic Skin Care Products Industry Volume (K Units) Forecast, by Application 2020 & 2033
- Table 81: India US Organic Skin Care Products Industry Revenue (billion) Forecast, by Application 2020 & 2033
- Table 82: India US Organic Skin Care Products Industry Volume (K Units) Forecast, by Application 2020 & 2033
- Table 83: Japan US Organic Skin Care Products Industry Revenue (billion) Forecast, by Application 2020 & 2033
- Table 84: Japan US Organic Skin Care Products Industry Volume (K Units) Forecast, by Application 2020 & 2033
- Table 85: South Korea US Organic Skin Care Products Industry Revenue (billion) Forecast, by Application 2020 & 2033
- Table 86: South Korea US Organic Skin Care Products Industry Volume (K Units) Forecast, by Application 2020 & 2033
- Table 87: ASEAN US Organic Skin Care Products Industry Revenue (billion) Forecast, by Application 2020 & 2033
- Table 88: ASEAN US Organic Skin Care Products Industry Volume (K Units) Forecast, by Application 2020 & 2033
- Table 89: Oceania US Organic Skin Care Products Industry Revenue (billion) Forecast, by Application 2020 & 2033
- Table 90: Oceania US Organic Skin Care Products Industry Volume (K Units) Forecast, by Application 2020 & 2033
- Table 91: Rest of Asia Pacific US Organic Skin Care Products Industry Revenue (billion) Forecast, by Application 2020 & 2033
- Table 92: Rest of Asia Pacific US Organic Skin Care Products Industry Volume (K Units) Forecast, by Application 2020 & 2033
Frequently Asked Questions
1. What is the projected Compound Annual Growth Rate (CAGR) of the US Organic Skin Care Products Industry?
The projected CAGR is approximately 8.9%.
2. Which companies are prominent players in the US Organic Skin Care Products Industry?
Key companies in the market include Sierra Sage Herbs (Green Goo), Eminence Organic Skin Care, Pilli Ani, Derma E, Phyt's USA, Starflower Essentials Organic Skin Care, L'Oreal SA, Botanic Organic LLC, Johnson & Johnson (Neutrogena), Renee Cosmetics*List Not Exhaustive, Thesis Beauty, The Hain Celestial Group (Avalon Natural Products Inc).
3. What are the main segments of the US Organic Skin Care Products Industry?
The market segments include Product Type, Distribution Channel.
4. Can you provide details about the market size?
The market size is estimated to be USD 9.83 billion as of 2022.
5. What are some drivers contributing to market growth?
Increasing Aging Population drives the Market Growth; Technological Advancement and Product Innovation.
6. What are the notable trends driving market growth?
Clean Beauty - A Skin Care Revolution.
7. Are there any restraints impacting market growth?
Product Misrepresentation and Counterfeit Concerns.
8. Can you provide examples of recent developments in the market?
November 2022: Eminence Organic Skin Care launched cleansers for every skin type. charcoal exfoliating gel cleanser and stone crop cleansing oil were introduced for oily skin. Eminence also introduced products for sensitive and dry skin.
9. What pricing options are available for accessing the report?
Pricing options include single-user, multi-user, and enterprise licenses priced at USD 3800, USD 4500, and USD 5800 respectively.
10. Is the market size provided in terms of value or volume?
The market size is provided in terms of value, measured in billion and volume, measured in K Units.
11. Are there any specific market keywords associated with the report?
Yes, the market keyword associated with the report is "US Organic Skin Care Products Industry," which aids in identifying and referencing the specific market segment covered.
12. How do I determine which pricing option suits my needs best?
The pricing options vary based on user requirements and access needs. Individual users may opt for single-user licenses, while businesses requiring broader access may choose multi-user or enterprise licenses for cost-effective access to the report.
13. Are there any additional resources or data provided in the US Organic Skin Care Products Industry report?
While the report offers comprehensive insights, it's advisable to review the specific contents or supplementary materials provided to ascertain if additional resources or data are available.
14. How can I stay updated on further developments or reports in the US Organic Skin Care Products Industry?
To stay informed about further developments, trends, and reports in the US Organic Skin Care Products Industry, consider subscribing to industry newsletters, following relevant companies and organizations, or regularly checking reputable industry news sources and publications.
Methodology
Step 1 - Identification of Relevant Samples Size from Population Database


Step 2 - Approaches for Defining Global Market Size (Value, Volume* & Price*)

Note*: In applicable scenarios
Step 3 - Data Sources
Primary Research
- Web Analytics
- Survey Reports
- Research Institute
- Latest Research Reports
- Opinion Leaders
Secondary Research
- Annual Reports
- White Paper
- Latest Press Release
- Industry Association
- Paid Database
- Investor Presentations

Step 4 - Data Triangulation
Involves using different sources of information in order to increase the validity of a study
These sources are likely to be stakeholders in a program - participants, other researchers, program staff, other community members, and so on.
Then we put all data in single framework & apply various statistical tools to find out the dynamic on the market.
During the analysis stage, feedback from the stakeholder groups would be compared to determine areas of agreement as well as areas of divergence