

Key Insights
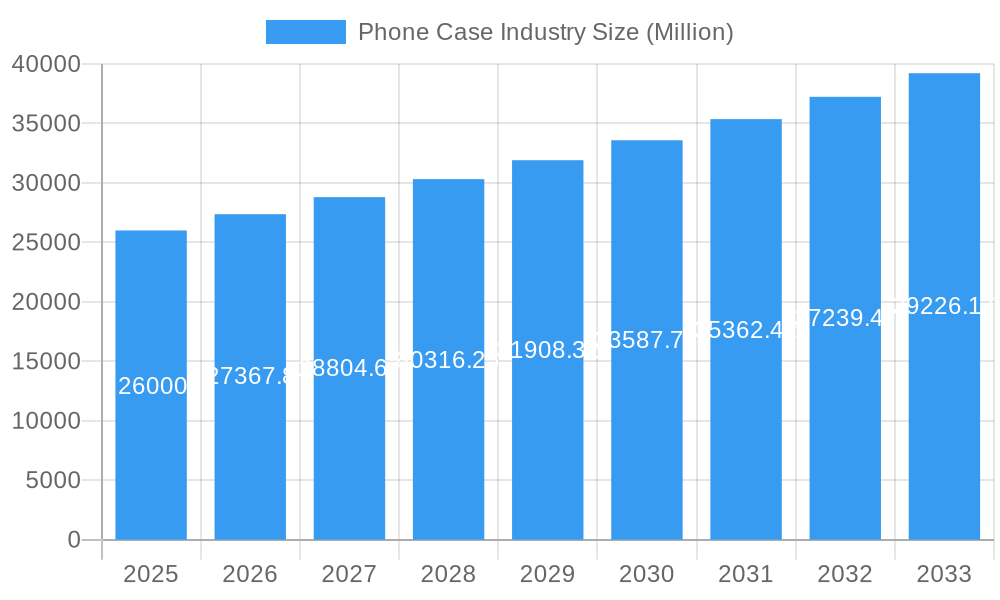
The global phone case market, valued at $26 billion in 2025, is projected to experience robust growth, driven by several key factors. The increasing smartphone penetration globally, coupled with consumer preference for personalized accessories and device protection, fuels significant demand. Premiumization trends, with consumers opting for higher-quality materials and enhanced features like wireless charging compatibility, are further boosting market value. The market is segmented by product type (Black Plate Cases, Folio Cases, Other Case Types), category (Mass, Premium), and distribution channel (Online Retail, Offline Retail). Online retail channels are experiencing rapid growth, reflecting the increasing preference for convenient and efficient e-commerce platforms. Key players like OtterBox, Spigen, and Urban Armor Gear dominate the market, constantly innovating to meet evolving consumer needs and preferences. Geographic expansion, particularly in rapidly developing economies in Asia-Pacific and South America, presents significant growth opportunities. While potential restraints like economic downturns could impact consumer spending on non-essential items like phone cases, the overall market outlook remains positive, driven by the enduring demand for smartphone protection and personalization. The consistent 5.33% CAGR suggests a steady and reliable growth trajectory over the forecast period.
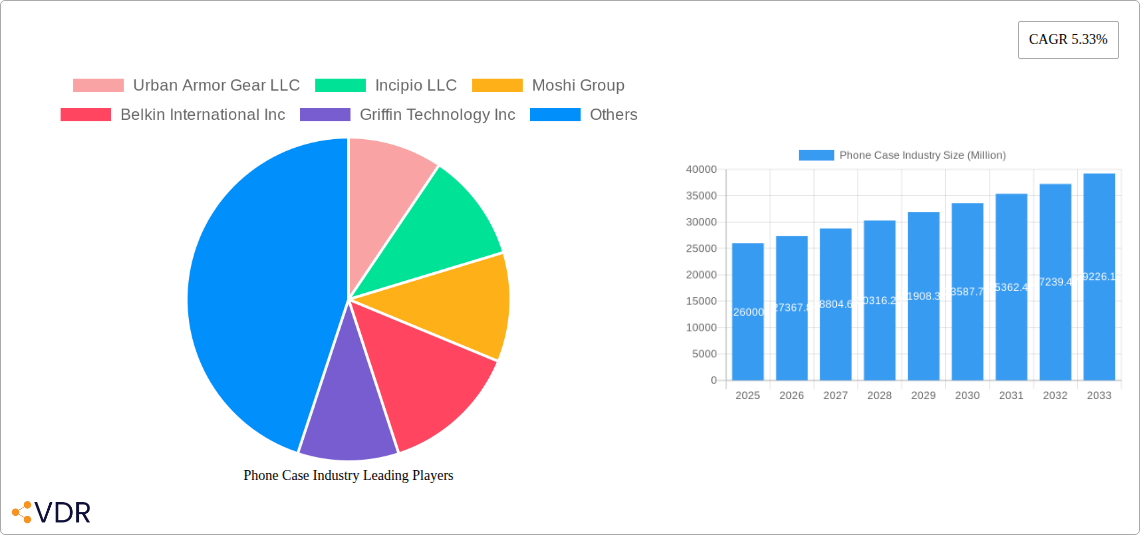
Phone Case Industry Market Size (In Billion)
The competitive landscape is characterized by a blend of established brands and emerging players. Established players leverage brand recognition and extensive distribution networks, while new entrants focus on niche market segments or innovative product designs. Competition is fierce, necessitating continuous innovation in design, material, and functionality to attract and retain customers. The market is expected to see further consolidation as larger players acquire smaller companies to expand their product portfolio and market reach. Strategic partnerships and collaborations are also anticipated to drive growth, enabling companies to access new technologies and distribution channels. Focus on sustainability and environmentally friendly materials is a growing trend that is expected to influence both product design and consumer purchasing decisions.
Phone Case Industry Company Market Share
Phone Case Industry Market Report: 2019-2033
This comprehensive report provides a detailed analysis of the phone case industry, encompassing market dynamics, growth trends, key players, and future outlook. With a focus on both parent and child markets, this report is essential for industry professionals, investors, and anyone seeking to understand this dynamic sector. The study period covers 2019-2033, with a base year of 2025 and a forecast period of 2025-2033. The report analyzes the market in million units.
Phone Case Industry Market Dynamics & Structure
The phone case industry is characterized by a moderately concentrated market structure with several major players commanding significant market share. Technological innovation, driven by advancements in materials science and design aesthetics, plays a crucial role in shaping product differentiation and consumer preferences. Regulatory frameworks concerning material safety and environmental impact also influence market dynamics. Competitive product substitutes, such as screen protectors and phone wraps, pose challenges. End-user demographics, primarily driven by smartphone ownership and consumer electronics adoption rates, significantly impact market demand. Mergers and acquisitions (M&A) activity remains a noteworthy factor influencing market consolidation and expansion.
- Market Concentration: The top 10 players account for approximately xx% of the global market (2024 estimate).
- Technological Innovation: Focus on materials (e.g., bio-degradable plastics, advanced shock absorption polymers), design (e.g., MagSafe compatibility, integrated wallets) and functionality (e.g., antimicrobial properties).
- Regulatory Frameworks: Compliance with RoHS, REACH, and other regulations related to material safety and environmental impact.
- Competitive Substitutes: Screen protectors and other protective films compete with traditional phone cases.
- End-User Demographics: Growing smartphone adoption in emerging markets fuels demand, with significant variation among age groups and income levels.
- M&A Trends: An estimated xx M&A deals were completed in the phone case industry between 2019 and 2024.
Phone Case Industry Growth Trends & Insights
The phone case market experienced substantial growth during the historical period (2019-2024), with a CAGR of xx%. This growth is attributed to increasing smartphone penetration globally, a trend projected to continue throughout the forecast period (2025-2033). Market penetration in mature markets is nearing saturation, while considerable growth potential exists in developing economies. Technological disruptions, including the introduction of new smartphone models and features like 5G, have fueled innovation in case design and functionality. Consumer behavior shifts towards premiumization and personalized products are also driving market expansion. The global market size is estimated at xx million units in 2025, projected to reach xx million units by 2033.
Dominant Regions, Countries, or Segments in Phone Case Industry
North America and Asia-Pacific currently represent the dominant regions, with North America exhibiting a higher per capita consumption rate and Asia-Pacific showcasing substantial volume growth driven by large populations and expanding smartphone usage. Within product types, Black Plate Cases continue to hold a significant share, followed by Folio Cases and other case types. The Premium category experiences faster growth compared to the Mass category, reflecting consumer preference for higher-quality and feature-rich products. Online retail dominates the distribution channel, leveraging e-commerce platforms for wider reach and convenience.
- Key Drivers:
- North America: High smartphone penetration, disposable income, and preference for premium products.
- Asia-Pacific: Rapid smartphone adoption, burgeoning middle class, and increasing online retail penetration.
- Premium Segment: Desire for premium materials, enhanced protection, and stylish designs.
- Online Retail: Ease of access, competitive pricing, and wider product selection.
Phone Case Industry Product Landscape
The phone case industry offers a diverse product landscape encompassing a wide range of materials, designs, and functionalities. Innovations include the use of sustainable materials, enhanced shock absorption technology, and integrated features such as wireless charging capabilities and wallet integration. Key performance metrics include drop protection levels, scratch resistance, and overall durability. Unique selling propositions often focus on design aesthetics, brand collaborations, and specific functionalities tailored to user needs. Technological advancements continually push boundaries, leading to slimmer designs, better protection, and improved user experience.
Key Drivers, Barriers & Challenges in Phone Case Industry
Key Drivers:
- The expanding global smartphone market is a major driver.
- Technological advancements lead to new case designs and features.
- Consumer preference for personalization and premiumization fuels demand.
Key Challenges & Restraints:
- Intense competition from numerous players, leading to price pressure.
- Supply chain disruptions, particularly in sourcing raw materials.
- The potential impact of increased material costs and fluctuating exchange rates.
Emerging Opportunities in Phone Case Industry
- Expansion into developing markets with growing smartphone usage presents substantial growth opportunities.
- The development of eco-friendly and sustainable phone cases caters to rising environmental consciousness.
- Innovative features, such as integrated health trackers or augmented reality capabilities, can differentiate products.
Growth Accelerators in the Phone Case Industry
Technological breakthroughs in materials science, allowing for lighter, more durable, and aesthetically appealing phone cases, will act as significant growth catalysts. Strategic partnerships between case manufacturers and smartphone brands can foster product integration and expand market reach. Aggressive expansion into untapped markets, particularly in emerging economies, will significantly influence overall industry growth.
Key Players Shaping the Phone Case Industry Market
- Urban Armor Gear LLC
- Incipio LLC
- Moshi Group
- Belkin International Inc
- Griffin Technology Inc
- Ringke Inc
- Poetic Cases LLC
- Spigen Inc
- OtterBox Holdings Inc
- Reiko Wireless Inc
Notable Milestones in Phone Case Industry Sector
- January 2021: Incipio Inc. launched protective cases for the Samsung Galaxy S21 lineup, strengthening its position in the premium segment.
- September 2021: CLCKR expanded its product line with iPhone 13 cases, highlighting the importance of timely product launches to capitalize on new smartphone releases.
- February 2022: Atom Studios launched its Touch case for Samsung phones, showcasing innovation in materials and design.
In-Depth Phone Case Industry Market Outlook
The phone case market is poised for continued growth, driven by several factors. Technological innovation will continue to play a crucial role, with new materials and designs emerging to meet consumer demands. Expanding into new markets and focusing on sustainable materials offer significant growth potential. Strategic partnerships and collaborations will shape the industry landscape, fostering innovation and expanding market reach. The long-term outlook remains positive, with substantial opportunities for both established players and new entrants.
Phone Case Industry Segmentation
-
1. Product Type
- 1.1. Black Plate Cases
- 1.2. Folio Cases
- 1.3. Other Case Types
-
2. Category
- 2.1. Mass
- 2.2. Premium
-
3. Distribution Channel
- 3.1. Online Retail
- 3.2. Offline Retail
Phone Case Industry Segmentation By Geography
-
1. North America
- 1.1. United States
- 1.2. Canada
- 1.3. Mexico
- 1.4. Rest of North America
-
2. Europe
- 2.1. Germany
- 2.2. United Kingdom
- 2.3. France
- 2.4. Russia
- 2.5. Spain
- 2.6. Italy
- 2.7. Rest of Europe
-
3. Asia Pacific
- 3.1. India
- 3.2. China
- 3.3. Japan
- 3.4. Australia
- 3.5. Rest of Asia Pacific
-
4. South America
- 4.1. Brazil
- 4.2. Argentina
- 4.3. Rest of South America
-
5. Middle East and Africa
- 5.1. United Arab Emirates
- 5.2. South Africa
- 5.3. Rest of Middle East and Africa
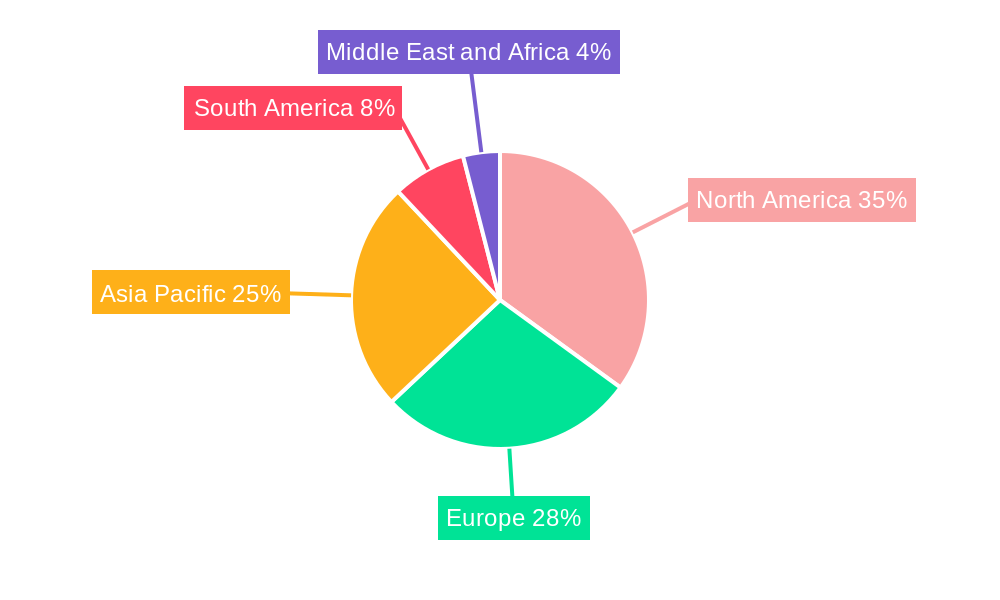
Phone Case Industry Regional Market Share
Geographic Coverage of Phone Case Industry
Phone Case Industry REPORT HIGHLIGHTS
| Aspects | Details |
|---|---|
| Study Period | 2020-2034 |
| Base Year | 2025 |
| Estimated Year | 2026 |
| Forecast Period | 2026-2034 |
| Historical Period | 2020-2025 |
| Growth Rate | CAGR of 5.33% from 2020-2034 |
| Segmentation |
|
Table of Contents
- 1. Introduction
- 1.1. Research Scope
- 1.2. Market Segmentation
- 1.3. Research Objective
- 1.4. Definitions and Assumptions
- 2. Executive Summary
- 2.1. Market Snapshot
- 3. Market Dynamics
- 3.1. Market Drivers
- 3.2. Market Restrains
- 3.3. Market Trends
- 3.4. Market Opportunities
- 4. Market Factor Analysis
- 4.1. Porters Five Forces
- 4.1.1. Bargaining Power of Suppliers
- 4.1.2. Bargaining Power of Buyers
- 4.1.3. Threat of New Entrants
- 4.1.4. Threat of Substitutes
- 4.1.5. Competitive Rivalry
- 4.2. PESTEL analysis
- 4.3. BCG Analysis
- 4.3.1. Stars (High Growth, High Market Share)
- 4.3.2. Cash Cows (Low Growth, High Market Share)
- 4.3.3. Question Mark (High Growth, Low Market Share)
- 4.3.4. Dogs (Low Growth, Low Market Share)
- 4.4. Ansoff Matrix Analysis
- 4.5. Supply Chain Analysis
- 4.6. Regulatory Landscape
- 4.7. Current Market Potential and Opportunity Assessment (TAM–SAM–SOM Framework)
- 4.8. VDR Analyst Note
- 4.1. Porters Five Forces
- 5. Market Analysis, Insights and Forecast 2021-2033
- 5.1. Market Analysis, Insights and Forecast - by Product Type
- 5.1.1. Black Plate Cases
- 5.1.2. Folio Cases
- 5.1.3. Other Case Types
- 5.2. Market Analysis, Insights and Forecast - by Category
- 5.2.1. Mass
- 5.2.2. Premium
- 5.3. Market Analysis, Insights and Forecast - by Distribution Channel
- 5.3.1. Online Retail
- 5.3.2. Offline Retail
- 5.4. Market Analysis, Insights and Forecast - by Region
- 5.4.1. North America
- 5.4.2. Europe
- 5.4.3. Asia Pacific
- 5.4.4. South America
- 5.4.5. Middle East and Africa
- 5.1. Market Analysis, Insights and Forecast - by Product Type
- 6. Global Phone Case Industry Analysis, Insights and Forecast, 2021-2033
- 6.1. Market Analysis, Insights and Forecast - by Product Type
- 6.1.1. Black Plate Cases
- 6.1.2. Folio Cases
- 6.1.3. Other Case Types
- 6.2. Market Analysis, Insights and Forecast - by Category
- 6.2.1. Mass
- 6.2.2. Premium
- 6.3. Market Analysis, Insights and Forecast - by Distribution Channel
- 6.3.1. Online Retail
- 6.3.2. Offline Retail
- 6.1. Market Analysis, Insights and Forecast - by Product Type
- 7. North America Phone Case Industry Analysis, Insights and Forecast, 2021-2033
- 7.1. Market Analysis, Insights and Forecast - by Product Type
- 7.1.1. Black Plate Cases
- 7.1.2. Folio Cases
- 7.1.3. Other Case Types
- 7.2. Market Analysis, Insights and Forecast - by Category
- 7.2.1. Mass
- 7.2.2. Premium
- 7.3. Market Analysis, Insights and Forecast - by Distribution Channel
- 7.3.1. Online Retail
- 7.3.2. Offline Retail
- 7.1. Market Analysis, Insights and Forecast - by Product Type
- 8. Europe Phone Case Industry Analysis, Insights and Forecast, 2021-2033
- 8.1. Market Analysis, Insights and Forecast - by Product Type
- 8.1.1. Black Plate Cases
- 8.1.2. Folio Cases
- 8.1.3. Other Case Types
- 8.2. Market Analysis, Insights and Forecast - by Category
- 8.2.1. Mass
- 8.2.2. Premium
- 8.3. Market Analysis, Insights and Forecast - by Distribution Channel
- 8.3.1. Online Retail
- 8.3.2. Offline Retail
- 8.1. Market Analysis, Insights and Forecast - by Product Type
- 9. Asia Pacific Phone Case Industry Analysis, Insights and Forecast, 2021-2033
- 9.1. Market Analysis, Insights and Forecast - by Product Type
- 9.1.1. Black Plate Cases
- 9.1.2. Folio Cases
- 9.1.3. Other Case Types
- 9.2. Market Analysis, Insights and Forecast - by Category
- 9.2.1. Mass
- 9.2.2. Premium
- 9.3. Market Analysis, Insights and Forecast - by Distribution Channel
- 9.3.1. Online Retail
- 9.3.2. Offline Retail
- 9.1. Market Analysis, Insights and Forecast - by Product Type
- 10. South America Phone Case Industry Analysis, Insights and Forecast, 2021-2033
- 10.1. Market Analysis, Insights and Forecast - by Product Type
- 10.1.1. Black Plate Cases
- 10.1.2. Folio Cases
- 10.1.3. Other Case Types
- 10.2. Market Analysis, Insights and Forecast - by Category
- 10.2.1. Mass
- 10.2.2. Premium
- 10.3. Market Analysis, Insights and Forecast - by Distribution Channel
- 10.3.1. Online Retail
- 10.3.2. Offline Retail
- 10.1. Market Analysis, Insights and Forecast - by Product Type
- 11. Middle East and Africa Phone Case Industry Analysis, Insights and Forecast, 2021-2033
- 11.1. Market Analysis, Insights and Forecast - by Product Type
- 11.1.1. Black Plate Cases
- 11.1.2. Folio Cases
- 11.1.3. Other Case Types
- 11.2. Market Analysis, Insights and Forecast - by Category
- 11.2.1. Mass
- 11.2.2. Premium
- 11.3. Market Analysis, Insights and Forecast - by Distribution Channel
- 11.3.1. Online Retail
- 11.3.2. Offline Retail
- 11.1. Market Analysis, Insights and Forecast - by Product Type
- 12. Competitive Analysis
- 12.1. Company Profiles
- 12.1.1 Urban Armor Gear LLC
- 12.1.1.1. Company Overview
- 12.1.1.2. Products
- 12.1.1.3. Company Financials
- 12.1.1.4. SWOT Analysis
- 12.1.2 Incipio LLC
- 12.1.2.1. Company Overview
- 12.1.2.2. Products
- 12.1.2.3. Company Financials
- 12.1.2.4. SWOT Analysis
- 12.1.3 Moshi Group
- 12.1.3.1. Company Overview
- 12.1.3.2. Products
- 12.1.3.3. Company Financials
- 12.1.3.4. SWOT Analysis
- 12.1.4 Belkin International Inc
- 12.1.4.1. Company Overview
- 12.1.4.2. Products
- 12.1.4.3. Company Financials
- 12.1.4.4. SWOT Analysis
- 12.1.5 Griffin Technology Inc
- 12.1.5.1. Company Overview
- 12.1.5.2. Products
- 12.1.5.3. Company Financials
- 12.1.5.4. SWOT Analysis
- 12.1.6 Ringke Inc
- 12.1.6.1. Company Overview
- 12.1.6.2. Products
- 12.1.6.3. Company Financials
- 12.1.6.4. SWOT Analysis
- 12.1.7 Poetic Cases LLC*List Not Exhaustive
- 12.1.7.1. Company Overview
- 12.1.7.2. Products
- 12.1.7.3. Company Financials
- 12.1.7.4. SWOT Analysis
- 12.1.8 Spigen Inc
- 12.1.8.1. Company Overview
- 12.1.8.2. Products
- 12.1.8.3. Company Financials
- 12.1.8.4. SWOT Analysis
- 12.1.9 OtterBox Holdings Inc
- 12.1.9.1. Company Overview
- 12.1.9.2. Products
- 12.1.9.3. Company Financials
- 12.1.9.4. SWOT Analysis
- 12.1.10 Reiko Wireless Inc
- 12.1.10.1. Company Overview
- 12.1.10.2. Products
- 12.1.10.3. Company Financials
- 12.1.10.4. SWOT Analysis
- 12.1.1 Urban Armor Gear LLC
- 12.2. Market Entropy
- 12.2.1 Company's Key Areas Served
- 12.2.2 Recent Developments
- 12.3. Company Market Share Analysis 2025
- 12.3.1 Top 5 Companies Market Share Analysis
- 12.3.2 Top 3 Companies Market Share Analysis
- 12.4. List of Potential Customers
- 13. Research Methodology
List of Figures
- Figure 1: Global Phone Case Industry Revenue Breakdown (Million, %) by Region 2025 & 2033
- Figure 2: North America Phone Case Industry Revenue (Million), by Product Type 2025 & 2033
- Figure 3: North America Phone Case Industry Revenue Share (%), by Product Type 2025 & 2033
- Figure 4: North America Phone Case Industry Revenue (Million), by Category 2025 & 2033
- Figure 5: North America Phone Case Industry Revenue Share (%), by Category 2025 & 2033
- Figure 6: North America Phone Case Industry Revenue (Million), by Distribution Channel 2025 & 2033
- Figure 7: North America Phone Case Industry Revenue Share (%), by Distribution Channel 2025 & 2033
- Figure 8: North America Phone Case Industry Revenue (Million), by Country 2025 & 2033
- Figure 9: North America Phone Case Industry Revenue Share (%), by Country 2025 & 2033
- Figure 10: Europe Phone Case Industry Revenue (Million), by Product Type 2025 & 2033
- Figure 11: Europe Phone Case Industry Revenue Share (%), by Product Type 2025 & 2033
- Figure 12: Europe Phone Case Industry Revenue (Million), by Category 2025 & 2033
- Figure 13: Europe Phone Case Industry Revenue Share (%), by Category 2025 & 2033
- Figure 14: Europe Phone Case Industry Revenue (Million), by Distribution Channel 2025 & 2033
- Figure 15: Europe Phone Case Industry Revenue Share (%), by Distribution Channel 2025 & 2033
- Figure 16: Europe Phone Case Industry Revenue (Million), by Country 2025 & 2033
- Figure 17: Europe Phone Case Industry Revenue Share (%), by Country 2025 & 2033
- Figure 18: Asia Pacific Phone Case Industry Revenue (Million), by Product Type 2025 & 2033
- Figure 19: Asia Pacific Phone Case Industry Revenue Share (%), by Product Type 2025 & 2033
- Figure 20: Asia Pacific Phone Case Industry Revenue (Million), by Category 2025 & 2033
- Figure 21: Asia Pacific Phone Case Industry Revenue Share (%), by Category 2025 & 2033
- Figure 22: Asia Pacific Phone Case Industry Revenue (Million), by Distribution Channel 2025 & 2033
- Figure 23: Asia Pacific Phone Case Industry Revenue Share (%), by Distribution Channel 2025 & 2033
- Figure 24: Asia Pacific Phone Case Industry Revenue (Million), by Country 2025 & 2033
- Figure 25: Asia Pacific Phone Case Industry Revenue Share (%), by Country 2025 & 2033
- Figure 26: South America Phone Case Industry Revenue (Million), by Product Type 2025 & 2033
- Figure 27: South America Phone Case Industry Revenue Share (%), by Product Type 2025 & 2033
- Figure 28: South America Phone Case Industry Revenue (Million), by Category 2025 & 2033
- Figure 29: South America Phone Case Industry Revenue Share (%), by Category 2025 & 2033
- Figure 30: South America Phone Case Industry Revenue (Million), by Distribution Channel 2025 & 2033
- Figure 31: South America Phone Case Industry Revenue Share (%), by Distribution Channel 2025 & 2033
- Figure 32: South America Phone Case Industry Revenue (Million), by Country 2025 & 2033
- Figure 33: South America Phone Case Industry Revenue Share (%), by Country 2025 & 2033
- Figure 34: Middle East and Africa Phone Case Industry Revenue (Million), by Product Type 2025 & 2033
- Figure 35: Middle East and Africa Phone Case Industry Revenue Share (%), by Product Type 2025 & 2033
- Figure 36: Middle East and Africa Phone Case Industry Revenue (Million), by Category 2025 & 2033
- Figure 37: Middle East and Africa Phone Case Industry Revenue Share (%), by Category 2025 & 2033
- Figure 38: Middle East and Africa Phone Case Industry Revenue (Million), by Distribution Channel 2025 & 2033
- Figure 39: Middle East and Africa Phone Case Industry Revenue Share (%), by Distribution Channel 2025 & 2033
- Figure 40: Middle East and Africa Phone Case Industry Revenue (Million), by Country 2025 & 2033
- Figure 41: Middle East and Africa Phone Case Industry Revenue Share (%), by Country 2025 & 2033
List of Tables
- Table 1: Global Phone Case Industry Revenue Million Forecast, by Product Type 2020 & 2033
- Table 2: Global Phone Case Industry Revenue Million Forecast, by Category 2020 & 2033
- Table 3: Global Phone Case Industry Revenue Million Forecast, by Distribution Channel 2020 & 2033
- Table 4: Global Phone Case Industry Revenue Million Forecast, by Region 2020 & 2033
- Table 5: Global Phone Case Industry Revenue Million Forecast, by Product Type 2020 & 2033
- Table 6: Global Phone Case Industry Revenue Million Forecast, by Category 2020 & 2033
- Table 7: Global Phone Case Industry Revenue Million Forecast, by Distribution Channel 2020 & 2033
- Table 8: Global Phone Case Industry Revenue Million Forecast, by Country 2020 & 2033
- Table 9: United States Phone Case Industry Revenue (Million) Forecast, by Application 2020 & 2033
- Table 10: Canada Phone Case Industry Revenue (Million) Forecast, by Application 2020 & 2033
- Table 11: Mexico Phone Case Industry Revenue (Million) Forecast, by Application 2020 & 2033
- Table 12: Rest of North America Phone Case Industry Revenue (Million) Forecast, by Application 2020 & 2033
- Table 13: Global Phone Case Industry Revenue Million Forecast, by Product Type 2020 & 2033
- Table 14: Global Phone Case Industry Revenue Million Forecast, by Category 2020 & 2033
- Table 15: Global Phone Case Industry Revenue Million Forecast, by Distribution Channel 2020 & 2033
- Table 16: Global Phone Case Industry Revenue Million Forecast, by Country 2020 & 2033
- Table 17: Germany Phone Case Industry Revenue (Million) Forecast, by Application 2020 & 2033
- Table 18: United Kingdom Phone Case Industry Revenue (Million) Forecast, by Application 2020 & 2033
- Table 19: France Phone Case Industry Revenue (Million) Forecast, by Application 2020 & 2033
- Table 20: Russia Phone Case Industry Revenue (Million) Forecast, by Application 2020 & 2033
- Table 21: Spain Phone Case Industry Revenue (Million) Forecast, by Application 2020 & 2033
- Table 22: Italy Phone Case Industry Revenue (Million) Forecast, by Application 2020 & 2033
- Table 23: Rest of Europe Phone Case Industry Revenue (Million) Forecast, by Application 2020 & 2033
- Table 24: Global Phone Case Industry Revenue Million Forecast, by Product Type 2020 & 2033
- Table 25: Global Phone Case Industry Revenue Million Forecast, by Category 2020 & 2033
- Table 26: Global Phone Case Industry Revenue Million Forecast, by Distribution Channel 2020 & 2033
- Table 27: Global Phone Case Industry Revenue Million Forecast, by Country 2020 & 2033
- Table 28: India Phone Case Industry Revenue (Million) Forecast, by Application 2020 & 2033
- Table 29: China Phone Case Industry Revenue (Million) Forecast, by Application 2020 & 2033
- Table 30: Japan Phone Case Industry Revenue (Million) Forecast, by Application 2020 & 2033
- Table 31: Australia Phone Case Industry Revenue (Million) Forecast, by Application 2020 & 2033
- Table 32: Rest of Asia Pacific Phone Case Industry Revenue (Million) Forecast, by Application 2020 & 2033
- Table 33: Global Phone Case Industry Revenue Million Forecast, by Product Type 2020 & 2033
- Table 34: Global Phone Case Industry Revenue Million Forecast, by Category 2020 & 2033
- Table 35: Global Phone Case Industry Revenue Million Forecast, by Distribution Channel 2020 & 2033
- Table 36: Global Phone Case Industry Revenue Million Forecast, by Country 2020 & 2033
- Table 37: Brazil Phone Case Industry Revenue (Million) Forecast, by Application 2020 & 2033
- Table 38: Argentina Phone Case Industry Revenue (Million) Forecast, by Application 2020 & 2033
- Table 39: Rest of South America Phone Case Industry Revenue (Million) Forecast, by Application 2020 & 2033
- Table 40: Global Phone Case Industry Revenue Million Forecast, by Product Type 2020 & 2033
- Table 41: Global Phone Case Industry Revenue Million Forecast, by Category 2020 & 2033
- Table 42: Global Phone Case Industry Revenue Million Forecast, by Distribution Channel 2020 & 2033
- Table 43: Global Phone Case Industry Revenue Million Forecast, by Country 2020 & 2033
- Table 44: United Arab Emirates Phone Case Industry Revenue (Million) Forecast, by Application 2020 & 2033
- Table 45: South Africa Phone Case Industry Revenue (Million) Forecast, by Application 2020 & 2033
- Table 46: Rest of Middle East and Africa Phone Case Industry Revenue (Million) Forecast, by Application 2020 & 2033
Frequently Asked Questions
1. What is the projected Compound Annual Growth Rate (CAGR) of the Phone Case Industry?
The projected CAGR is approximately 5.33%.
2. Which companies are prominent players in the Phone Case Industry?
Key companies in the market include Urban Armor Gear LLC, Incipio LLC, Moshi Group, Belkin International Inc, Griffin Technology Inc, Ringke Inc, Poetic Cases LLC*List Not Exhaustive, Spigen Inc, OtterBox Holdings Inc, Reiko Wireless Inc.
3. What are the main segments of the Phone Case Industry?
The market segments include Product Type, Category, Distribution Channel.
4. Can you provide details about the market size?
The market size is estimated to be USD 26 Million as of 2022.
5. What are some drivers contributing to market growth?
Surge in Product Innovation; Increasing Government Initiatives and Extensive Promotions by Market Players.
6. What are the notable trends driving market growth?
Rugged Case to Witness a Significant Demand.
7. Are there any restraints impacting market growth?
Safety Concerns Associated with the Usage of Insect Repellents.
8. Can you provide examples of recent developments in the market?
February 2022: Atom Studios launched a new case for Samsung phones following the success of its Apple range. The new Samsung case, called Touch, is available for the S22 and S22+ Samsung Galaxy models and is designed with tactility in mind. The soft, soft-touch silicon outer chosen by Atmos Studios was designated to be touched and feels ultra-soft in hand.
9. What pricing options are available for accessing the report?
Pricing options include single-user, multi-user, and enterprise licenses priced at USD 4750, USD 5250, and USD 8750 respectively.
10. Is the market size provided in terms of value or volume?
The market size is provided in terms of value, measured in Million.
11. Are there any specific market keywords associated with the report?
Yes, the market keyword associated with the report is "Phone Case Industry," which aids in identifying and referencing the specific market segment covered.
12. How do I determine which pricing option suits my needs best?
The pricing options vary based on user requirements and access needs. Individual users may opt for single-user licenses, while businesses requiring broader access may choose multi-user or enterprise licenses for cost-effective access to the report.
13. Are there any additional resources or data provided in the Phone Case Industry report?
While the report offers comprehensive insights, it's advisable to review the specific contents or supplementary materials provided to ascertain if additional resources or data are available.
14. How can I stay updated on further developments or reports in the Phone Case Industry?
To stay informed about further developments, trends, and reports in the Phone Case Industry, consider subscribing to industry newsletters, following relevant companies and organizations, or regularly checking reputable industry news sources and publications.
Methodology
Step 1 - Identification of Relevant Samples Size from Population Database


Step 2 - Approaches for Defining Global Market Size (Value, Volume* & Price*)

Note*: In applicable scenarios
Step 3 - Data Sources
Primary Research
- Web Analytics
- Survey Reports
- Research Institute
- Latest Research Reports
- Opinion Leaders
Secondary Research
- Annual Reports
- White Paper
- Latest Press Release
- Industry Association
- Paid Database
- Investor Presentations

Step 4 - Data Triangulation
Involves using different sources of information in order to increase the validity of a study
These sources are likely to be stakeholders in a program - participants, other researchers, program staff, other community members, and so on.
Then we put all data in single framework & apply various statistical tools to find out the dynamic on the market.
During the analysis stage, feedback from the stakeholder groups would be compared to determine areas of agreement as well as areas of divergence