

Key Insights
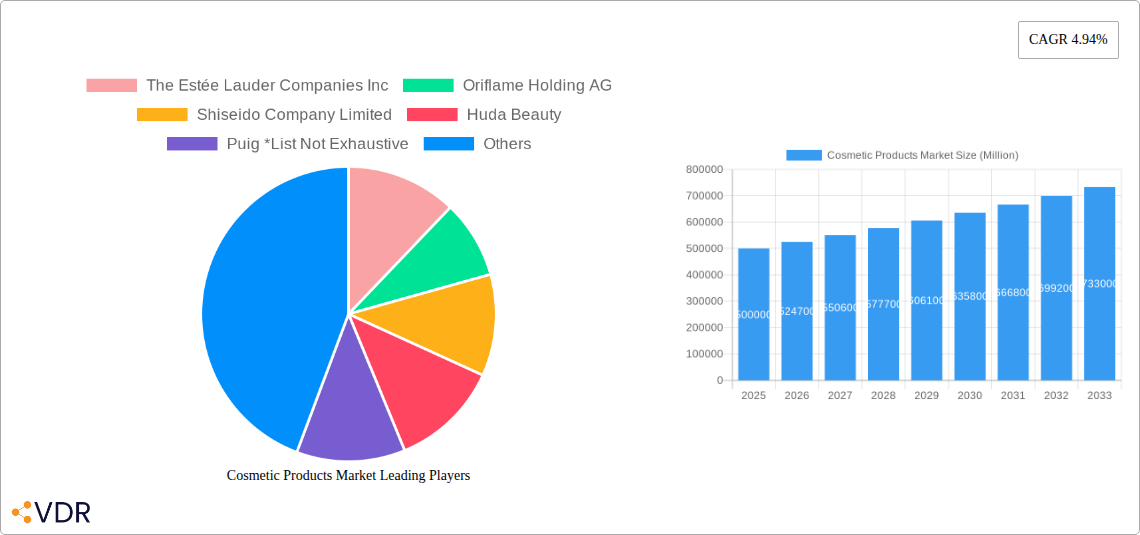
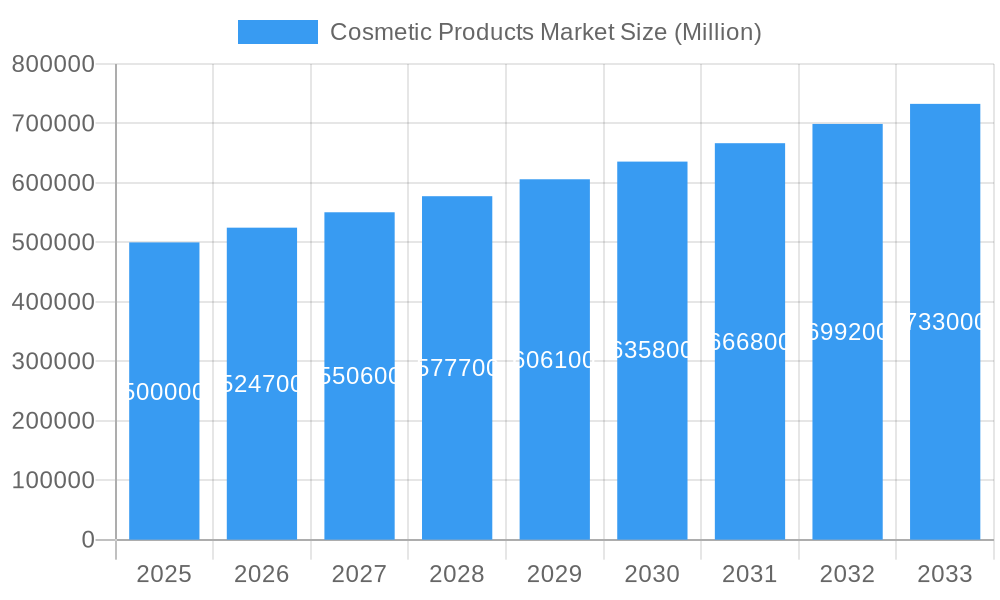
The global cosmetic products market, estimated at 67.54 billion in the base year 2025, is projected for significant expansion, forecasting a compound annual growth rate (CAGR) of 6.01% through 2033. Key growth catalysts include rising disposable incomes in emerging economies, particularly in the Asia-Pacific region, which are driving increased expenditure on beauty and personal care. Concurrently, the pervasive influence of social media and beauty influencers is fueling demand for novel and superior cosmetic offerings. Enhanced awareness of skincare and the growing adoption of tailored beauty regimens further contribute to this positive trajectory. While the premium segment garners higher valuations, the mass segment retains a substantial market share due to its accessibility and affordability. Distribution networks are evolving, with e-commerce experiencing exponential growth alongside traditional channels such as hypermarkets, specialty stores, and pharmacies. However, volatile raw material costs and rigorous regulatory frameworks pose potential challenges. The market is segmented by product type (facial, eye, lip, nail makeup), category (mass, premium), and distribution channel (online, offline). Leading companies including Estée Lauder, L'Oréal, and Shiseido are actively pursuing product innovation and global market penetration.
Cosmetic Products Market Market Size (In Billion)
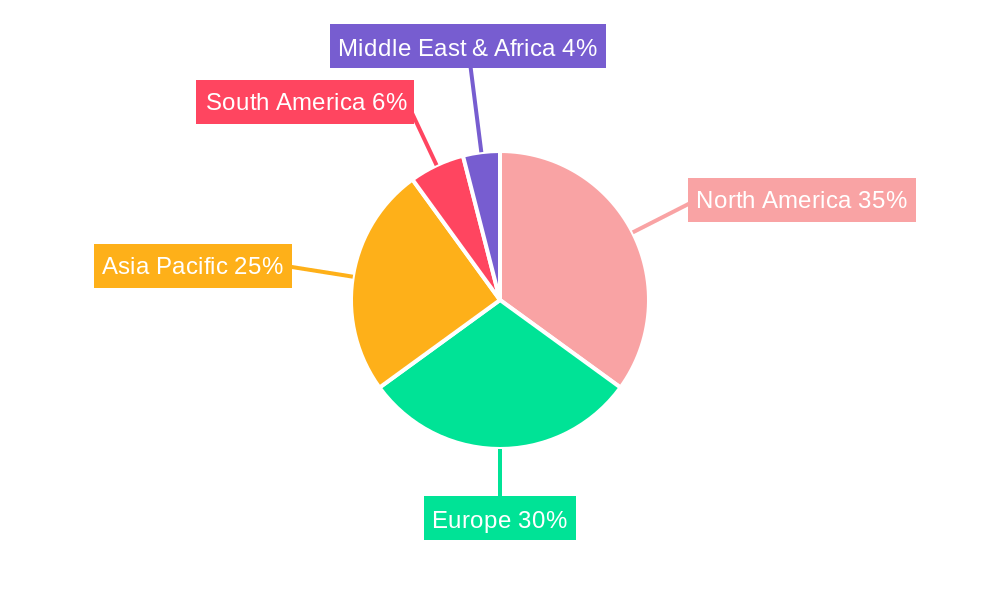
Geographically, North America and Europe represent established markets, while Asia-Pacific demonstrates considerable growth potential owing to its expanding middle class and increasing beauty consciousness. The competitive environment is characterized by a high degree of fragmentation, with established global players and emerging niche brands vying for market leadership. Brand success hinges on adaptability to evolving consumer preferences, effective digital marketing strategies, and the delivery of innovative, high-quality products tailored to regional demands and trends. This necessitates robust branding, impactful marketing campaigns, and agile supply chains to meet escalating demand amidst regulatory complexities. Future expansion is anticipated to be propelled by the increasing demand for natural, organic cosmetics, sustainable packaging solutions, and technologically advanced products.
Cosmetic Products Market Company Market Share
Cosmetic Products Market: A Comprehensive Market Report (2019-2033)
This in-depth report provides a comprehensive analysis of the global cosmetic products market, encompassing market dynamics, growth trends, regional segmentation, product landscape, key players, and future outlook. The study period covers 2019-2033, with 2025 as the base and estimated year. The report segments the market by product type (Facial Make-up Products, Eye Make-up Products, Lip Make-up Products, Nail Make-up Products), category (Mass, Premium), and distribution channel (Hypermarkets/Supermarkets, Specialty Stores, Online Retail Stores, Pharmacies and Drug Stores, Other Distribution Channels). Key players analyzed include The Estée Lauder Companies Inc, Oriflame Holding AG, Shiseido Company Limited, Huda Beauty, Puig, L'Oréal S A, Revlon Inc, Natura & Co, LVMH Moët Hennessy Louis Vuitton, and JAB Cosmetics B V (Coty Inc), amongst others. The report forecasts a market value of XX Million units by 2033.
Cosmetic Products Market Dynamics & Structure
The cosmetic products market is characterized by high competition, continuous innovation, and evolving consumer preferences. Market concentration is moderately high, with several large multinational corporations holding significant market share. Technological advancements in formulation, packaging, and digital marketing significantly impact market dynamics. Stringent regulatory frameworks regarding product safety and labeling influence product development and distribution. The market experiences competitive pressure from product substitutes, particularly natural and organic alternatives. End-user demographics, particularly the growing middle class in emerging economies and the increasing importance of male grooming, significantly drive demand. M&A activities are frequent, with larger companies acquiring smaller brands to expand their product portfolios and market reach. In the historical period (2019-2024), the average M&A deal volume was approximately XX deals per year.
- Market Concentration: Moderately high, with top 10 players holding approximately XX% market share in 2024.
- Technological Innovation: Focus on sustainable, natural ingredients, personalized products, and advanced delivery systems.
- Regulatory Framework: Stringent regulations regarding safety, labeling, and claims significantly impact market operations.
- Competitive Substitutes: Natural and organic cosmetics, homemade beauty products posing a growing challenge.
- End-User Demographics: Growing middle class in emerging markets and increasing male grooming contribute to market expansion.
- M&A Trends: High volume of mergers and acquisitions to expand product portfolios and market reach.
Cosmetic Products Market Growth Trends & Insights
The global cosmetic products market experienced robust growth during the historical period (2019-2024), driven by increasing disposable incomes, rising awareness of personal care, and the growing popularity of online retail. The market exhibited a CAGR of XX% during this period. Technological disruptions, particularly the rise of e-commerce and the influence of social media influencers, have significantly impacted market dynamics. Consumer behavior shifts towards natural and ethically sourced products, personalized beauty routines, and increased demand for experience-driven purchasing are reshaping the industry. The market is expected to maintain a steady growth trajectory during the forecast period (2025-2033), with a projected CAGR of XX%. Market penetration is expected to increase significantly in developing regions. Further, increasing demand for sustainable and eco-friendly products is also fueling growth. The shift towards personalized beauty solutions through AI and customized formulations are key drivers of market expansion.
Dominant Regions, Countries, or Segments in Cosmetic Products Market
North America and Europe historically dominated the cosmetic products market due to high per capita consumption, established retail infrastructure, and strong brand presence. However, Asia-Pacific is experiencing the fastest growth, driven by rising disposable incomes, increasing urbanization, and a growing awareness of personal care in emerging markets like India and China. Within product types, facial make-up products constitute the largest segment, followed by lip and eye make-up products. The premium category commands higher price points and profitability compared to the mass segment. Online retail stores are exhibiting rapid growth as a distribution channel, although traditional channels like hypermarkets and specialty stores remain significant.
- Key Drivers in Asia-Pacific: Rising disposable incomes, increasing urbanization, and growing awareness of personal care.
- Dominant Segment: Facial make-up products hold the largest market share, driven by continuous innovation and diverse product offerings.
- Fastest-Growing Channel: Online retail stores demonstrate significant growth potential due to convenience and increased reach.
- Market Share: North America holds approximately XX% market share, while Asia-Pacific is projected to reach XX% by 2033.
Cosmetic Products Market Product Landscape
The cosmetic products market is characterized by continuous product innovation, focusing on enhancing performance, improving textures, and incorporating natural ingredients. New product launches emphasize unique selling propositions (USPs), such as long-lasting wear, enhanced pigmentation, and skincare benefits. Technological advancements, such as the development of advanced formulas with targeted active ingredients and sustainable packaging, are shaping product development. The growing trend of personalization is leading to customized product offerings tailored to individual consumer needs.
Key Drivers, Barriers & Challenges in Cosmetic Products Market
Key Drivers:
- Rising Disposable Incomes: Increased purchasing power fuels demand, particularly in developing economies.
- Growing Awareness of Personal Care: Enhanced focus on appearance and self-care boosts consumption.
- Technological Advancements: Innovation in formulation and marketing drives market growth.
- E-commerce Growth: Online retail provides convenient access and expands market reach.
Challenges & Restraints:
- Fluctuating Raw Material Prices: Increased volatility leads to cost pressures and margin squeezes.
- Stringent Regulations: Compliance costs and delays can hamper product launches and market expansion.
- Counterfeit Products: The presence of imitation products negatively impacts brand reputation and market share. Estimated losses due to counterfeiting in 2024 were approximately XX Million units.
Emerging Opportunities in Cosmetic Products Market
- Untapped Markets: Expanding into emerging economies with high growth potential.
- Personalized Beauty: Tailoring products and experiences to individual consumer preferences.
- Sustainable and Ethical Practices: Increasing demand for eco-friendly and cruelty-free products.
- Men's Grooming: Growing market segment with significant growth potential.
Growth Accelerators in the Cosmetic Products Market Industry
Strategic partnerships between beauty brands and technology companies are driving innovation and market expansion. Technological breakthroughs, particularly in personalized beauty solutions and sustainable packaging, are enhancing product appeal and fostering consumer loyalty. Market expansion strategies focusing on emerging markets are unlocking new growth avenues. This includes focused marketing campaigns addressing cultural nuances and developing distribution networks in underserved regions.
Key Players Shaping the Cosmetic Products Market Market
- The Estée Lauder Companies Inc
- Oriflame Holding AG
- Shiseido Company Limited
- Huda Beauty
- Puig
- L'Oréal S A
- Revlon Inc
- Natura & Co
- LVMH Moët Hennessy Louis Vuitton
- JAB Cosmetics B V (Coty Inc)
Notable Milestones in Cosmetic Products Market Sector
- May 2022: Estée Lauder partnered with Shoppers Stop to open an exclusive SS Beauty store in Mumbai, strengthening their presence in India.
- May 2022: Estée Lauder's M.A.C Cosmetics launched a Stranger Things makeup collection in collaboration with Netflix, leveraging popular culture for brand promotion.
- May 2022: L'Oréal's Maybelline New York unveiled its Super Stay Vinyl Ink Liquid Lip Color, expanding its product portfolio with a long-lasting lip product.
In-Depth Cosmetic Products Market Market Outlook
The cosmetic products market is poised for continued growth, driven by ongoing innovation, evolving consumer preferences, and expansion into new markets. Strategic investments in research and development, sustainable practices, and digital marketing will be crucial for success. Brands that effectively leverage personalization, digital engagement, and ethical sourcing will gain a competitive advantage. The market’s future potential is significant, particularly in emerging economies and within niche segments such as men's grooming and sustainable beauty.
Cosmetic Products Market Segmentation
-
1. Product Type
- 1.1. Facial Make-up Products
- 1.2. Eye Make-up Products
- 1.3. Lip Make-up Products
- 1.4. Nail Make-up Products
-
2. Category
- 2.1. Mass
- 2.2. Premium
-
3. Distribution Channel
- 3.1. Hypermarkets/Supermarkets
- 3.2. Specialty Stores
- 3.3. Online Retail Stores
- 3.4. Pharmacies and Drug Stores
- 3.5. Other Distribution Channels
Cosmetic Products Market Segmentation By Geography
-
1. North America
- 1.1. United States
- 1.2. Canada
- 1.3. Mexico
- 1.4. Rest of North America
-
2. Europe
- 2.1. United Kingdom
- 2.2. Germany
- 2.3. Spain
- 2.4. France
- 2.5. Italy
- 2.6. Russia
- 2.7. Rest of Europe
-
3. Asia Pacific
- 3.1. China
- 3.2. Japan
- 3.3. India
- 3.4. Australia
- 3.5. Rest of Asia Pacific
-
4. South America
- 4.1. Brazil
- 4.2. Argentina
- 4.3. Rest of South America
- 5. Middle East
-
6. United Arab Emirates
- 6.1. South Africa
- 6.2. Rest of Middle East
Cosmetic Products Market Regional Market Share
Geographic Coverage of Cosmetic Products Market
Cosmetic Products Market REPORT HIGHLIGHTS
| Aspects | Details |
|---|---|
| Study Period | 2020-2034 |
| Base Year | 2025 |
| Estimated Year | 2026 |
| Forecast Period | 2026-2034 |
| Historical Period | 2020-2025 |
| Growth Rate | CAGR of 6.01% from 2020-2034 |
| Segmentation |
|
Table of Contents
- 1. Introduction
- 1.1. Research Scope
- 1.2. Market Segmentation
- 1.3. Research Objective
- 1.4. Definitions and Assumptions
- 2. Executive Summary
- 2.1. Market Snapshot
- 3. Market Dynamics
- 3.1. Market Drivers
- 3.2. Market Restrains
- 3.3. Market Trends
- 3.4. Market Opportunities
- 4. Market Factor Analysis
- 4.1. Porters Five Forces
- 4.1.1. Bargaining Power of Suppliers
- 4.1.2. Bargaining Power of Buyers
- 4.1.3. Threat of New Entrants
- 4.1.4. Threat of Substitutes
- 4.1.5. Competitive Rivalry
- 4.2. PESTEL analysis
- 4.3. BCG Analysis
- 4.3.1. Stars (High Growth, High Market Share)
- 4.3.2. Cash Cows (Low Growth, High Market Share)
- 4.3.3. Question Mark (High Growth, Low Market Share)
- 4.3.4. Dogs (Low Growth, Low Market Share)
- 4.4. Ansoff Matrix Analysis
- 4.5. Supply Chain Analysis
- 4.6. Regulatory Landscape
- 4.7. Current Market Potential and Opportunity Assessment (TAM–SAM–SOM Framework)
- 4.8. VDR Analyst Note
- 4.1. Porters Five Forces
- 5. Market Analysis, Insights and Forecast 2021-2033
- 5.1. Market Analysis, Insights and Forecast - by Product Type
- 5.1.1. Facial Make-up Products
- 5.1.2. Eye Make-up Products
- 5.1.3. Lip Make-up Products
- 5.1.4. Nail Make-up Products
- 5.2. Market Analysis, Insights and Forecast - by Category
- 5.2.1. Mass
- 5.2.2. Premium
- 5.3. Market Analysis, Insights and Forecast - by Distribution Channel
- 5.3.1. Hypermarkets/Supermarkets
- 5.3.2. Specialty Stores
- 5.3.3. Online Retail Stores
- 5.3.4. Pharmacies and Drug Stores
- 5.3.5. Other Distribution Channels
- 5.4. Market Analysis, Insights and Forecast - by Region
- 5.4.1. North America
- 5.4.2. Europe
- 5.4.3. Asia Pacific
- 5.4.4. South America
- 5.4.5. Middle East
- 5.4.6. United Arab Emirates
- 5.1. Market Analysis, Insights and Forecast - by Product Type
- 6. Global Cosmetic Products Market Analysis, Insights and Forecast, 2021-2033
- 6.1. Market Analysis, Insights and Forecast - by Product Type
- 6.1.1. Facial Make-up Products
- 6.1.2. Eye Make-up Products
- 6.1.3. Lip Make-up Products
- 6.1.4. Nail Make-up Products
- 6.2. Market Analysis, Insights and Forecast - by Category
- 6.2.1. Mass
- 6.2.2. Premium
- 6.3. Market Analysis, Insights and Forecast - by Distribution Channel
- 6.3.1. Hypermarkets/Supermarkets
- 6.3.2. Specialty Stores
- 6.3.3. Online Retail Stores
- 6.3.4. Pharmacies and Drug Stores
- 6.3.5. Other Distribution Channels
- 6.1. Market Analysis, Insights and Forecast - by Product Type
- 7. North America Cosmetic Products Market Analysis, Insights and Forecast, 2021-2033
- 7.1. Market Analysis, Insights and Forecast - by Product Type
- 7.1.1. Facial Make-up Products
- 7.1.2. Eye Make-up Products
- 7.1.3. Lip Make-up Products
- 7.1.4. Nail Make-up Products
- 7.2. Market Analysis, Insights and Forecast - by Category
- 7.2.1. Mass
- 7.2.2. Premium
- 7.3. Market Analysis, Insights and Forecast - by Distribution Channel
- 7.3.1. Hypermarkets/Supermarkets
- 7.3.2. Specialty Stores
- 7.3.3. Online Retail Stores
- 7.3.4. Pharmacies and Drug Stores
- 7.3.5. Other Distribution Channels
- 7.1. Market Analysis, Insights and Forecast - by Product Type
- 8. Europe Cosmetic Products Market Analysis, Insights and Forecast, 2021-2033
- 8.1. Market Analysis, Insights and Forecast - by Product Type
- 8.1.1. Facial Make-up Products
- 8.1.2. Eye Make-up Products
- 8.1.3. Lip Make-up Products
- 8.1.4. Nail Make-up Products
- 8.2. Market Analysis, Insights and Forecast - by Category
- 8.2.1. Mass
- 8.2.2. Premium
- 8.3. Market Analysis, Insights and Forecast - by Distribution Channel
- 8.3.1. Hypermarkets/Supermarkets
- 8.3.2. Specialty Stores
- 8.3.3. Online Retail Stores
- 8.3.4. Pharmacies and Drug Stores
- 8.3.5. Other Distribution Channels
- 8.1. Market Analysis, Insights and Forecast - by Product Type
- 9. Asia Pacific Cosmetic Products Market Analysis, Insights and Forecast, 2021-2033
- 9.1. Market Analysis, Insights and Forecast - by Product Type
- 9.1.1. Facial Make-up Products
- 9.1.2. Eye Make-up Products
- 9.1.3. Lip Make-up Products
- 9.1.4. Nail Make-up Products
- 9.2. Market Analysis, Insights and Forecast - by Category
- 9.2.1. Mass
- 9.2.2. Premium
- 9.3. Market Analysis, Insights and Forecast - by Distribution Channel
- 9.3.1. Hypermarkets/Supermarkets
- 9.3.2. Specialty Stores
- 9.3.3. Online Retail Stores
- 9.3.4. Pharmacies and Drug Stores
- 9.3.5. Other Distribution Channels
- 9.1. Market Analysis, Insights and Forecast - by Product Type
- 10. South America Cosmetic Products Market Analysis, Insights and Forecast, 2021-2033
- 10.1. Market Analysis, Insights and Forecast - by Product Type
- 10.1.1. Facial Make-up Products
- 10.1.2. Eye Make-up Products
- 10.1.3. Lip Make-up Products
- 10.1.4. Nail Make-up Products
- 10.2. Market Analysis, Insights and Forecast - by Category
- 10.2.1. Mass
- 10.2.2. Premium
- 10.3. Market Analysis, Insights and Forecast - by Distribution Channel
- 10.3.1. Hypermarkets/Supermarkets
- 10.3.2. Specialty Stores
- 10.3.3. Online Retail Stores
- 10.3.4. Pharmacies and Drug Stores
- 10.3.5. Other Distribution Channels
- 10.1. Market Analysis, Insights and Forecast - by Product Type
- 11. Middle East Cosmetic Products Market Analysis, Insights and Forecast, 2021-2033
- 11.1. Market Analysis, Insights and Forecast - by Product Type
- 11.1.1. Facial Make-up Products
- 11.1.2. Eye Make-up Products
- 11.1.3. Lip Make-up Products
- 11.1.4. Nail Make-up Products
- 11.2. Market Analysis, Insights and Forecast - by Category
- 11.2.1. Mass
- 11.2.2. Premium
- 11.3. Market Analysis, Insights and Forecast - by Distribution Channel
- 11.3.1. Hypermarkets/Supermarkets
- 11.3.2. Specialty Stores
- 11.3.3. Online Retail Stores
- 11.3.4. Pharmacies and Drug Stores
- 11.3.5. Other Distribution Channels
- 11.1. Market Analysis, Insights and Forecast - by Product Type
- 12. United Arab Emirates Cosmetic Products Market Analysis, Insights and Forecast, 2021-2033
- 12.1. Market Analysis, Insights and Forecast - by Product Type
- 12.1.1. Facial Make-up Products
- 12.1.2. Eye Make-up Products
- 12.1.3. Lip Make-up Products
- 12.1.4. Nail Make-up Products
- 12.2. Market Analysis, Insights and Forecast - by Category
- 12.2.1. Mass
- 12.2.2. Premium
- 12.3. Market Analysis, Insights and Forecast - by Distribution Channel
- 12.3.1. Hypermarkets/Supermarkets
- 12.3.2. Specialty Stores
- 12.3.3. Online Retail Stores
- 12.3.4. Pharmacies and Drug Stores
- 12.3.5. Other Distribution Channels
- 12.1. Market Analysis, Insights and Forecast - by Product Type
- 13. Competitive Analysis
- 13.1. Company Profiles
- 13.1.1 The Estée Lauder Companies Inc
- 13.1.1.1. Company Overview
- 13.1.1.2. Products
- 13.1.1.3. Company Financials
- 13.1.1.4. SWOT Analysis
- 13.1.2 Oriflame Holding AG
- 13.1.2.1. Company Overview
- 13.1.2.2. Products
- 13.1.2.3. Company Financials
- 13.1.2.4. SWOT Analysis
- 13.1.3 Shiseido Company Limited
- 13.1.3.1. Company Overview
- 13.1.3.2. Products
- 13.1.3.3. Company Financials
- 13.1.3.4. SWOT Analysis
- 13.1.4 Huda Beauty
- 13.1.4.1. Company Overview
- 13.1.4.2. Products
- 13.1.4.3. Company Financials
- 13.1.4.4. SWOT Analysis
- 13.1.5 Puig *List Not Exhaustive
- 13.1.5.1. Company Overview
- 13.1.5.2. Products
- 13.1.5.3. Company Financials
- 13.1.5.4. SWOT Analysis
- 13.1.6 L'Oréal S A
- 13.1.6.1. Company Overview
- 13.1.6.2. Products
- 13.1.6.3. Company Financials
- 13.1.6.4. SWOT Analysis
- 13.1.7 Revlon Inc
- 13.1.7.1. Company Overview
- 13.1.7.2. Products
- 13.1.7.3. Company Financials
- 13.1.7.4. SWOT Analysis
- 13.1.8 Natura & Co
- 13.1.8.1. Company Overview
- 13.1.8.2. Products
- 13.1.8.3. Company Financials
- 13.1.8.4. SWOT Analysis
- 13.1.9 LVMH Moët Hennessy Louis Vuitton
- 13.1.9.1. Company Overview
- 13.1.9.2. Products
- 13.1.9.3. Company Financials
- 13.1.9.4. SWOT Analysis
- 13.1.10 JAB Cosmetics B V (Coty Inc )
- 13.1.10.1. Company Overview
- 13.1.10.2. Products
- 13.1.10.3. Company Financials
- 13.1.10.4. SWOT Analysis
- 13.1.1 The Estée Lauder Companies Inc
- 13.2. Market Entropy
- 13.2.1 Company's Key Areas Served
- 13.2.2 Recent Developments
- 13.3. Company Market Share Analysis 2025
- 13.3.1 Top 5 Companies Market Share Analysis
- 13.3.2 Top 3 Companies Market Share Analysis
- 13.4. List of Potential Customers
- 14. Research Methodology
List of Figures
- Figure 1: Global Cosmetic Products Market Revenue Breakdown (billion, %) by Region 2025 & 2033
- Figure 2: North America Cosmetic Products Market Revenue (billion), by Product Type 2025 & 2033
- Figure 3: North America Cosmetic Products Market Revenue Share (%), by Product Type 2025 & 2033
- Figure 4: North America Cosmetic Products Market Revenue (billion), by Category 2025 & 2033
- Figure 5: North America Cosmetic Products Market Revenue Share (%), by Category 2025 & 2033
- Figure 6: North America Cosmetic Products Market Revenue (billion), by Distribution Channel 2025 & 2033
- Figure 7: North America Cosmetic Products Market Revenue Share (%), by Distribution Channel 2025 & 2033
- Figure 8: North America Cosmetic Products Market Revenue (billion), by Country 2025 & 2033
- Figure 9: North America Cosmetic Products Market Revenue Share (%), by Country 2025 & 2033
- Figure 10: Europe Cosmetic Products Market Revenue (billion), by Product Type 2025 & 2033
- Figure 11: Europe Cosmetic Products Market Revenue Share (%), by Product Type 2025 & 2033
- Figure 12: Europe Cosmetic Products Market Revenue (billion), by Category 2025 & 2033
- Figure 13: Europe Cosmetic Products Market Revenue Share (%), by Category 2025 & 2033
- Figure 14: Europe Cosmetic Products Market Revenue (billion), by Distribution Channel 2025 & 2033
- Figure 15: Europe Cosmetic Products Market Revenue Share (%), by Distribution Channel 2025 & 2033
- Figure 16: Europe Cosmetic Products Market Revenue (billion), by Country 2025 & 2033
- Figure 17: Europe Cosmetic Products Market Revenue Share (%), by Country 2025 & 2033
- Figure 18: Asia Pacific Cosmetic Products Market Revenue (billion), by Product Type 2025 & 2033
- Figure 19: Asia Pacific Cosmetic Products Market Revenue Share (%), by Product Type 2025 & 2033
- Figure 20: Asia Pacific Cosmetic Products Market Revenue (billion), by Category 2025 & 2033
- Figure 21: Asia Pacific Cosmetic Products Market Revenue Share (%), by Category 2025 & 2033
- Figure 22: Asia Pacific Cosmetic Products Market Revenue (billion), by Distribution Channel 2025 & 2033
- Figure 23: Asia Pacific Cosmetic Products Market Revenue Share (%), by Distribution Channel 2025 & 2033
- Figure 24: Asia Pacific Cosmetic Products Market Revenue (billion), by Country 2025 & 2033
- Figure 25: Asia Pacific Cosmetic Products Market Revenue Share (%), by Country 2025 & 2033
- Figure 26: South America Cosmetic Products Market Revenue (billion), by Product Type 2025 & 2033
- Figure 27: South America Cosmetic Products Market Revenue Share (%), by Product Type 2025 & 2033
- Figure 28: South America Cosmetic Products Market Revenue (billion), by Category 2025 & 2033
- Figure 29: South America Cosmetic Products Market Revenue Share (%), by Category 2025 & 2033
- Figure 30: South America Cosmetic Products Market Revenue (billion), by Distribution Channel 2025 & 2033
- Figure 31: South America Cosmetic Products Market Revenue Share (%), by Distribution Channel 2025 & 2033
- Figure 32: South America Cosmetic Products Market Revenue (billion), by Country 2025 & 2033
- Figure 33: South America Cosmetic Products Market Revenue Share (%), by Country 2025 & 2033
- Figure 34: Middle East Cosmetic Products Market Revenue (billion), by Product Type 2025 & 2033
- Figure 35: Middle East Cosmetic Products Market Revenue Share (%), by Product Type 2025 & 2033
- Figure 36: Middle East Cosmetic Products Market Revenue (billion), by Category 2025 & 2033
- Figure 37: Middle East Cosmetic Products Market Revenue Share (%), by Category 2025 & 2033
- Figure 38: Middle East Cosmetic Products Market Revenue (billion), by Distribution Channel 2025 & 2033
- Figure 39: Middle East Cosmetic Products Market Revenue Share (%), by Distribution Channel 2025 & 2033
- Figure 40: Middle East Cosmetic Products Market Revenue (billion), by Country 2025 & 2033
- Figure 41: Middle East Cosmetic Products Market Revenue Share (%), by Country 2025 & 2033
- Figure 42: United Arab Emirates Cosmetic Products Market Revenue (billion), by Product Type 2025 & 2033
- Figure 43: United Arab Emirates Cosmetic Products Market Revenue Share (%), by Product Type 2025 & 2033
- Figure 44: United Arab Emirates Cosmetic Products Market Revenue (billion), by Category 2025 & 2033
- Figure 45: United Arab Emirates Cosmetic Products Market Revenue Share (%), by Category 2025 & 2033
- Figure 46: United Arab Emirates Cosmetic Products Market Revenue (billion), by Distribution Channel 2025 & 2033
- Figure 47: United Arab Emirates Cosmetic Products Market Revenue Share (%), by Distribution Channel 2025 & 2033
- Figure 48: United Arab Emirates Cosmetic Products Market Revenue (billion), by Country 2025 & 2033
- Figure 49: United Arab Emirates Cosmetic Products Market Revenue Share (%), by Country 2025 & 2033
List of Tables
- Table 1: Global Cosmetic Products Market Revenue billion Forecast, by Product Type 2020 & 2033
- Table 2: Global Cosmetic Products Market Revenue billion Forecast, by Category 2020 & 2033
- Table 3: Global Cosmetic Products Market Revenue billion Forecast, by Distribution Channel 2020 & 2033
- Table 4: Global Cosmetic Products Market Revenue billion Forecast, by Region 2020 & 2033
- Table 5: Global Cosmetic Products Market Revenue billion Forecast, by Product Type 2020 & 2033
- Table 6: Global Cosmetic Products Market Revenue billion Forecast, by Category 2020 & 2033
- Table 7: Global Cosmetic Products Market Revenue billion Forecast, by Distribution Channel 2020 & 2033
- Table 8: Global Cosmetic Products Market Revenue billion Forecast, by Country 2020 & 2033
- Table 9: United States Cosmetic Products Market Revenue (billion) Forecast, by Application 2020 & 2033
- Table 10: Canada Cosmetic Products Market Revenue (billion) Forecast, by Application 2020 & 2033
- Table 11: Mexico Cosmetic Products Market Revenue (billion) Forecast, by Application 2020 & 2033
- Table 12: Rest of North America Cosmetic Products Market Revenue (billion) Forecast, by Application 2020 & 2033
- Table 13: Global Cosmetic Products Market Revenue billion Forecast, by Product Type 2020 & 2033
- Table 14: Global Cosmetic Products Market Revenue billion Forecast, by Category 2020 & 2033
- Table 15: Global Cosmetic Products Market Revenue billion Forecast, by Distribution Channel 2020 & 2033
- Table 16: Global Cosmetic Products Market Revenue billion Forecast, by Country 2020 & 2033
- Table 17: United Kingdom Cosmetic Products Market Revenue (billion) Forecast, by Application 2020 & 2033
- Table 18: Germany Cosmetic Products Market Revenue (billion) Forecast, by Application 2020 & 2033
- Table 19: Spain Cosmetic Products Market Revenue (billion) Forecast, by Application 2020 & 2033
- Table 20: France Cosmetic Products Market Revenue (billion) Forecast, by Application 2020 & 2033
- Table 21: Italy Cosmetic Products Market Revenue (billion) Forecast, by Application 2020 & 2033
- Table 22: Russia Cosmetic Products Market Revenue (billion) Forecast, by Application 2020 & 2033
- Table 23: Rest of Europe Cosmetic Products Market Revenue (billion) Forecast, by Application 2020 & 2033
- Table 24: Global Cosmetic Products Market Revenue billion Forecast, by Product Type 2020 & 2033
- Table 25: Global Cosmetic Products Market Revenue billion Forecast, by Category 2020 & 2033
- Table 26: Global Cosmetic Products Market Revenue billion Forecast, by Distribution Channel 2020 & 2033
- Table 27: Global Cosmetic Products Market Revenue billion Forecast, by Country 2020 & 2033
- Table 28: China Cosmetic Products Market Revenue (billion) Forecast, by Application 2020 & 2033
- Table 29: Japan Cosmetic Products Market Revenue (billion) Forecast, by Application 2020 & 2033
- Table 30: India Cosmetic Products Market Revenue (billion) Forecast, by Application 2020 & 2033
- Table 31: Australia Cosmetic Products Market Revenue (billion) Forecast, by Application 2020 & 2033
- Table 32: Rest of Asia Pacific Cosmetic Products Market Revenue (billion) Forecast, by Application 2020 & 2033
- Table 33: Global Cosmetic Products Market Revenue billion Forecast, by Product Type 2020 & 2033
- Table 34: Global Cosmetic Products Market Revenue billion Forecast, by Category 2020 & 2033
- Table 35: Global Cosmetic Products Market Revenue billion Forecast, by Distribution Channel 2020 & 2033
- Table 36: Global Cosmetic Products Market Revenue billion Forecast, by Country 2020 & 2033
- Table 37: Brazil Cosmetic Products Market Revenue (billion) Forecast, by Application 2020 & 2033
- Table 38: Argentina Cosmetic Products Market Revenue (billion) Forecast, by Application 2020 & 2033
- Table 39: Rest of South America Cosmetic Products Market Revenue (billion) Forecast, by Application 2020 & 2033
- Table 40: Global Cosmetic Products Market Revenue billion Forecast, by Product Type 2020 & 2033
- Table 41: Global Cosmetic Products Market Revenue billion Forecast, by Category 2020 & 2033
- Table 42: Global Cosmetic Products Market Revenue billion Forecast, by Distribution Channel 2020 & 2033
- Table 43: Global Cosmetic Products Market Revenue billion Forecast, by Country 2020 & 2033
- Table 44: Global Cosmetic Products Market Revenue billion Forecast, by Product Type 2020 & 2033
- Table 45: Global Cosmetic Products Market Revenue billion Forecast, by Category 2020 & 2033
- Table 46: Global Cosmetic Products Market Revenue billion Forecast, by Distribution Channel 2020 & 2033
- Table 47: Global Cosmetic Products Market Revenue billion Forecast, by Country 2020 & 2033
- Table 48: South Africa Cosmetic Products Market Revenue (billion) Forecast, by Application 2020 & 2033
- Table 49: Rest of Middle East Cosmetic Products Market Revenue (billion) Forecast, by Application 2020 & 2033
Frequently Asked Questions
1. What is the projected Compound Annual Growth Rate (CAGR) of the Cosmetic Products Market?
The projected CAGR is approximately 6.01%.
2. Which companies are prominent players in the Cosmetic Products Market?
Key companies in the market include The Estée Lauder Companies Inc, Oriflame Holding AG, Shiseido Company Limited, Huda Beauty, Puig *List Not Exhaustive, L'Oréal S A, Revlon Inc, Natura & Co, LVMH Moët Hennessy Louis Vuitton, JAB Cosmetics B V (Coty Inc ).
3. What are the main segments of the Cosmetic Products Market?
The market segments include Product Type, Category, Distribution Channel.
4. Can you provide details about the market size?
The market size is estimated to be USD 67.54 billion as of 2022.
5. What are some drivers contributing to market growth?
Sustainable Fashion Trend; Strategic Expansion With Respect To E-commerce Subscription.
6. What are the notable trends driving market growth?
Inclination Toward Organic. Vegan and Cruelty-Free Cosmetic Products.
7. Are there any restraints impacting market growth?
High Cost of Rented Apparel Maintenance.
8. Can you provide examples of recent developments in the market?
May 2022: Estée Lauder with Shoppers Stop opened an exclusive SS Beauty store in Mumbai. With this establishment, the two companies have strengthened their partnership in India. The SS beauty store will offer only Estée Lauder brands like MAC Cosmetics, Clinique, Bobbi Brown, Jo Malone, Estee Lauder, Smashbox, and Tom Ford.
9. What pricing options are available for accessing the report?
Pricing options include single-user, multi-user, and enterprise licenses priced at USD 4750, USD 5250, and USD 8750 respectively.
10. Is the market size provided in terms of value or volume?
The market size is provided in terms of value, measured in billion.
11. Are there any specific market keywords associated with the report?
Yes, the market keyword associated with the report is "Cosmetic Products Market," which aids in identifying and referencing the specific market segment covered.
12. How do I determine which pricing option suits my needs best?
The pricing options vary based on user requirements and access needs. Individual users may opt for single-user licenses, while businesses requiring broader access may choose multi-user or enterprise licenses for cost-effective access to the report.
13. Are there any additional resources or data provided in the Cosmetic Products Market report?
While the report offers comprehensive insights, it's advisable to review the specific contents or supplementary materials provided to ascertain if additional resources or data are available.
14. How can I stay updated on further developments or reports in the Cosmetic Products Market?
To stay informed about further developments, trends, and reports in the Cosmetic Products Market, consider subscribing to industry newsletters, following relevant companies and organizations, or regularly checking reputable industry news sources and publications.
Methodology
Step 1 - Identification of Relevant Samples Size from Population Database


Step 2 - Approaches for Defining Global Market Size (Value, Volume* & Price*)

Note*: In applicable scenarios
Step 3 - Data Sources
Primary Research
- Web Analytics
- Survey Reports
- Research Institute
- Latest Research Reports
- Opinion Leaders
Secondary Research
- Annual Reports
- White Paper
- Latest Press Release
- Industry Association
- Paid Database
- Investor Presentations

Step 4 - Data Triangulation
Involves using different sources of information in order to increase the validity of a study
These sources are likely to be stakeholders in a program - participants, other researchers, program staff, other community members, and so on.
Then we put all data in single framework & apply various statistical tools to find out the dynamic on the market.
During the analysis stage, feedback from the stakeholder groups would be compared to determine areas of agreement as well as areas of divergence