
Key Insights
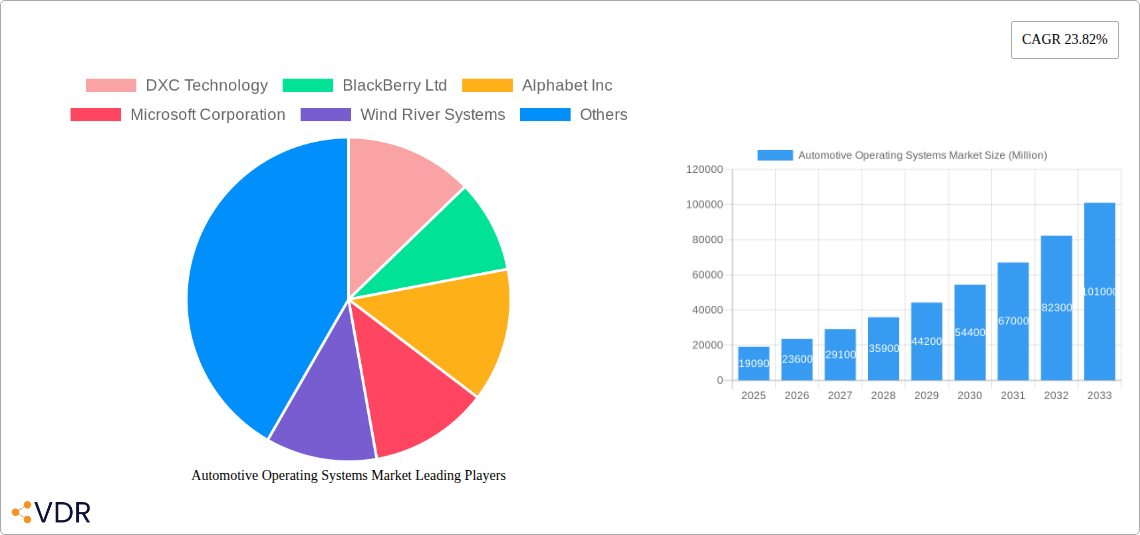
The Automotive Operating Systems (AOS) market is experiencing robust growth, projected to reach \$19.09 billion in 2025 and exhibiting a Compound Annual Growth Rate (CAGR) of 23.82% from 2025 to 2033. This expansion is driven by the increasing integration of advanced driver-assistance systems (ADAS), connected car features, and the rising demand for in-vehicle infotainment systems. The shift towards electric and autonomous vehicles further fuels market growth, as these technologies heavily rely on sophisticated and reliable operating systems for seamless functionality and safety. The market is segmented by operating system type (QNX, Linux, Android, Windows, and others), vehicle type (passenger cars and commercial vehicles), and application type (infotainment, ADAS & safety, connected services, body control, engine management, and others). Linux and Android dominate the OS segment, benefiting from their open-source nature and adaptability, while QNX retains a strong presence in high-reliability applications. The North American market currently holds a significant share, driven by early adoption of advanced automotive technologies and a strong presence of key players. However, the Asia Pacific region is poised for significant growth, fueled by increasing vehicle production and rising consumer demand for technologically advanced vehicles in countries like China and India. The market's growth trajectory is expected to continue, propelled by ongoing technological advancements and the increasing complexity of modern vehicles.
Growth within the AOS market is influenced by several key factors. The escalating demand for enhanced safety features and driver-assistance capabilities drives the adoption of sophisticated OS solutions capable of handling complex data processing and real-time control. Furthermore, the rising popularity of connected cars, with their diverse functionalities and data-intensive applications, necessitates robust and scalable operating systems. However, challenges remain, including the need for stringent cybersecurity measures to protect against potential vulnerabilities and the high cost of development and implementation of advanced OS technologies. Competition among established players and emerging startups is intense, driving innovation and fostering the development of more efficient, secure, and feature-rich automotive operating systems. The ongoing trend toward consolidation and strategic partnerships within the industry will further shape the market landscape in the coming years.
This comprehensive report provides an in-depth analysis of the Automotive Operating Systems market, encompassing market dynamics, growth trends, regional dominance, product landscape, key players, and future outlook. With a study period spanning 2019-2033, a base year of 2025, and a forecast period of 2025-2033, this report offers invaluable insights for industry professionals, investors, and stakeholders. The market is segmented by operating system type (QNX, Linux, Android, Windows, Other), vehicle type (Passenger Cars, Commercial Vehicles), and application type (Infotainment System, ADAS & Safety System, Connected Service, Body Control & Comfort Systems, Engine Management & Powertrain, Other). The parent market is the broader automotive industry, while the child market is specifically the embedded software segment within automotive technology. The total market size is projected to reach xx million units by 2033.
Automotive Operating Systems Market Market Dynamics & Structure
The automotive operating systems market is characterized by moderate concentration, with key players holding significant market share. Technological innovation, particularly in areas like AI, machine learning, and 5G connectivity, is a primary growth driver. Stringent regulatory frameworks concerning vehicle safety and emissions also influence market dynamics. Competitive substitutes, such as legacy embedded systems, are gradually being replaced by more flexible and scalable OS solutions. The end-user demographics encompass OEMs, Tier-1 suppliers, and software developers. M&A activity in this space has been relatively high, with an estimated xx deals in the last 5 years, primarily driven by consolidation and access to specialized technologies.
- Market Concentration: Moderately concentrated, with top 5 players holding approximately xx% market share in 2024.
- Technological Innovation: Focus on AI, autonomous driving, and over-the-air (OTA) updates driving demand for advanced OS capabilities.
- Regulatory Frameworks: Stringent safety and cybersecurity regulations shaping OS development and deployment.
- Competitive Substitutes: Legacy embedded systems facing replacement by modern OS solutions.
- End-User Demographics: OEMs, Tier-1 suppliers, and software developers constitute the primary end-users.
- M&A Trends: xx M&A deals in the last 5 years, indicating consolidation and technology acquisition strategies.
Automotive Operating Systems Market Growth Trends & Insights
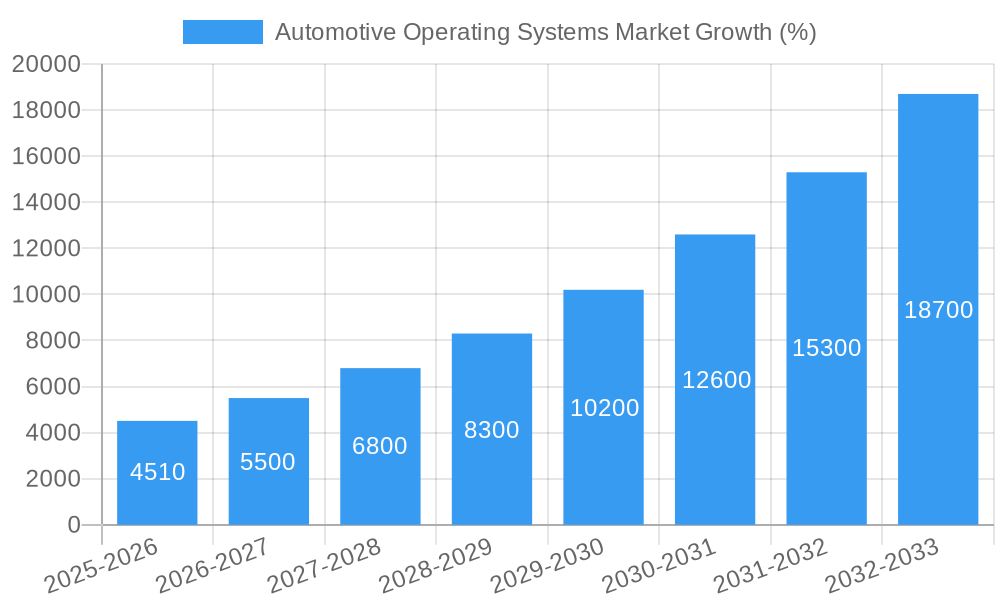
The automotive operating systems market exhibits robust growth, driven by increasing vehicle connectivity, the proliferation of advanced driver-assistance systems (ADAS), and the rise of autonomous vehicles. The market size grew from xx million units in 2019 to xx million units in 2024, registering a CAGR of xx%. This growth is projected to continue, with a forecast CAGR of xx% from 2025 to 2033, reaching xx million units by 2033. Technological disruptions, such as the shift towards software-defined vehicles (SDVs), are accelerating the adoption of advanced operating systems. Consumer preference for enhanced in-vehicle features and connected services further fuel market expansion.
The increasing adoption of electric and autonomous vehicles is a significant growth driver, and the transition to software defined vehicles has significantly increased the market size.
Dominant Regions, Countries, or Segments in Automotive Operating Systems Market
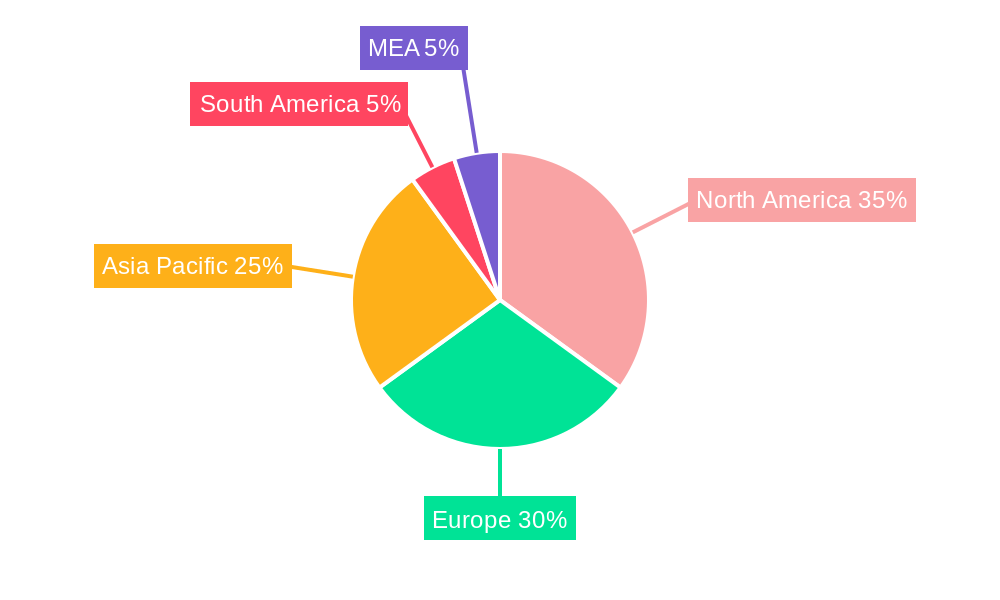
North America currently holds the largest market share, followed by Europe and Asia-Pacific. This dominance is attributed to factors such as high vehicle production rates, early adoption of advanced automotive technologies, and supportive government policies. Within the segment breakdown, the Passenger Cars segment holds a larger market share compared to Commercial Vehicles, driven by high consumer demand. Among Operating System Types, Linux currently dominates due to its open-source nature and flexibility, followed by QNX and Android. In terms of application, infotainment and ADAS/safety systems are the major application segments.
- North America: High vehicle production, early adoption of new technologies, and favorable regulatory environment.
- Europe: Stringent emission regulations driving adoption of electric vehicles and advanced OS.
- Asia-Pacific: Rapidly growing automotive industry and increasing consumer demand for connected cars.
- Passenger Cars: Higher volume compared to commercial vehicles due to greater consumer demand.
- Linux OS: Dominant market share due to open-source nature and flexibility.
- Infotainment & ADAS/Safety Systems: Largest application segments.
Automotive Operating Systems Market Product Landscape
The automotive operating system landscape is marked by continuous innovation, focusing on enhanced security, real-time performance, and scalability. Products are tailored to meet specific vehicle needs, ranging from basic infotainment systems to complex ADAS and autonomous driving applications. Key features include virtualization capabilities, support for multiple communication protocols, and robust safety mechanisms. Unique selling propositions often center on real-time performance, seamless integration with other vehicle systems, and over-the-air update capabilities.
Key Drivers, Barriers & Challenges in Automotive Operating Systems Market
Key Drivers:
- Increasing demand for connected car features.
- Growing adoption of autonomous driving technologies.
- Rise of software-defined vehicles (SDVs).
- Stringent safety and security regulations.
Key Challenges & Restraints:
- High development costs and complexity.
- Ensuring cybersecurity and data privacy.
- Maintaining real-time performance and reliability.
- Integration challenges with legacy systems. This leads to approximately a xx% increase in development time for some projects.
Emerging Opportunities in Automotive Operating Systems Market
- Expansion into developing markets with growing automotive industries.
- Development of specialized OS solutions for electric vehicles and autonomous driving.
- Integration of advanced AI and machine learning capabilities.
- Growth of over-the-air (OTA) software updates.
Growth Accelerators in the Automotive Operating Systems Market Industry
Strategic partnerships between technology companies and automakers are driving significant growth. Technological advancements, like the development of more efficient and secure OS platforms, are accelerating adoption rates. Expansion into new geographic markets and application segments will create further growth opportunities.
Key Players Shaping the Automotive Operating Systems Market Market
- DXC Technology
- BlackBerry Ltd
- Alphabet Inc
- Microsoft Corporation
- Wind River Systems
- Green Hills Software
- Renesas Electronics Corporation
- Nvidia Corporation
- Siemens A
- Luxoft
Notable Milestones in Automotive Operating Systems Market Sector
- May 2023: Red Hat and ETAS partnership to deliver advanced in-vehicle automotive platform.
- January 2023: EPAM Systems launches AosEdge vehicle-to-cloud platform with Renesas.
In-Depth Automotive Operating Systems Market Market Outlook
The automotive operating systems market is poised for continued robust growth, fueled by the ongoing shift toward connected and autonomous vehicles. Strategic partnerships, technological innovations, and expansion into emerging markets will present significant opportunities for market players. The focus on enhanced safety, security, and over-the-air updates will further drive market demand. The market is expected to experience a significant boost due to these developments and will lead to xx% growth over the next 5 years.
Automotive Operating Systems Market Segmentation
-
1. Operating System Type
- 1.1. QNX
- 1.2. Linux
- 1.3. Android
- 1.4. Windows
- 1.5. Other Operating System Types
-
2. Vehicle Type
- 2.1. Passengers Cars
- 2.2. Commercial Vehicles
-
3. Application Type
- 3.1. Infotainment System
- 3.2. ADAS and Safety System
- 3.3. Connected Service
- 3.4. Body Control and Comfort Systems
- 3.5. Engine Management and Powertrain
- 3.6. Other Application Types
Automotive Operating Systems Market Segmentation By Geography
- 1. North America
- 2. Europe
- 3. Asia
- 4. Australia and New Zealand
- 5. Latin America
- 6. Middle East and Africa
Automotive Operating Systems Market REPORT HIGHLIGHTS
| Aspects | Details |
|---|---|
| Study Period | 2019-2033 |
| Base Year | 2024 |
| Estimated Year | 2025 |
| Forecast Period | 2025-2033 |
| Historical Period | 2019-2024 |
| Growth Rate | CAGR of 23.82% from 2019-2033 |
| Segmentation |
|
Table of Contents
- 1. Introduction
- 1.1. Research Scope
- 1.2. Market Segmentation
- 1.3. Research Methodology
- 1.4. Definitions and Assumptions
- 2. Executive Summary
- 2.1. Introduction
- 3. Market Dynamics
- 3.1. Introduction
- 3.2. Market Drivers
- 3.2.1. Increase in demand for connected and autonomous vehicles; Integration of AI and machine learning technologies in automotive systems
- 3.3. Market Restrains
- 3.3.1. Concerns about data privacy and cyber security
- 3.4. Market Trends
- 3.4.1. Increase in demand for connected and autonomous vehicles along with various safety features is expected to drive the market
- 4. Market Factor Analysis
- 4.1. Porters Five Forces
- 4.2. Supply/Value Chain
- 4.3. PESTEL analysis
- 4.4. Market Entropy
- 4.5. Patent/Trademark Analysis
- 5. Global Automotive Operating Systems Market Analysis, Insights and Forecast, 2019-2031
- 5.1. Market Analysis, Insights and Forecast - by Operating System Type
- 5.1.1. QNX
- 5.1.2. Linux
- 5.1.3. Android
- 5.1.4. Windows
- 5.1.5. Other Operating System Types
- 5.2. Market Analysis, Insights and Forecast - by Vehicle Type
- 5.2.1. Passengers Cars
- 5.2.2. Commercial Vehicles
- 5.3. Market Analysis, Insights and Forecast - by Application Type
- 5.3.1. Infotainment System
- 5.3.2. ADAS and Safety System
- 5.3.3. Connected Service
- 5.3.4. Body Control and Comfort Systems
- 5.3.5. Engine Management and Powertrain
- 5.3.6. Other Application Types
- 5.4. Market Analysis, Insights and Forecast - by Region
- 5.4.1. North America
- 5.4.2. Europe
- 5.4.3. Asia
- 5.4.4. Australia and New Zealand
- 5.4.5. Latin America
- 5.4.6. Middle East and Africa
- 5.1. Market Analysis, Insights and Forecast - by Operating System Type
- 6. North America Automotive Operating Systems Market Analysis, Insights and Forecast, 2019-2031
- 6.1. Market Analysis, Insights and Forecast - by Operating System Type
- 6.1.1. QNX
- 6.1.2. Linux
- 6.1.3. Android
- 6.1.4. Windows
- 6.1.5. Other Operating System Types
- 6.2. Market Analysis, Insights and Forecast - by Vehicle Type
- 6.2.1. Passengers Cars
- 6.2.2. Commercial Vehicles
- 6.3. Market Analysis, Insights and Forecast - by Application Type
- 6.3.1. Infotainment System
- 6.3.2. ADAS and Safety System
- 6.3.3. Connected Service
- 6.3.4. Body Control and Comfort Systems
- 6.3.5. Engine Management and Powertrain
- 6.3.6. Other Application Types
- 6.1. Market Analysis, Insights and Forecast - by Operating System Type
- 7. Europe Automotive Operating Systems Market Analysis, Insights and Forecast, 2019-2031
- 7.1. Market Analysis, Insights and Forecast - by Operating System Type
- 7.1.1. QNX
- 7.1.2. Linux
- 7.1.3. Android
- 7.1.4. Windows
- 7.1.5. Other Operating System Types
- 7.2. Market Analysis, Insights and Forecast - by Vehicle Type
- 7.2.1. Passengers Cars
- 7.2.2. Commercial Vehicles
- 7.3. Market Analysis, Insights and Forecast - by Application Type
- 7.3.1. Infotainment System
- 7.3.2. ADAS and Safety System
- 7.3.3. Connected Service
- 7.3.4. Body Control and Comfort Systems
- 7.3.5. Engine Management and Powertrain
- 7.3.6. Other Application Types
- 7.1. Market Analysis, Insights and Forecast - by Operating System Type
- 8. Asia Automotive Operating Systems Market Analysis, Insights and Forecast, 2019-2031
- 8.1. Market Analysis, Insights and Forecast - by Operating System Type
- 8.1.1. QNX
- 8.1.2. Linux
- 8.1.3. Android
- 8.1.4. Windows
- 8.1.5. Other Operating System Types
- 8.2. Market Analysis, Insights and Forecast - by Vehicle Type
- 8.2.1. Passengers Cars
- 8.2.2. Commercial Vehicles
- 8.3. Market Analysis, Insights and Forecast - by Application Type
- 8.3.1. Infotainment System
- 8.3.2. ADAS and Safety System
- 8.3.3. Connected Service
- 8.3.4. Body Control and Comfort Systems
- 8.3.5. Engine Management and Powertrain
- 8.3.6. Other Application Types
- 8.1. Market Analysis, Insights and Forecast - by Operating System Type
- 9. Australia and New Zealand Automotive Operating Systems Market Analysis, Insights and Forecast, 2019-2031
- 9.1. Market Analysis, Insights and Forecast - by Operating System Type
- 9.1.1. QNX
- 9.1.2. Linux
- 9.1.3. Android
- 9.1.4. Windows
- 9.1.5. Other Operating System Types
- 9.2. Market Analysis, Insights and Forecast - by Vehicle Type
- 9.2.1. Passengers Cars
- 9.2.2. Commercial Vehicles
- 9.3. Market Analysis, Insights and Forecast - by Application Type
- 9.3.1. Infotainment System
- 9.3.2. ADAS and Safety System
- 9.3.3. Connected Service
- 9.3.4. Body Control and Comfort Systems
- 9.3.5. Engine Management and Powertrain
- 9.3.6. Other Application Types
- 9.1. Market Analysis, Insights and Forecast - by Operating System Type
- 10. Latin America Automotive Operating Systems Market Analysis, Insights and Forecast, 2019-2031
- 10.1. Market Analysis, Insights and Forecast - by Operating System Type
- 10.1.1. QNX
- 10.1.2. Linux
- 10.1.3. Android
- 10.1.4. Windows
- 10.1.5. Other Operating System Types
- 10.2. Market Analysis, Insights and Forecast - by Vehicle Type
- 10.2.1. Passengers Cars
- 10.2.2. Commercial Vehicles
- 10.3. Market Analysis, Insights and Forecast - by Application Type
- 10.3.1. Infotainment System
- 10.3.2. ADAS and Safety System
- 10.3.3. Connected Service
- 10.3.4. Body Control and Comfort Systems
- 10.3.5. Engine Management and Powertrain
- 10.3.6. Other Application Types
- 10.1. Market Analysis, Insights and Forecast - by Operating System Type
- 11. Middle East and Africa Automotive Operating Systems Market Analysis, Insights and Forecast, 2019-2031
- 11.1. Market Analysis, Insights and Forecast - by Operating System Type
- 11.1.1. QNX
- 11.1.2. Linux
- 11.1.3. Android
- 11.1.4. Windows
- 11.1.5. Other Operating System Types
- 11.2. Market Analysis, Insights and Forecast - by Vehicle Type
- 11.2.1. Passengers Cars
- 11.2.2. Commercial Vehicles
- 11.3. Market Analysis, Insights and Forecast - by Application Type
- 11.3.1. Infotainment System
- 11.3.2. ADAS and Safety System
- 11.3.3. Connected Service
- 11.3.4. Body Control and Comfort Systems
- 11.3.5. Engine Management and Powertrain
- 11.3.6. Other Application Types
- 11.1. Market Analysis, Insights and Forecast - by Operating System Type
- 12. North America Automotive Operating Systems Market Analysis, Insights and Forecast, 2019-2031
- 12.1. Market Analysis, Insights and Forecast - By Country/Sub-region
- 12.1.1 United States
- 12.1.2 Canada
- 12.1.3 Mexico
- 13. Europe Automotive Operating Systems Market Analysis, Insights and Forecast, 2019-2031
- 13.1. Market Analysis, Insights and Forecast - By Country/Sub-region
- 13.1.1 Germany
- 13.1.2 United Kingdom
- 13.1.3 France
- 13.1.4 Spain
- 13.1.5 Italy
- 13.1.6 Spain
- 13.1.7 Belgium
- 13.1.8 Netherland
- 13.1.9 Nordics
- 13.1.10 Rest of Europe
- 14. Asia Pacific Automotive Operating Systems Market Analysis, Insights and Forecast, 2019-2031
- 14.1. Market Analysis, Insights and Forecast - By Country/Sub-region
- 14.1.1 China
- 14.1.2 Japan
- 14.1.3 India
- 14.1.4 South Korea
- 14.1.5 Southeast Asia
- 14.1.6 Australia
- 14.1.7 Indonesia
- 14.1.8 Phillipes
- 14.1.9 Singapore
- 14.1.10 Thailandc
- 14.1.11 Rest of Asia Pacific
- 15. South America Automotive Operating Systems Market Analysis, Insights and Forecast, 2019-2031
- 15.1. Market Analysis, Insights and Forecast - By Country/Sub-region
- 15.1.1 Brazil
- 15.1.2 Argentina
- 15.1.3 Peru
- 15.1.4 Chile
- 15.1.5 Colombia
- 15.1.6 Ecuador
- 15.1.7 Venezuela
- 15.1.8 Rest of South America
- 16. North America Automotive Operating Systems Market Analysis, Insights and Forecast, 2019-2031
- 16.1. Market Analysis, Insights and Forecast - By Country/Sub-region
- 16.1.1 United States
- 16.1.2 Canada
- 16.1.3 Mexico
- 17. MEA Automotive Operating Systems Market Analysis, Insights and Forecast, 2019-2031
- 17.1. Market Analysis, Insights and Forecast - By Country/Sub-region
- 17.1.1 United Arab Emirates
- 17.1.2 Saudi Arabia
- 17.1.3 South Africa
- 17.1.4 Rest of Middle East and Africa
- 18. Competitive Analysis
- 18.1. Global Market Share Analysis 2024
- 18.2. Company Profiles
- 18.2.1 DXC Technology
- 18.2.1.1. Overview
- 18.2.1.2. Products
- 18.2.1.3. SWOT Analysis
- 18.2.1.4. Recent Developments
- 18.2.1.5. Financials (Based on Availability)
- 18.2.2 BlackBerry Ltd
- 18.2.2.1. Overview
- 18.2.2.2. Products
- 18.2.2.3. SWOT Analysis
- 18.2.2.4. Recent Developments
- 18.2.2.5. Financials (Based on Availability)
- 18.2.3 Alphabet Inc
- 18.2.3.1. Overview
- 18.2.3.2. Products
- 18.2.3.3. SWOT Analysis
- 18.2.3.4. Recent Developments
- 18.2.3.5. Financials (Based on Availability)
- 18.2.4 Microsoft Corporation
- 18.2.4.1. Overview
- 18.2.4.2. Products
- 18.2.4.3. SWOT Analysis
- 18.2.4.4. Recent Developments
- 18.2.4.5. Financials (Based on Availability)
- 18.2.5 Wind River Systems
- 18.2.5.1. Overview
- 18.2.5.2. Products
- 18.2.5.3. SWOT Analysis
- 18.2.5.4. Recent Developments
- 18.2.5.5. Financials (Based on Availability)
- 18.2.6 Green Hills Software
- 18.2.6.1. Overview
- 18.2.6.2. Products
- 18.2.6.3. SWOT Analysis
- 18.2.6.4. Recent Developments
- 18.2.6.5. Financials (Based on Availability)
- 18.2.7 Renesas Electronics Corporation
- 18.2.7.1. Overview
- 18.2.7.2. Products
- 18.2.7.3. SWOT Analysis
- 18.2.7.4. Recent Developments
- 18.2.7.5. Financials (Based on Availability)
- 18.2.8 Nvidia Corporation
- 18.2.8.1. Overview
- 18.2.8.2. Products
- 18.2.8.3. SWOT Analysis
- 18.2.8.4. Recent Developments
- 18.2.8.5. Financials (Based on Availability)
- 18.2.9 Siemens A
- 18.2.9.1. Overview
- 18.2.9.2. Products
- 18.2.9.3. SWOT Analysis
- 18.2.9.4. Recent Developments
- 18.2.9.5. Financials (Based on Availability)
- 18.2.10 Luxoft
- 18.2.10.1. Overview
- 18.2.10.2. Products
- 18.2.10.3. SWOT Analysis
- 18.2.10.4. Recent Developments
- 18.2.10.5. Financials (Based on Availability)
- 18.2.1 DXC Technology
List of Figures
- Figure 1: Global Automotive Operating Systems Market Revenue Breakdown (Million, %) by Region 2024 & 2032
- Figure 2: Global Automotive Operating Systems Market Volume Breakdown (K Unit, %) by Region 2024 & 2032
- Figure 3: North America Automotive Operating Systems Market Revenue (Million), by Country 2024 & 2032
- Figure 4: North America Automotive Operating Systems Market Volume (K Unit), by Country 2024 & 2032
- Figure 5: North America Automotive Operating Systems Market Revenue Share (%), by Country 2024 & 2032
- Figure 6: North America Automotive Operating Systems Market Volume Share (%), by Country 2024 & 2032
- Figure 7: Europe Automotive Operating Systems Market Revenue (Million), by Country 2024 & 2032
- Figure 8: Europe Automotive Operating Systems Market Volume (K Unit), by Country 2024 & 2032
- Figure 9: Europe Automotive Operating Systems Market Revenue Share (%), by Country 2024 & 2032
- Figure 10: Europe Automotive Operating Systems Market Volume Share (%), by Country 2024 & 2032
- Figure 11: Asia Pacific Automotive Operating Systems Market Revenue (Million), by Country 2024 & 2032
- Figure 12: Asia Pacific Automotive Operating Systems Market Volume (K Unit), by Country 2024 & 2032
- Figure 13: Asia Pacific Automotive Operating Systems Market Revenue Share (%), by Country 2024 & 2032
- Figure 14: Asia Pacific Automotive Operating Systems Market Volume Share (%), by Country 2024 & 2032
- Figure 15: South America Automotive Operating Systems Market Revenue (Million), by Country 2024 & 2032
- Figure 16: South America Automotive Operating Systems Market Volume (K Unit), by Country 2024 & 2032
- Figure 17: South America Automotive Operating Systems Market Revenue Share (%), by Country 2024 & 2032
- Figure 18: South America Automotive Operating Systems Market Volume Share (%), by Country 2024 & 2032
- Figure 19: North America Automotive Operating Systems Market Revenue (Million), by Country 2024 & 2032
- Figure 20: North America Automotive Operating Systems Market Volume (K Unit), by Country 2024 & 2032
- Figure 21: North America Automotive Operating Systems Market Revenue Share (%), by Country 2024 & 2032
- Figure 22: North America Automotive Operating Systems Market Volume Share (%), by Country 2024 & 2032
- Figure 23: MEA Automotive Operating Systems Market Revenue (Million), by Country 2024 & 2032
- Figure 24: MEA Automotive Operating Systems Market Volume (K Unit), by Country 2024 & 2032
- Figure 25: MEA Automotive Operating Systems Market Revenue Share (%), by Country 2024 & 2032
- Figure 26: MEA Automotive Operating Systems Market Volume Share (%), by Country 2024 & 2032
- Figure 27: North America Automotive Operating Systems Market Revenue (Million), by Operating System Type 2024 & 2032
- Figure 28: North America Automotive Operating Systems Market Volume (K Unit), by Operating System Type 2024 & 2032
- Figure 29: North America Automotive Operating Systems Market Revenue Share (%), by Operating System Type 2024 & 2032
- Figure 30: North America Automotive Operating Systems Market Volume Share (%), by Operating System Type 2024 & 2032
- Figure 31: North America Automotive Operating Systems Market Revenue (Million), by Vehicle Type 2024 & 2032
- Figure 32: North America Automotive Operating Systems Market Volume (K Unit), by Vehicle Type 2024 & 2032
- Figure 33: North America Automotive Operating Systems Market Revenue Share (%), by Vehicle Type 2024 & 2032
- Figure 34: North America Automotive Operating Systems Market Volume Share (%), by Vehicle Type 2024 & 2032
- Figure 35: North America Automotive Operating Systems Market Revenue (Million), by Application Type 2024 & 2032
- Figure 36: North America Automotive Operating Systems Market Volume (K Unit), by Application Type 2024 & 2032
- Figure 37: North America Automotive Operating Systems Market Revenue Share (%), by Application Type 2024 & 2032
- Figure 38: North America Automotive Operating Systems Market Volume Share (%), by Application Type 2024 & 2032
- Figure 39: North America Automotive Operating Systems Market Revenue (Million), by Country 2024 & 2032
- Figure 40: North America Automotive Operating Systems Market Volume (K Unit), by Country 2024 & 2032
- Figure 41: North America Automotive Operating Systems Market Revenue Share (%), by Country 2024 & 2032
- Figure 42: North America Automotive Operating Systems Market Volume Share (%), by Country 2024 & 2032
- Figure 43: Europe Automotive Operating Systems Market Revenue (Million), by Operating System Type 2024 & 2032
- Figure 44: Europe Automotive Operating Systems Market Volume (K Unit), by Operating System Type 2024 & 2032
- Figure 45: Europe Automotive Operating Systems Market Revenue Share (%), by Operating System Type 2024 & 2032
- Figure 46: Europe Automotive Operating Systems Market Volume Share (%), by Operating System Type 2024 & 2032
- Figure 47: Europe Automotive Operating Systems Market Revenue (Million), by Vehicle Type 2024 & 2032
- Figure 48: Europe Automotive Operating Systems Market Volume (K Unit), by Vehicle Type 2024 & 2032
- Figure 49: Europe Automotive Operating Systems Market Revenue Share (%), by Vehicle Type 2024 & 2032
- Figure 50: Europe Automotive Operating Systems Market Volume Share (%), by Vehicle Type 2024 & 2032
- Figure 51: Europe Automotive Operating Systems Market Revenue (Million), by Application Type 2024 & 2032
- Figure 52: Europe Automotive Operating Systems Market Volume (K Unit), by Application Type 2024 & 2032
- Figure 53: Europe Automotive Operating Systems Market Revenue Share (%), by Application Type 2024 & 2032
- Figure 54: Europe Automotive Operating Systems Market Volume Share (%), by Application Type 2024 & 2032
- Figure 55: Europe Automotive Operating Systems Market Revenue (Million), by Country 2024 & 2032
- Figure 56: Europe Automotive Operating Systems Market Volume (K Unit), by Country 2024 & 2032
- Figure 57: Europe Automotive Operating Systems Market Revenue Share (%), by Country 2024 & 2032
- Figure 58: Europe Automotive Operating Systems Market Volume Share (%), by Country 2024 & 2032
- Figure 59: Asia Automotive Operating Systems Market Revenue (Million), by Operating System Type 2024 & 2032
- Figure 60: Asia Automotive Operating Systems Market Volume (K Unit), by Operating System Type 2024 & 2032
- Figure 61: Asia Automotive Operating Systems Market Revenue Share (%), by Operating System Type 2024 & 2032
- Figure 62: Asia Automotive Operating Systems Market Volume Share (%), by Operating System Type 2024 & 2032
- Figure 63: Asia Automotive Operating Systems Market Revenue (Million), by Vehicle Type 2024 & 2032
- Figure 64: Asia Automotive Operating Systems Market Volume (K Unit), by Vehicle Type 2024 & 2032
- Figure 65: Asia Automotive Operating Systems Market Revenue Share (%), by Vehicle Type 2024 & 2032
- Figure 66: Asia Automotive Operating Systems Market Volume Share (%), by Vehicle Type 2024 & 2032
- Figure 67: Asia Automotive Operating Systems Market Revenue (Million), by Application Type 2024 & 2032
- Figure 68: Asia Automotive Operating Systems Market Volume (K Unit), by Application Type 2024 & 2032
- Figure 69: Asia Automotive Operating Systems Market Revenue Share (%), by Application Type 2024 & 2032
- Figure 70: Asia Automotive Operating Systems Market Volume Share (%), by Application Type 2024 & 2032
- Figure 71: Asia Automotive Operating Systems Market Revenue (Million), by Country 2024 & 2032
- Figure 72: Asia Automotive Operating Systems Market Volume (K Unit), by Country 2024 & 2032
- Figure 73: Asia Automotive Operating Systems Market Revenue Share (%), by Country 2024 & 2032
- Figure 74: Asia Automotive Operating Systems Market Volume Share (%), by Country 2024 & 2032
- Figure 75: Australia and New Zealand Automotive Operating Systems Market Revenue (Million), by Operating System Type 2024 & 2032
- Figure 76: Australia and New Zealand Automotive Operating Systems Market Volume (K Unit), by Operating System Type 2024 & 2032
- Figure 77: Australia and New Zealand Automotive Operating Systems Market Revenue Share (%), by Operating System Type 2024 & 2032
- Figure 78: Australia and New Zealand Automotive Operating Systems Market Volume Share (%), by Operating System Type 2024 & 2032
- Figure 79: Australia and New Zealand Automotive Operating Systems Market Revenue (Million), by Vehicle Type 2024 & 2032
- Figure 80: Australia and New Zealand Automotive Operating Systems Market Volume (K Unit), by Vehicle Type 2024 & 2032
- Figure 81: Australia and New Zealand Automotive Operating Systems Market Revenue Share (%), by Vehicle Type 2024 & 2032
- Figure 82: Australia and New Zealand Automotive Operating Systems Market Volume Share (%), by Vehicle Type 2024 & 2032
- Figure 83: Australia and New Zealand Automotive Operating Systems Market Revenue (Million), by Application Type 2024 & 2032
- Figure 84: Australia and New Zealand Automotive Operating Systems Market Volume (K Unit), by Application Type 2024 & 2032
- Figure 85: Australia and New Zealand Automotive Operating Systems Market Revenue Share (%), by Application Type 2024 & 2032
- Figure 86: Australia and New Zealand Automotive Operating Systems Market Volume Share (%), by Application Type 2024 & 2032
- Figure 87: Australia and New Zealand Automotive Operating Systems Market Revenue (Million), by Country 2024 & 2032
- Figure 88: Australia and New Zealand Automotive Operating Systems Market Volume (K Unit), by Country 2024 & 2032
- Figure 89: Australia and New Zealand Automotive Operating Systems Market Revenue Share (%), by Country 2024 & 2032
- Figure 90: Australia and New Zealand Automotive Operating Systems Market Volume Share (%), by Country 2024 & 2032
- Figure 91: Latin America Automotive Operating Systems Market Revenue (Million), by Operating System Type 2024 & 2032
- Figure 92: Latin America Automotive Operating Systems Market Volume (K Unit), by Operating System Type 2024 & 2032
- Figure 93: Latin America Automotive Operating Systems Market Revenue Share (%), by Operating System Type 2024 & 2032
- Figure 94: Latin America Automotive Operating Systems Market Volume Share (%), by Operating System Type 2024 & 2032
- Figure 95: Latin America Automotive Operating Systems Market Revenue (Million), by Vehicle Type 2024 & 2032
- Figure 96: Latin America Automotive Operating Systems Market Volume (K Unit), by Vehicle Type 2024 & 2032
- Figure 97: Latin America Automotive Operating Systems Market Revenue Share (%), by Vehicle Type 2024 & 2032
- Figure 98: Latin America Automotive Operating Systems Market Volume Share (%), by Vehicle Type 2024 & 2032
- Figure 99: Latin America Automotive Operating Systems Market Revenue (Million), by Application Type 2024 & 2032
- Figure 100: Latin America Automotive Operating Systems Market Volume (K Unit), by Application Type 2024 & 2032
- Figure 101: Latin America Automotive Operating Systems Market Revenue Share (%), by Application Type 2024 & 2032
- Figure 102: Latin America Automotive Operating Systems Market Volume Share (%), by Application Type 2024 & 2032
- Figure 103: Latin America Automotive Operating Systems Market Revenue (Million), by Country 2024 & 2032
- Figure 104: Latin America Automotive Operating Systems Market Volume (K Unit), by Country 2024 & 2032
- Figure 105: Latin America Automotive Operating Systems Market Revenue Share (%), by Country 2024 & 2032
- Figure 106: Latin America Automotive Operating Systems Market Volume Share (%), by Country 2024 & 2032
- Figure 107: Middle East and Africa Automotive Operating Systems Market Revenue (Million), by Operating System Type 2024 & 2032
- Figure 108: Middle East and Africa Automotive Operating Systems Market Volume (K Unit), by Operating System Type 2024 & 2032
- Figure 109: Middle East and Africa Automotive Operating Systems Market Revenue Share (%), by Operating System Type 2024 & 2032
- Figure 110: Middle East and Africa Automotive Operating Systems Market Volume Share (%), by Operating System Type 2024 & 2032
- Figure 111: Middle East and Africa Automotive Operating Systems Market Revenue (Million), by Vehicle Type 2024 & 2032
- Figure 112: Middle East and Africa Automotive Operating Systems Market Volume (K Unit), by Vehicle Type 2024 & 2032
- Figure 113: Middle East and Africa Automotive Operating Systems Market Revenue Share (%), by Vehicle Type 2024 & 2032
- Figure 114: Middle East and Africa Automotive Operating Systems Market Volume Share (%), by Vehicle Type 2024 & 2032
- Figure 115: Middle East and Africa Automotive Operating Systems Market Revenue (Million), by Application Type 2024 & 2032
- Figure 116: Middle East and Africa Automotive Operating Systems Market Volume (K Unit), by Application Type 2024 & 2032
- Figure 117: Middle East and Africa Automotive Operating Systems Market Revenue Share (%), by Application Type 2024 & 2032
- Figure 118: Middle East and Africa Automotive Operating Systems Market Volume Share (%), by Application Type 2024 & 2032
- Figure 119: Middle East and Africa Automotive Operating Systems Market Revenue (Million), by Country 2024 & 2032
- Figure 120: Middle East and Africa Automotive Operating Systems Market Volume (K Unit), by Country 2024 & 2032
- Figure 121: Middle East and Africa Automotive Operating Systems Market Revenue Share (%), by Country 2024 & 2032
- Figure 122: Middle East and Africa Automotive Operating Systems Market Volume Share (%), by Country 2024 & 2032
List of Tables
- Table 1: Global Automotive Operating Systems Market Revenue Million Forecast, by Region 2019 & 2032
- Table 2: Global Automotive Operating Systems Market Volume K Unit Forecast, by Region 2019 & 2032
- Table 3: Global Automotive Operating Systems Market Revenue Million Forecast, by Operating System Type 2019 & 2032
- Table 4: Global Automotive Operating Systems Market Volume K Unit Forecast, by Operating System Type 2019 & 2032
- Table 5: Global Automotive Operating Systems Market Revenue Million Forecast, by Vehicle Type 2019 & 2032
- Table 6: Global Automotive Operating Systems Market Volume K Unit Forecast, by Vehicle Type 2019 & 2032
- Table 7: Global Automotive Operating Systems Market Revenue Million Forecast, by Application Type 2019 & 2032
- Table 8: Global Automotive Operating Systems Market Volume K Unit Forecast, by Application Type 2019 & 2032
- Table 9: Global Automotive Operating Systems Market Revenue Million Forecast, by Region 2019 & 2032
- Table 10: Global Automotive Operating Systems Market Volume K Unit Forecast, by Region 2019 & 2032
- Table 11: Global Automotive Operating Systems Market Revenue Million Forecast, by Country 2019 & 2032
- Table 12: Global Automotive Operating Systems Market Volume K Unit Forecast, by Country 2019 & 2032
- Table 13: United States Automotive Operating Systems Market Revenue (Million) Forecast, by Application 2019 & 2032
- Table 14: United States Automotive Operating Systems Market Volume (K Unit) Forecast, by Application 2019 & 2032
- Table 15: Canada Automotive Operating Systems Market Revenue (Million) Forecast, by Application 2019 & 2032
- Table 16: Canada Automotive Operating Systems Market Volume (K Unit) Forecast, by Application 2019 & 2032
- Table 17: Mexico Automotive Operating Systems Market Revenue (Million) Forecast, by Application 2019 & 2032
- Table 18: Mexico Automotive Operating Systems Market Volume (K Unit) Forecast, by Application 2019 & 2032
- Table 19: Global Automotive Operating Systems Market Revenue Million Forecast, by Country 2019 & 2032
- Table 20: Global Automotive Operating Systems Market Volume K Unit Forecast, by Country 2019 & 2032
- Table 21: Germany Automotive Operating Systems Market Revenue (Million) Forecast, by Application 2019 & 2032
- Table 22: Germany Automotive Operating Systems Market Volume (K Unit) Forecast, by Application 2019 & 2032
- Table 23: United Kingdom Automotive Operating Systems Market Revenue (Million) Forecast, by Application 2019 & 2032
- Table 24: United Kingdom Automotive Operating Systems Market Volume (K Unit) Forecast, by Application 2019 & 2032
- Table 25: France Automotive Operating Systems Market Revenue (Million) Forecast, by Application 2019 & 2032
- Table 26: France Automotive Operating Systems Market Volume (K Unit) Forecast, by Application 2019 & 2032
- Table 27: Spain Automotive Operating Systems Market Revenue (Million) Forecast, by Application 2019 & 2032
- Table 28: Spain Automotive Operating Systems Market Volume (K Unit) Forecast, by Application 2019 & 2032
- Table 29: Italy Automotive Operating Systems Market Revenue (Million) Forecast, by Application 2019 & 2032
- Table 30: Italy Automotive Operating Systems Market Volume (K Unit) Forecast, by Application 2019 & 2032
- Table 31: Spain Automotive Operating Systems Market Revenue (Million) Forecast, by Application 2019 & 2032
- Table 32: Spain Automotive Operating Systems Market Volume (K Unit) Forecast, by Application 2019 & 2032
- Table 33: Belgium Automotive Operating Systems Market Revenue (Million) Forecast, by Application 2019 & 2032
- Table 34: Belgium Automotive Operating Systems Market Volume (K Unit) Forecast, by Application 2019 & 2032
- Table 35: Netherland Automotive Operating Systems Market Revenue (Million) Forecast, by Application 2019 & 2032
- Table 36: Netherland Automotive Operating Systems Market Volume (K Unit) Forecast, by Application 2019 & 2032
- Table 37: Nordics Automotive Operating Systems Market Revenue (Million) Forecast, by Application 2019 & 2032
- Table 38: Nordics Automotive Operating Systems Market Volume (K Unit) Forecast, by Application 2019 & 2032
- Table 39: Rest of Europe Automotive Operating Systems Market Revenue (Million) Forecast, by Application 2019 & 2032
- Table 40: Rest of Europe Automotive Operating Systems Market Volume (K Unit) Forecast, by Application 2019 & 2032
- Table 41: Global Automotive Operating Systems Market Revenue Million Forecast, by Country 2019 & 2032
- Table 42: Global Automotive Operating Systems Market Volume K Unit Forecast, by Country 2019 & 2032
- Table 43: China Automotive Operating Systems Market Revenue (Million) Forecast, by Application 2019 & 2032
- Table 44: China Automotive Operating Systems Market Volume (K Unit) Forecast, by Application 2019 & 2032
- Table 45: Japan Automotive Operating Systems Market Revenue (Million) Forecast, by Application 2019 & 2032
- Table 46: Japan Automotive Operating Systems Market Volume (K Unit) Forecast, by Application 2019 & 2032
- Table 47: India Automotive Operating Systems Market Revenue (Million) Forecast, by Application 2019 & 2032
- Table 48: India Automotive Operating Systems Market Volume (K Unit) Forecast, by Application 2019 & 2032
- Table 49: South Korea Automotive Operating Systems Market Revenue (Million) Forecast, by Application 2019 & 2032
- Table 50: South Korea Automotive Operating Systems Market Volume (K Unit) Forecast, by Application 2019 & 2032
- Table 51: Southeast Asia Automotive Operating Systems Market Revenue (Million) Forecast, by Application 2019 & 2032
- Table 52: Southeast Asia Automotive Operating Systems Market Volume (K Unit) Forecast, by Application 2019 & 2032
- Table 53: Australia Automotive Operating Systems Market Revenue (Million) Forecast, by Application 2019 & 2032
- Table 54: Australia Automotive Operating Systems Market Volume (K Unit) Forecast, by Application 2019 & 2032
- Table 55: Indonesia Automotive Operating Systems Market Revenue (Million) Forecast, by Application 2019 & 2032
- Table 56: Indonesia Automotive Operating Systems Market Volume (K Unit) Forecast, by Application 2019 & 2032
- Table 57: Phillipes Automotive Operating Systems Market Revenue (Million) Forecast, by Application 2019 & 2032
- Table 58: Phillipes Automotive Operating Systems Market Volume (K Unit) Forecast, by Application 2019 & 2032
- Table 59: Singapore Automotive Operating Systems Market Revenue (Million) Forecast, by Application 2019 & 2032
- Table 60: Singapore Automotive Operating Systems Market Volume (K Unit) Forecast, by Application 2019 & 2032
- Table 61: Thailandc Automotive Operating Systems Market Revenue (Million) Forecast, by Application 2019 & 2032
- Table 62: Thailandc Automotive Operating Systems Market Volume (K Unit) Forecast, by Application 2019 & 2032
- Table 63: Rest of Asia Pacific Automotive Operating Systems Market Revenue (Million) Forecast, by Application 2019 & 2032
- Table 64: Rest of Asia Pacific Automotive Operating Systems Market Volume (K Unit) Forecast, by Application 2019 & 2032
- Table 65: Global Automotive Operating Systems Market Revenue Million Forecast, by Country 2019 & 2032
- Table 66: Global Automotive Operating Systems Market Volume K Unit Forecast, by Country 2019 & 2032
- Table 67: Brazil Automotive Operating Systems Market Revenue (Million) Forecast, by Application 2019 & 2032
- Table 68: Brazil Automotive Operating Systems Market Volume (K Unit) Forecast, by Application 2019 & 2032
- Table 69: Argentina Automotive Operating Systems Market Revenue (Million) Forecast, by Application 2019 & 2032
- Table 70: Argentina Automotive Operating Systems Market Volume (K Unit) Forecast, by Application 2019 & 2032
- Table 71: Peru Automotive Operating Systems Market Revenue (Million) Forecast, by Application 2019 & 2032
- Table 72: Peru Automotive Operating Systems Market Volume (K Unit) Forecast, by Application 2019 & 2032
- Table 73: Chile Automotive Operating Systems Market Revenue (Million) Forecast, by Application 2019 & 2032
- Table 74: Chile Automotive Operating Systems Market Volume (K Unit) Forecast, by Application 2019 & 2032
- Table 75: Colombia Automotive Operating Systems Market Revenue (Million) Forecast, by Application 2019 & 2032
- Table 76: Colombia Automotive Operating Systems Market Volume (K Unit) Forecast, by Application 2019 & 2032
- Table 77: Ecuador Automotive Operating Systems Market Revenue (Million) Forecast, by Application 2019 & 2032
- Table 78: Ecuador Automotive Operating Systems Market Volume (K Unit) Forecast, by Application 2019 & 2032
- Table 79: Venezuela Automotive Operating Systems Market Revenue (Million) Forecast, by Application 2019 & 2032
- Table 80: Venezuela Automotive Operating Systems Market Volume (K Unit) Forecast, by Application 2019 & 2032
- Table 81: Rest of South America Automotive Operating Systems Market Revenue (Million) Forecast, by Application 2019 & 2032
- Table 82: Rest of South America Automotive Operating Systems Market Volume (K Unit) Forecast, by Application 2019 & 2032
- Table 83: Global Automotive Operating Systems Market Revenue Million Forecast, by Country 2019 & 2032
- Table 84: Global Automotive Operating Systems Market Volume K Unit Forecast, by Country 2019 & 2032
- Table 85: United States Automotive Operating Systems Market Revenue (Million) Forecast, by Application 2019 & 2032
- Table 86: United States Automotive Operating Systems Market Volume (K Unit) Forecast, by Application 2019 & 2032
- Table 87: Canada Automotive Operating Systems Market Revenue (Million) Forecast, by Application 2019 & 2032
- Table 88: Canada Automotive Operating Systems Market Volume (K Unit) Forecast, by Application 2019 & 2032
- Table 89: Mexico Automotive Operating Systems Market Revenue (Million) Forecast, by Application 2019 & 2032
- Table 90: Mexico Automotive Operating Systems Market Volume (K Unit) Forecast, by Application 2019 & 2032
- Table 91: Global Automotive Operating Systems Market Revenue Million Forecast, by Country 2019 & 2032
- Table 92: Global Automotive Operating Systems Market Volume K Unit Forecast, by Country 2019 & 2032
- Table 93: United Arab Emirates Automotive Operating Systems Market Revenue (Million) Forecast, by Application 2019 & 2032
- Table 94: United Arab Emirates Automotive Operating Systems Market Volume (K Unit) Forecast, by Application 2019 & 2032
- Table 95: Saudi Arabia Automotive Operating Systems Market Revenue (Million) Forecast, by Application 2019 & 2032
- Table 96: Saudi Arabia Automotive Operating Systems Market Volume (K Unit) Forecast, by Application 2019 & 2032
- Table 97: South Africa Automotive Operating Systems Market Revenue (Million) Forecast, by Application 2019 & 2032
- Table 98: South Africa Automotive Operating Systems Market Volume (K Unit) Forecast, by Application 2019 & 2032
- Table 99: Rest of Middle East and Africa Automotive Operating Systems Market Revenue (Million) Forecast, by Application 2019 & 2032
- Table 100: Rest of Middle East and Africa Automotive Operating Systems Market Volume (K Unit) Forecast, by Application 2019 & 2032
- Table 101: Global Automotive Operating Systems Market Revenue Million Forecast, by Operating System Type 2019 & 2032
- Table 102: Global Automotive Operating Systems Market Volume K Unit Forecast, by Operating System Type 2019 & 2032
- Table 103: Global Automotive Operating Systems Market Revenue Million Forecast, by Vehicle Type 2019 & 2032
- Table 104: Global Automotive Operating Systems Market Volume K Unit Forecast, by Vehicle Type 2019 & 2032
- Table 105: Global Automotive Operating Systems Market Revenue Million Forecast, by Application Type 2019 & 2032
- Table 106: Global Automotive Operating Systems Market Volume K Unit Forecast, by Application Type 2019 & 2032
- Table 107: Global Automotive Operating Systems Market Revenue Million Forecast, by Country 2019 & 2032
- Table 108: Global Automotive Operating Systems Market Volume K Unit Forecast, by Country 2019 & 2032
- Table 109: Global Automotive Operating Systems Market Revenue Million Forecast, by Operating System Type 2019 & 2032
- Table 110: Global Automotive Operating Systems Market Volume K Unit Forecast, by Operating System Type 2019 & 2032
- Table 111: Global Automotive Operating Systems Market Revenue Million Forecast, by Vehicle Type 2019 & 2032
- Table 112: Global Automotive Operating Systems Market Volume K Unit Forecast, by Vehicle Type 2019 & 2032
- Table 113: Global Automotive Operating Systems Market Revenue Million Forecast, by Application Type 2019 & 2032
- Table 114: Global Automotive Operating Systems Market Volume K Unit Forecast, by Application Type 2019 & 2032
- Table 115: Global Automotive Operating Systems Market Revenue Million Forecast, by Country 2019 & 2032
- Table 116: Global Automotive Operating Systems Market Volume K Unit Forecast, by Country 2019 & 2032
- Table 117: Global Automotive Operating Systems Market Revenue Million Forecast, by Operating System Type 2019 & 2032
- Table 118: Global Automotive Operating Systems Market Volume K Unit Forecast, by Operating System Type 2019 & 2032
- Table 119: Global Automotive Operating Systems Market Revenue Million Forecast, by Vehicle Type 2019 & 2032
- Table 120: Global Automotive Operating Systems Market Volume K Unit Forecast, by Vehicle Type 2019 & 2032
- Table 121: Global Automotive Operating Systems Market Revenue Million Forecast, by Application Type 2019 & 2032
- Table 122: Global Automotive Operating Systems Market Volume K Unit Forecast, by Application Type 2019 & 2032
- Table 123: Global Automotive Operating Systems Market Revenue Million Forecast, by Country 2019 & 2032
- Table 124: Global Automotive Operating Systems Market Volume K Unit Forecast, by Country 2019 & 2032
- Table 125: Global Automotive Operating Systems Market Revenue Million Forecast, by Operating System Type 2019 & 2032
- Table 126: Global Automotive Operating Systems Market Volume K Unit Forecast, by Operating System Type 2019 & 2032
- Table 127: Global Automotive Operating Systems Market Revenue Million Forecast, by Vehicle Type 2019 & 2032
- Table 128: Global Automotive Operating Systems Market Volume K Unit Forecast, by Vehicle Type 2019 & 2032
- Table 129: Global Automotive Operating Systems Market Revenue Million Forecast, by Application Type 2019 & 2032
- Table 130: Global Automotive Operating Systems Market Volume K Unit Forecast, by Application Type 2019 & 2032
- Table 131: Global Automotive Operating Systems Market Revenue Million Forecast, by Country 2019 & 2032
- Table 132: Global Automotive Operating Systems Market Volume K Unit Forecast, by Country 2019 & 2032
- Table 133: Global Automotive Operating Systems Market Revenue Million Forecast, by Operating System Type 2019 & 2032
- Table 134: Global Automotive Operating Systems Market Volume K Unit Forecast, by Operating System Type 2019 & 2032
- Table 135: Global Automotive Operating Systems Market Revenue Million Forecast, by Vehicle Type 2019 & 2032
- Table 136: Global Automotive Operating Systems Market Volume K Unit Forecast, by Vehicle Type 2019 & 2032
- Table 137: Global Automotive Operating Systems Market Revenue Million Forecast, by Application Type 2019 & 2032
- Table 138: Global Automotive Operating Systems Market Volume K Unit Forecast, by Application Type 2019 & 2032
- Table 139: Global Automotive Operating Systems Market Revenue Million Forecast, by Country 2019 & 2032
- Table 140: Global Automotive Operating Systems Market Volume K Unit Forecast, by Country 2019 & 2032
- Table 141: Global Automotive Operating Systems Market Revenue Million Forecast, by Operating System Type 2019 & 2032
- Table 142: Global Automotive Operating Systems Market Volume K Unit Forecast, by Operating System Type 2019 & 2032
- Table 143: Global Automotive Operating Systems Market Revenue Million Forecast, by Vehicle Type 2019 & 2032
- Table 144: Global Automotive Operating Systems Market Volume K Unit Forecast, by Vehicle Type 2019 & 2032
- Table 145: Global Automotive Operating Systems Market Revenue Million Forecast, by Application Type 2019 & 2032
- Table 146: Global Automotive Operating Systems Market Volume K Unit Forecast, by Application Type 2019 & 2032
- Table 147: Global Automotive Operating Systems Market Revenue Million Forecast, by Country 2019 & 2032
- Table 148: Global Automotive Operating Systems Market Volume K Unit Forecast, by Country 2019 & 2032
Frequently Asked Questions
1. What is the projected Compound Annual Growth Rate (CAGR) of the Automotive Operating Systems Market?
The projected CAGR is approximately 23.82%.
2. Which companies are prominent players in the Automotive Operating Systems Market?
Key companies in the market include DXC Technology, BlackBerry Ltd, Alphabet Inc, Microsoft Corporation, Wind River Systems, Green Hills Software, Renesas Electronics Corporation, Nvidia Corporation, Siemens A, Luxoft.
3. What are the main segments of the Automotive Operating Systems Market?
The market segments include Operating System Type, Vehicle Type, Application Type.
4. Can you provide details about the market size?
The market size is estimated to be USD 19.09 Million as of 2022.
5. What are some drivers contributing to market growth?
Increase in demand for connected and autonomous vehicles; Integration of AI and machine learning technologies in automotive systems.
6. What are the notable trends driving market growth?
Increase in demand for connected and autonomous vehicles along with various safety features is expected to drive the market.
7. Are there any restraints impacting market growth?
Concerns about data privacy and cyber security.
8. Can you provide examples of recent developments in the market?
May 2023: Red Hat, Inc., a global leader in open-source solutions, joined forces with ETAS, a subsidiary of Bosch responsible for developing application-independent software for vehicles and the cloud. This strategic partnership aims to provide an advanced in-vehicle automotive platform that reduces overall development costs and accelerates time-to-market for automakers. The centerpiece of this collaboration is a pre-tested and pre-integrated foundational platform designed to streamline the developer experience and facilitate the delivery of application software to automakers. Notably, the ETAS deterministic middleware solution will play a pivotal role in advancing the development of cutting-edge driver assistance systems. Red Hat's In-Vehicle Operating System will serve as the cornerstone, offering a continuously-certified, open standards-based operating system.
9. What pricing options are available for accessing the report?
Pricing options include single-user, multi-user, and enterprise licenses priced at USD 4750, USD 5250, and USD 8750 respectively.
10. Is the market size provided in terms of value or volume?
The market size is provided in terms of value, measured in Million and volume, measured in K Unit.
11. Are there any specific market keywords associated with the report?
Yes, the market keyword associated with the report is "Automotive Operating Systems Market," which aids in identifying and referencing the specific market segment covered.
12. How do I determine which pricing option suits my needs best?
The pricing options vary based on user requirements and access needs. Individual users may opt for single-user licenses, while businesses requiring broader access may choose multi-user or enterprise licenses for cost-effective access to the report.
13. Are there any additional resources or data provided in the Automotive Operating Systems Market report?
While the report offers comprehensive insights, it's advisable to review the specific contents or supplementary materials provided to ascertain if additional resources or data are available.
14. How can I stay updated on further developments or reports in the Automotive Operating Systems Market?
To stay informed about further developments, trends, and reports in the Automotive Operating Systems Market, consider subscribing to industry newsletters, following relevant companies and organizations, or regularly checking reputable industry news sources and publications.
Methodology
Step 1 - Identification of Relevant Samples Size from Population Database


Step 2 - Approaches for Defining Global Market Size (Value, Volume* & Price*)

Note*: In applicable scenarios
Step 3 - Data Sources
Primary Research
- Web Analytics
- Survey Reports
- Research Institute
- Latest Research Reports
- Opinion Leaders
Secondary Research
- Annual Reports
- White Paper
- Latest Press Release
- Industry Association
- Paid Database
- Investor Presentations

Step 4 - Data Triangulation
Involves using different sources of information in order to increase the validity of a study
These sources are likely to be stakeholders in a program - participants, other researchers, program staff, other community members, and so on.
Then we put all data in single framework & apply various statistical tools to find out the dynamic on the market.
During the analysis stage, feedback from the stakeholder groups would be compared to determine areas of agreement as well as areas of divergence


