
Key Insights
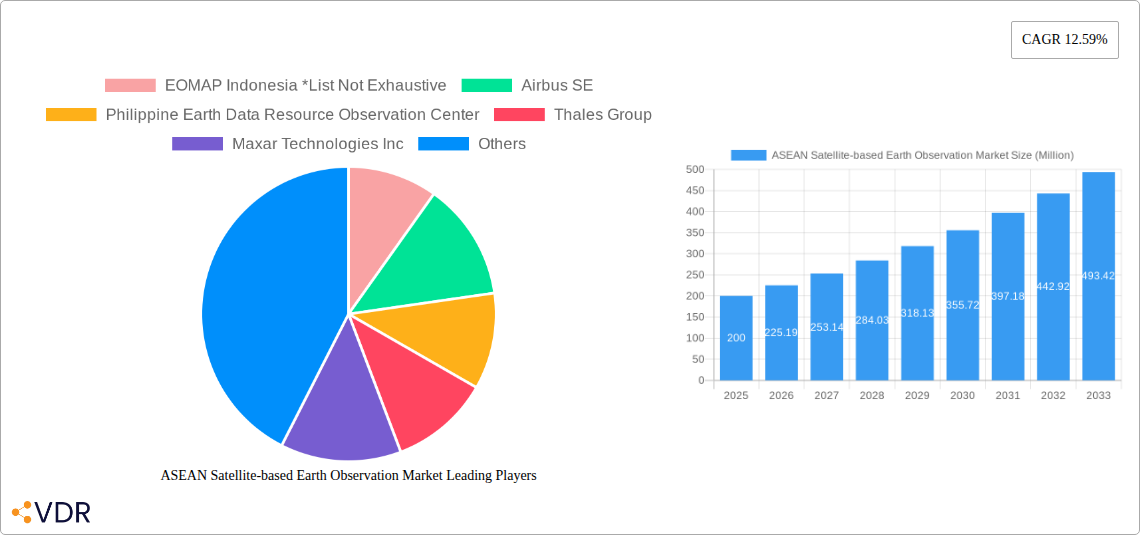
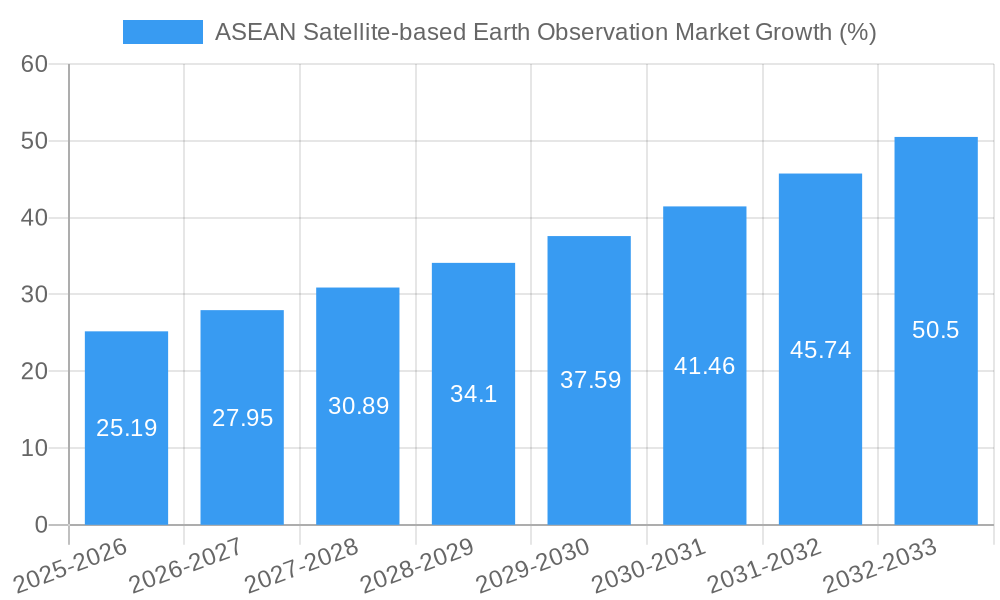
The ASEAN satellite-based Earth observation market, valued at $200 million in 2025, is poised for significant growth, exhibiting a Compound Annual Growth Rate (CAGR) of 12.59% from 2025 to 2033. This expansion is fueled by increasing government investments in infrastructure development, particularly in urban planning and disaster management across countries like Thailand, Indonesia, Malaysia, and the Philippines. The rising demand for precise agricultural data for optimizing crop yields and managing resources also contributes significantly to market growth. Furthermore, the burgeoning need for effective climate monitoring and environmental protection initiatives, coupled with the expanding adoption of value-added services derived from Earth observation data, are driving market expansion. Key market segments include Earth observation data itself, value-added services utilizing this data, and various satellite orbits (Low Earth Orbit, Medium Earth Orbit, Geostationary Orbit), catering to diverse applications across urban development, agriculture, climate services, energy, and infrastructure. The presence of established players like Airbus SE, Maxar Technologies Inc., and Thales Group, alongside regional companies such as EOMAP Indonesia, indicates a robust and competitive landscape.
The market's future trajectory suggests a substantial increase in market size over the forecast period. Factors such as technological advancements in satellite technology, improving data analytics capabilities, and the increasing affordability of satellite imagery are likely to accelerate growth. However, potential challenges include the need for robust data infrastructure to handle the growing volume of data and the complexities of data regulation across different ASEAN nations. Nevertheless, the strong governmental support for technological advancements and the increasing awareness of the benefits of satellite-based earth observation suggest a bright outlook for this market, with substantial opportunities for both established companies and new entrants.
ASEAN Satellite-based Earth Observation Market: A Comprehensive Report (2019-2033)
This comprehensive report provides an in-depth analysis of the ASEAN satellite-based Earth observation market, encompassing market dynamics, growth trends, dominant segments, key players, and future outlook. With a study period spanning 2019-2033, a base year of 2025, and a forecast period of 2025-2033, this report is an invaluable resource for industry professionals, investors, and policymakers seeking to understand and capitalize on the opportunities within this rapidly expanding market. The market size is projected to reach xx Million by 2033.
Parent Market: Global Satellite-based Earth Observation Market Child Market: ASEAN Satellite-based Earth Observation Market
ASEAN Satellite-based Earth Observation Market Dynamics & Structure
This section analyzes the competitive landscape, technological advancements, regulatory environment, and market forces shaping the ASEAN satellite-based Earth Observation market. We delve into market concentration, identifying key players and their market share, alongside an examination of mergers and acquisitions (M&A) activity within the sector.
- Market Concentration: The ASEAN satellite-based Earth observation market exhibits a moderately concentrated structure, with a few major players holding significant market share. However, the emergence of smaller, specialized companies is increasing competition. We estimate that the top 5 players hold approximately xx% of the market share in 2025.
- Technological Innovation: Technological advancements in satellite technology, sensor capabilities, and data analytics are key drivers of market growth. Improvements in resolution, spectral range, and data processing speed enhance the value and applications of Earth observation data.
- Regulatory Frameworks: Government policies and regulations regarding data access, privacy, and licensing play a crucial role in shaping market dynamics. Harmonization of regulations across ASEAN countries would facilitate market expansion.
- Competitive Product Substitutes: While satellite-based Earth observation is unique, there are alternative data sources such as aerial photography and ground-based sensors. However, the advantages of satellite data in terms of coverage, repeatability, and scale often outweigh these alternatives.
- End-User Demographics: The end-user base comprises a diverse range of sectors, including government agencies, research institutions, and commercial entities. Growth is being fueled by increasing demand across various applications.
- M&A Trends: The past five years have witnessed a moderate level of M&A activity, with larger companies acquiring smaller specialized firms to enhance their technological capabilities and expand their market reach. We observed approximately xx M&A deals in the ASEAN region between 2019 and 2024.
ASEAN Satellite-based Earth Observation Market Growth Trends & Insights
The ASEAN satellite-based Earth observation market is experiencing robust growth, driven by increasing demand for geospatial data across various sectors. This section analyzes historical and projected market size, adoption rates, technological disruptions, and shifting consumer behavior. The market is expected to register a CAGR of xx% during the forecast period (2025-2033). Market penetration in key sectors, such as agriculture and urban planning, is also increasing significantly. Technological advancements, such as the rise of small satellite constellations and improved data analytics capabilities, are further accelerating market growth. We observe a notable shift toward cloud-based data storage and processing, which improves accessibility and reduces operational costs for end-users.
Dominant Regions, Countries, or Segments in ASEAN Satellite-based Earth Observation Market
This section identifies the leading regions, countries, and market segments within the ASEAN satellite-based Earth observation market.
By Type:
- Earth Observation Data: This segment dominates the market due to the fundamental need for raw satellite imagery across numerous applications. Projected to reach xx Million by 2033.
- Value-Added Services: This segment is experiencing rapid growth, with demand for data processing, analytics, and customized solutions increasing. Projected to reach xx Million by 2033.
By Satellite Orbit:
- Low Earth Orbit (LEO): LEO satellites provide high-resolution imagery and are crucial for numerous applications. This segment is expected to maintain its dominant position. Projected to reach xx Million by 2033.
- Medium Earth Orbit (MEO) and Geostationary Orbit (GEO): MEO and GEO satellites offer broader coverage and are important for monitoring large areas and providing near real-time data for weather and environmental applications. Growth is anticipated in these segments. Projected to reach xx Million and xx Million, respectively, by 2033.
By End-use:
- Agriculture: The demand for precision agriculture solutions using satellite data is a major driver of market growth. Projected to reach xx Million by 2033.
- Urban Development and Cultural Heritage: Satellite imagery plays a vital role in urban planning, infrastructure development, and preservation of cultural heritage. Projected to reach xx Million by 2033.
- Climate Services: Monitoring climate change impacts and managing natural resources requires extensive use of satellite data. This segment shows significant growth potential. Projected to reach xx Million by 2033.
- Other End-Uses: (Energy & Raw Materials, Infrastructure, etc.): These sectors also demonstrate significant growth opportunities. Projected to reach xx Million by 2033.
By Country:
- Indonesia and Thailand: These countries are leading the market due to increased government investments and private sector adoption. Indonesia is projected to reach xx Million and Thailand xx Million by 2033.
- Malaysia and Philippines: These countries exhibit strong growth potential due to expanding infrastructure projects and rising awareness of the benefits of satellite data. Malaysia is projected to reach xx Million and Philippines xx Million by 2033.
ASEAN Satellite-based Earth Observation Market Product Landscape
The ASEAN satellite-based Earth observation market offers a diverse range of products, including high-resolution satellite imagery, advanced analytical tools, and cloud-based platforms. Recent innovations include improved sensor technologies that capture data across a broader spectrum, enabling more detailed analysis. Companies are also developing user-friendly software platforms to facilitate data access and interpretation. The focus on delivering value-added services, such as customized data processing and analytical reports, is creating a competitive advantage for various market players.
Key Drivers, Barriers & Challenges in ASEAN Satellite-based Earth Observation Market
Key Drivers:
- Government initiatives: Increased government investment in space technology and data infrastructure is driving market growth.
- Technological advancements: Improvements in satellite technology, sensor capabilities, and data analytics are enhancing data quality and applications.
- Rising demand across sectors: The demand for geospatial data is increasing across various sectors, including agriculture, urban planning, and environmental monitoring.
Key Barriers and Challenges:
- High initial investment costs: The high cost of satellite technology and data acquisition can limit market access for smaller companies.
- Data processing and analytical capabilities: The need for specialized expertise to process and interpret satellite data is a significant challenge.
- Data security and privacy concerns: Ensuring data security and privacy is crucial to maintain trust and transparency.
Emerging Opportunities in ASEAN Satellite-based Earth Observation Market
The ASEAN satellite-based Earth observation market presents numerous emerging opportunities. The growing demand for precision agriculture solutions offers significant potential. The use of satellite data in disaster management and environmental monitoring is also expected to expand rapidly. There is increasing interest in integrating satellite data with other data sources, such as IoT sensors, to create more comprehensive analytical models.
Growth Accelerators in the ASEAN Satellite-based Earth Observation Market Industry
Long-term growth is driven by advancements in satellite technology, including miniaturization and improved sensor capabilities. Strategic partnerships between government agencies, private sector companies, and research institutions are also playing a key role. The development of user-friendly data access and analytical tools is further accelerating market adoption. Expansion into new applications, such as smart city development and environmental protection, is expected to fuel continued growth.
Key Players Shaping the ASEAN Satellite-based Earth Observation Market Market
- EOMAP Indonesia
- Airbus SE (Airbus SE)
- Philippine Earth Data Resource Observation Center
- Thales Group (Thales Group)
- Maxar Technologies Inc (Maxar Technologies Inc)
- Boeing Co (Boeing Co)
- NEC Corporation (NEC Corporation)
- ST Engineering (ST Engineering)
- Spire Global Inc (Spire Global Inc)
Notable Milestones in ASEAN Satellite-based Earth Observation Market Sector
- February 2023: MOU formed between Thailand's GISTDA and Singapore's OSTIn for enhanced collaboration on Earth observation applications, creating new opportunities for market vendors.
- May 2023: Airbus announced expansion of satellite services in Malaysia, leveraging the country's growing space sector and partnering with MYSA for a constellation of Earth observation satellites.
In-Depth ASEAN Satellite-based Earth Observation Market Market Outlook
The ASEAN satellite-based Earth observation market is poised for significant growth over the next decade. Continued technological advancements, increasing government support, and expanding applications across various sectors will drive market expansion. Strategic partnerships and the development of innovative solutions will be crucial for companies seeking to capitalize on this significant market opportunity. The market's future hinges on addressing challenges like data accessibility, affordability, and standardized data formats to ensure broader adoption across diverse users.
ASEAN Satellite-based Earth Observation Market Segmentation
-
1. Type
- 1.1. Earth Observation Data
- 1.2. Value Added Services
-
2. Satellite Orbit
- 2.1. Low Earth Orbit
- 2.2. Medium Earth Orbit
- 2.3. Geostationary Orbit
-
3. End-use
- 3.1. Urban Development and Cultural Heritage
- 3.2. Agriculture
- 3.3. Climate Services
- 3.4. Energy and Raw Materials
- 3.5. Infrastructure
- 3.6. Others
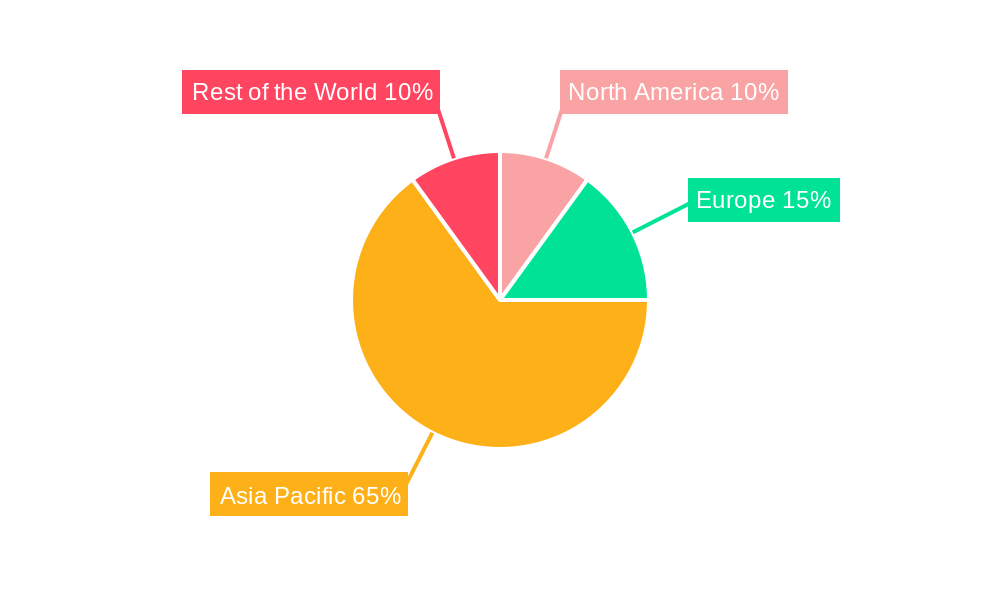
ASEAN Satellite-based Earth Observation Market Segmentation By Geography
-
1. North America
- 1.1. United States
- 1.2. Canada
- 1.3. Mexico
-
2. South America
- 2.1. Brazil
- 2.2. Argentina
- 2.3. Rest of South America
-
3. Europe
- 3.1. United Kingdom
- 3.2. Germany
- 3.3. France
- 3.4. Italy
- 3.5. Spain
- 3.6. Russia
- 3.7. Benelux
- 3.8. Nordics
- 3.9. Rest of Europe
-
4. Middle East & Africa
- 4.1. Turkey
- 4.2. Israel
- 4.3. GCC
- 4.4. North Africa
- 4.5. South Africa
- 4.6. Rest of Middle East & Africa
-
5. Asia Pacific
- 5.1. China
- 5.2. India
- 5.3. Japan
- 5.4. South Korea
- 5.5. ASEAN
- 5.6. Oceania
- 5.7. Rest of Asia Pacific
ASEAN Satellite-based Earth Observation Market REPORT HIGHLIGHTS
| Aspects | Details |
|---|---|
| Study Period | 2019-2033 |
| Base Year | 2024 |
| Estimated Year | 2025 |
| Forecast Period | 2025-2033 |
| Historical Period | 2019-2024 |
| Growth Rate | CAGR of 12.59% from 2019-2033 |
| Segmentation |
|
Table of Contents
- 1. Introduction
- 1.1. Research Scope
- 1.2. Market Segmentation
- 1.3. Research Methodology
- 1.4. Definitions and Assumptions
- 2. Executive Summary
- 2.1. Introduction
- 3. Market Dynamics
- 3.1. Introduction
- 3.2. Market Drivers
- 3.2.1. Government Initiatives and Investments; Technological Advancements
- 3.3. Market Restrains
- 3.3.1. Budget Constraints and Technological Limitations; Regulatory and Legal Challenges
- 3.4. Market Trends
- 3.4.1. Government Initiatives and Investments is Driving the Market
- 4. Market Factor Analysis
- 4.1. Porters Five Forces
- 4.2. Supply/Value Chain
- 4.3. PESTEL analysis
- 4.4. Market Entropy
- 4.5. Patent/Trademark Analysis
- 5. Global ASEAN Satellite-based Earth Observation Market Analysis, Insights and Forecast, 2019-2031
- 5.1. Market Analysis, Insights and Forecast - by Type
- 5.1.1. Earth Observation Data
- 5.1.2. Value Added Services
- 5.2. Market Analysis, Insights and Forecast - by Satellite Orbit
- 5.2.1. Low Earth Orbit
- 5.2.2. Medium Earth Orbit
- 5.2.3. Geostationary Orbit
- 5.3. Market Analysis, Insights and Forecast - by End-use
- 5.3.1. Urban Development and Cultural Heritage
- 5.3.2. Agriculture
- 5.3.3. Climate Services
- 5.3.4. Energy and Raw Materials
- 5.3.5. Infrastructure
- 5.3.6. Others
- 5.4. Market Analysis, Insights and Forecast - by Region
- 5.4.1. North America
- 5.4.2. South America
- 5.4.3. Europe
- 5.4.4. Middle East & Africa
- 5.4.5. Asia Pacific
- 5.1. Market Analysis, Insights and Forecast - by Type
- 6. North America ASEAN Satellite-based Earth Observation Market Analysis, Insights and Forecast, 2019-2031
- 6.1. Market Analysis, Insights and Forecast - by Type
- 6.1.1. Earth Observation Data
- 6.1.2. Value Added Services
- 6.2. Market Analysis, Insights and Forecast - by Satellite Orbit
- 6.2.1. Low Earth Orbit
- 6.2.2. Medium Earth Orbit
- 6.2.3. Geostationary Orbit
- 6.3. Market Analysis, Insights and Forecast - by End-use
- 6.3.1. Urban Development and Cultural Heritage
- 6.3.2. Agriculture
- 6.3.3. Climate Services
- 6.3.4. Energy and Raw Materials
- 6.3.5. Infrastructure
- 6.3.6. Others
- 6.1. Market Analysis, Insights and Forecast - by Type
- 7. South America ASEAN Satellite-based Earth Observation Market Analysis, Insights and Forecast, 2019-2031
- 7.1. Market Analysis, Insights and Forecast - by Type
- 7.1.1. Earth Observation Data
- 7.1.2. Value Added Services
- 7.2. Market Analysis, Insights and Forecast - by Satellite Orbit
- 7.2.1. Low Earth Orbit
- 7.2.2. Medium Earth Orbit
- 7.2.3. Geostationary Orbit
- 7.3. Market Analysis, Insights and Forecast - by End-use
- 7.3.1. Urban Development and Cultural Heritage
- 7.3.2. Agriculture
- 7.3.3. Climate Services
- 7.3.4. Energy and Raw Materials
- 7.3.5. Infrastructure
- 7.3.6. Others
- 7.1. Market Analysis, Insights and Forecast - by Type
- 8. Europe ASEAN Satellite-based Earth Observation Market Analysis, Insights and Forecast, 2019-2031
- 8.1. Market Analysis, Insights and Forecast - by Type
- 8.1.1. Earth Observation Data
- 8.1.2. Value Added Services
- 8.2. Market Analysis, Insights and Forecast - by Satellite Orbit
- 8.2.1. Low Earth Orbit
- 8.2.2. Medium Earth Orbit
- 8.2.3. Geostationary Orbit
- 8.3. Market Analysis, Insights and Forecast - by End-use
- 8.3.1. Urban Development and Cultural Heritage
- 8.3.2. Agriculture
- 8.3.3. Climate Services
- 8.3.4. Energy and Raw Materials
- 8.3.5. Infrastructure
- 8.3.6. Others
- 8.1. Market Analysis, Insights and Forecast - by Type
- 9. Middle East & Africa ASEAN Satellite-based Earth Observation Market Analysis, Insights and Forecast, 2019-2031
- 9.1. Market Analysis, Insights and Forecast - by Type
- 9.1.1. Earth Observation Data
- 9.1.2. Value Added Services
- 9.2. Market Analysis, Insights and Forecast - by Satellite Orbit
- 9.2.1. Low Earth Orbit
- 9.2.2. Medium Earth Orbit
- 9.2.3. Geostationary Orbit
- 9.3. Market Analysis, Insights and Forecast - by End-use
- 9.3.1. Urban Development and Cultural Heritage
- 9.3.2. Agriculture
- 9.3.3. Climate Services
- 9.3.4. Energy and Raw Materials
- 9.3.5. Infrastructure
- 9.3.6. Others
- 9.1. Market Analysis, Insights and Forecast - by Type
- 10. Asia Pacific ASEAN Satellite-based Earth Observation Market Analysis, Insights and Forecast, 2019-2031
- 10.1. Market Analysis, Insights and Forecast - by Type
- 10.1.1. Earth Observation Data
- 10.1.2. Value Added Services
- 10.2. Market Analysis, Insights and Forecast - by Satellite Orbit
- 10.2.1. Low Earth Orbit
- 10.2.2. Medium Earth Orbit
- 10.2.3. Geostationary Orbit
- 10.3. Market Analysis, Insights and Forecast - by End-use
- 10.3.1. Urban Development and Cultural Heritage
- 10.3.2. Agriculture
- 10.3.3. Climate Services
- 10.3.4. Energy and Raw Materials
- 10.3.5. Infrastructure
- 10.3.6. Others
- 10.1. Market Analysis, Insights and Forecast - by Type
- 11. North America ASEAN Satellite-based Earth Observation Market Analysis, Insights and Forecast, 2019-2031
- 11.1. Market Analysis, Insights and Forecast - By Country/Sub-region
- 11.1.1.
- 12. Europe ASEAN Satellite-based Earth Observation Market Analysis, Insights and Forecast, 2019-2031
- 12.1. Market Analysis, Insights and Forecast - By Country/Sub-region
- 12.1.1.
- 13. Asia Pacific ASEAN Satellite-based Earth Observation Market Analysis, Insights and Forecast, 2019-2031
- 13.1. Market Analysis, Insights and Forecast - By Country/Sub-region
- 13.1.1.
- 14. Rest of the World ASEAN Satellite-based Earth Observation Market Analysis, Insights and Forecast, 2019-2031
- 14.1. Market Analysis, Insights and Forecast - By Country/Sub-region
- 14.1.1.
- 15. Competitive Analysis
- 15.1. Global Market Share Analysis 2024
- 15.2. Company Profiles
- 15.2.1 EOMAP Indonesia *List Not Exhaustive
- 15.2.1.1. Overview
- 15.2.1.2. Products
- 15.2.1.3. SWOT Analysis
- 15.2.1.4. Recent Developments
- 15.2.1.5. Financials (Based on Availability)
- 15.2.2 Airbus SE
- 15.2.2.1. Overview
- 15.2.2.2. Products
- 15.2.2.3. SWOT Analysis
- 15.2.2.4. Recent Developments
- 15.2.2.5. Financials (Based on Availability)
- 15.2.3 Philippine Earth Data Resource Observation Center
- 15.2.3.1. Overview
- 15.2.3.2. Products
- 15.2.3.3. SWOT Analysis
- 15.2.3.4. Recent Developments
- 15.2.3.5. Financials (Based on Availability)
- 15.2.4 Thales Group
- 15.2.4.1. Overview
- 15.2.4.2. Products
- 15.2.4.3. SWOT Analysis
- 15.2.4.4. Recent Developments
- 15.2.4.5. Financials (Based on Availability)
- 15.2.5 Maxar Technologies Inc
- 15.2.5.1. Overview
- 15.2.5.2. Products
- 15.2.5.3. SWOT Analysis
- 15.2.5.4. Recent Developments
- 15.2.5.5. Financials (Based on Availability)
- 15.2.6 Boeing Co
- 15.2.6.1. Overview
- 15.2.6.2. Products
- 15.2.6.3. SWOT Analysis
- 15.2.6.4. Recent Developments
- 15.2.6.5. Financials (Based on Availability)
- 15.2.7 NEC Corporation
- 15.2.7.1. Overview
- 15.2.7.2. Products
- 15.2.7.3. SWOT Analysis
- 15.2.7.4. Recent Developments
- 15.2.7.5. Financials (Based on Availability)
- 15.2.8 ST Engineering
- 15.2.8.1. Overview
- 15.2.8.2. Products
- 15.2.8.3. SWOT Analysis
- 15.2.8.4. Recent Developments
- 15.2.8.5. Financials (Based on Availability)
- 15.2.9 Spire Global Inc
- 15.2.9.1. Overview
- 15.2.9.2. Products
- 15.2.9.3. SWOT Analysis
- 15.2.9.4. Recent Developments
- 15.2.9.5. Financials (Based on Availability)
- 15.2.1 EOMAP Indonesia *List Not Exhaustive
List of Figures
- Figure 1: Global ASEAN Satellite-based Earth Observation Market Revenue Breakdown (Million, %) by Region 2024 & 2032
- Figure 2: North America ASEAN Satellite-based Earth Observation Market Revenue (Million), by Country 2024 & 2032
- Figure 3: North America ASEAN Satellite-based Earth Observation Market Revenue Share (%), by Country 2024 & 2032
- Figure 4: Europe ASEAN Satellite-based Earth Observation Market Revenue (Million), by Country 2024 & 2032
- Figure 5: Europe ASEAN Satellite-based Earth Observation Market Revenue Share (%), by Country 2024 & 2032
- Figure 6: Asia Pacific ASEAN Satellite-based Earth Observation Market Revenue (Million), by Country 2024 & 2032
- Figure 7: Asia Pacific ASEAN Satellite-based Earth Observation Market Revenue Share (%), by Country 2024 & 2032
- Figure 8: Rest of the World ASEAN Satellite-based Earth Observation Market Revenue (Million), by Country 2024 & 2032
- Figure 9: Rest of the World ASEAN Satellite-based Earth Observation Market Revenue Share (%), by Country 2024 & 2032
- Figure 10: North America ASEAN Satellite-based Earth Observation Market Revenue (Million), by Type 2024 & 2032
- Figure 11: North America ASEAN Satellite-based Earth Observation Market Revenue Share (%), by Type 2024 & 2032
- Figure 12: North America ASEAN Satellite-based Earth Observation Market Revenue (Million), by Satellite Orbit 2024 & 2032
- Figure 13: North America ASEAN Satellite-based Earth Observation Market Revenue Share (%), by Satellite Orbit 2024 & 2032
- Figure 14: North America ASEAN Satellite-based Earth Observation Market Revenue (Million), by End-use 2024 & 2032
- Figure 15: North America ASEAN Satellite-based Earth Observation Market Revenue Share (%), by End-use 2024 & 2032
- Figure 16: North America ASEAN Satellite-based Earth Observation Market Revenue (Million), by Country 2024 & 2032
- Figure 17: North America ASEAN Satellite-based Earth Observation Market Revenue Share (%), by Country 2024 & 2032
- Figure 18: South America ASEAN Satellite-based Earth Observation Market Revenue (Million), by Type 2024 & 2032
- Figure 19: South America ASEAN Satellite-based Earth Observation Market Revenue Share (%), by Type 2024 & 2032
- Figure 20: South America ASEAN Satellite-based Earth Observation Market Revenue (Million), by Satellite Orbit 2024 & 2032
- Figure 21: South America ASEAN Satellite-based Earth Observation Market Revenue Share (%), by Satellite Orbit 2024 & 2032
- Figure 22: South America ASEAN Satellite-based Earth Observation Market Revenue (Million), by End-use 2024 & 2032
- Figure 23: South America ASEAN Satellite-based Earth Observation Market Revenue Share (%), by End-use 2024 & 2032
- Figure 24: South America ASEAN Satellite-based Earth Observation Market Revenue (Million), by Country 2024 & 2032
- Figure 25: South America ASEAN Satellite-based Earth Observation Market Revenue Share (%), by Country 2024 & 2032
- Figure 26: Europe ASEAN Satellite-based Earth Observation Market Revenue (Million), by Type 2024 & 2032
- Figure 27: Europe ASEAN Satellite-based Earth Observation Market Revenue Share (%), by Type 2024 & 2032
- Figure 28: Europe ASEAN Satellite-based Earth Observation Market Revenue (Million), by Satellite Orbit 2024 & 2032
- Figure 29: Europe ASEAN Satellite-based Earth Observation Market Revenue Share (%), by Satellite Orbit 2024 & 2032
- Figure 30: Europe ASEAN Satellite-based Earth Observation Market Revenue (Million), by End-use 2024 & 2032
- Figure 31: Europe ASEAN Satellite-based Earth Observation Market Revenue Share (%), by End-use 2024 & 2032
- Figure 32: Europe ASEAN Satellite-based Earth Observation Market Revenue (Million), by Country 2024 & 2032
- Figure 33: Europe ASEAN Satellite-based Earth Observation Market Revenue Share (%), by Country 2024 & 2032
- Figure 34: Middle East & Africa ASEAN Satellite-based Earth Observation Market Revenue (Million), by Type 2024 & 2032
- Figure 35: Middle East & Africa ASEAN Satellite-based Earth Observation Market Revenue Share (%), by Type 2024 & 2032
- Figure 36: Middle East & Africa ASEAN Satellite-based Earth Observation Market Revenue (Million), by Satellite Orbit 2024 & 2032
- Figure 37: Middle East & Africa ASEAN Satellite-based Earth Observation Market Revenue Share (%), by Satellite Orbit 2024 & 2032
- Figure 38: Middle East & Africa ASEAN Satellite-based Earth Observation Market Revenue (Million), by End-use 2024 & 2032
- Figure 39: Middle East & Africa ASEAN Satellite-based Earth Observation Market Revenue Share (%), by End-use 2024 & 2032
- Figure 40: Middle East & Africa ASEAN Satellite-based Earth Observation Market Revenue (Million), by Country 2024 & 2032
- Figure 41: Middle East & Africa ASEAN Satellite-based Earth Observation Market Revenue Share (%), by Country 2024 & 2032
- Figure 42: Asia Pacific ASEAN Satellite-based Earth Observation Market Revenue (Million), by Type 2024 & 2032
- Figure 43: Asia Pacific ASEAN Satellite-based Earth Observation Market Revenue Share (%), by Type 2024 & 2032
- Figure 44: Asia Pacific ASEAN Satellite-based Earth Observation Market Revenue (Million), by Satellite Orbit 2024 & 2032
- Figure 45: Asia Pacific ASEAN Satellite-based Earth Observation Market Revenue Share (%), by Satellite Orbit 2024 & 2032
- Figure 46: Asia Pacific ASEAN Satellite-based Earth Observation Market Revenue (Million), by End-use 2024 & 2032
- Figure 47: Asia Pacific ASEAN Satellite-based Earth Observation Market Revenue Share (%), by End-use 2024 & 2032
- Figure 48: Asia Pacific ASEAN Satellite-based Earth Observation Market Revenue (Million), by Country 2024 & 2032
- Figure 49: Asia Pacific ASEAN Satellite-based Earth Observation Market Revenue Share (%), by Country 2024 & 2032
List of Tables
- Table 1: Global ASEAN Satellite-based Earth Observation Market Revenue Million Forecast, by Region 2019 & 2032
- Table 2: Global ASEAN Satellite-based Earth Observation Market Revenue Million Forecast, by Type 2019 & 2032
- Table 3: Global ASEAN Satellite-based Earth Observation Market Revenue Million Forecast, by Satellite Orbit 2019 & 2032
- Table 4: Global ASEAN Satellite-based Earth Observation Market Revenue Million Forecast, by End-use 2019 & 2032
- Table 5: Global ASEAN Satellite-based Earth Observation Market Revenue Million Forecast, by Region 2019 & 2032
- Table 6: Global ASEAN Satellite-based Earth Observation Market Revenue Million Forecast, by Country 2019 & 2032
- Table 7: ASEAN Satellite-based Earth Observation Market Revenue (Million) Forecast, by Application 2019 & 2032
- Table 8: Global ASEAN Satellite-based Earth Observation Market Revenue Million Forecast, by Country 2019 & 2032
- Table 9: ASEAN Satellite-based Earth Observation Market Revenue (Million) Forecast, by Application 2019 & 2032
- Table 10: Global ASEAN Satellite-based Earth Observation Market Revenue Million Forecast, by Country 2019 & 2032
- Table 11: ASEAN Satellite-based Earth Observation Market Revenue (Million) Forecast, by Application 2019 & 2032
- Table 12: Global ASEAN Satellite-based Earth Observation Market Revenue Million Forecast, by Country 2019 & 2032
- Table 13: ASEAN Satellite-based Earth Observation Market Revenue (Million) Forecast, by Application 2019 & 2032
- Table 14: Global ASEAN Satellite-based Earth Observation Market Revenue Million Forecast, by Type 2019 & 2032
- Table 15: Global ASEAN Satellite-based Earth Observation Market Revenue Million Forecast, by Satellite Orbit 2019 & 2032
- Table 16: Global ASEAN Satellite-based Earth Observation Market Revenue Million Forecast, by End-use 2019 & 2032
- Table 17: Global ASEAN Satellite-based Earth Observation Market Revenue Million Forecast, by Country 2019 & 2032
- Table 18: United States ASEAN Satellite-based Earth Observation Market Revenue (Million) Forecast, by Application 2019 & 2032
- Table 19: Canada ASEAN Satellite-based Earth Observation Market Revenue (Million) Forecast, by Application 2019 & 2032
- Table 20: Mexico ASEAN Satellite-based Earth Observation Market Revenue (Million) Forecast, by Application 2019 & 2032
- Table 21: Global ASEAN Satellite-based Earth Observation Market Revenue Million Forecast, by Type 2019 & 2032
- Table 22: Global ASEAN Satellite-based Earth Observation Market Revenue Million Forecast, by Satellite Orbit 2019 & 2032
- Table 23: Global ASEAN Satellite-based Earth Observation Market Revenue Million Forecast, by End-use 2019 & 2032
- Table 24: Global ASEAN Satellite-based Earth Observation Market Revenue Million Forecast, by Country 2019 & 2032
- Table 25: Brazil ASEAN Satellite-based Earth Observation Market Revenue (Million) Forecast, by Application 2019 & 2032
- Table 26: Argentina ASEAN Satellite-based Earth Observation Market Revenue (Million) Forecast, by Application 2019 & 2032
- Table 27: Rest of South America ASEAN Satellite-based Earth Observation Market Revenue (Million) Forecast, by Application 2019 & 2032
- Table 28: Global ASEAN Satellite-based Earth Observation Market Revenue Million Forecast, by Type 2019 & 2032
- Table 29: Global ASEAN Satellite-based Earth Observation Market Revenue Million Forecast, by Satellite Orbit 2019 & 2032
- Table 30: Global ASEAN Satellite-based Earth Observation Market Revenue Million Forecast, by End-use 2019 & 2032
- Table 31: Global ASEAN Satellite-based Earth Observation Market Revenue Million Forecast, by Country 2019 & 2032
- Table 32: United Kingdom ASEAN Satellite-based Earth Observation Market Revenue (Million) Forecast, by Application 2019 & 2032
- Table 33: Germany ASEAN Satellite-based Earth Observation Market Revenue (Million) Forecast, by Application 2019 & 2032
- Table 34: France ASEAN Satellite-based Earth Observation Market Revenue (Million) Forecast, by Application 2019 & 2032
- Table 35: Italy ASEAN Satellite-based Earth Observation Market Revenue (Million) Forecast, by Application 2019 & 2032
- Table 36: Spain ASEAN Satellite-based Earth Observation Market Revenue (Million) Forecast, by Application 2019 & 2032
- Table 37: Russia ASEAN Satellite-based Earth Observation Market Revenue (Million) Forecast, by Application 2019 & 2032
- Table 38: Benelux ASEAN Satellite-based Earth Observation Market Revenue (Million) Forecast, by Application 2019 & 2032
- Table 39: Nordics ASEAN Satellite-based Earth Observation Market Revenue (Million) Forecast, by Application 2019 & 2032
- Table 40: Rest of Europe ASEAN Satellite-based Earth Observation Market Revenue (Million) Forecast, by Application 2019 & 2032
- Table 41: Global ASEAN Satellite-based Earth Observation Market Revenue Million Forecast, by Type 2019 & 2032
- Table 42: Global ASEAN Satellite-based Earth Observation Market Revenue Million Forecast, by Satellite Orbit 2019 & 2032
- Table 43: Global ASEAN Satellite-based Earth Observation Market Revenue Million Forecast, by End-use 2019 & 2032
- Table 44: Global ASEAN Satellite-based Earth Observation Market Revenue Million Forecast, by Country 2019 & 2032
- Table 45: Turkey ASEAN Satellite-based Earth Observation Market Revenue (Million) Forecast, by Application 2019 & 2032
- Table 46: Israel ASEAN Satellite-based Earth Observation Market Revenue (Million) Forecast, by Application 2019 & 2032
- Table 47: GCC ASEAN Satellite-based Earth Observation Market Revenue (Million) Forecast, by Application 2019 & 2032
- Table 48: North Africa ASEAN Satellite-based Earth Observation Market Revenue (Million) Forecast, by Application 2019 & 2032
- Table 49: South Africa ASEAN Satellite-based Earth Observation Market Revenue (Million) Forecast, by Application 2019 & 2032
- Table 50: Rest of Middle East & Africa ASEAN Satellite-based Earth Observation Market Revenue (Million) Forecast, by Application 2019 & 2032
- Table 51: Global ASEAN Satellite-based Earth Observation Market Revenue Million Forecast, by Type 2019 & 2032
- Table 52: Global ASEAN Satellite-based Earth Observation Market Revenue Million Forecast, by Satellite Orbit 2019 & 2032
- Table 53: Global ASEAN Satellite-based Earth Observation Market Revenue Million Forecast, by End-use 2019 & 2032
- Table 54: Global ASEAN Satellite-based Earth Observation Market Revenue Million Forecast, by Country 2019 & 2032
- Table 55: China ASEAN Satellite-based Earth Observation Market Revenue (Million) Forecast, by Application 2019 & 2032
- Table 56: India ASEAN Satellite-based Earth Observation Market Revenue (Million) Forecast, by Application 2019 & 2032
- Table 57: Japan ASEAN Satellite-based Earth Observation Market Revenue (Million) Forecast, by Application 2019 & 2032
- Table 58: South Korea ASEAN Satellite-based Earth Observation Market Revenue (Million) Forecast, by Application 2019 & 2032
- Table 59: ASEAN ASEAN Satellite-based Earth Observation Market Revenue (Million) Forecast, by Application 2019 & 2032
- Table 60: Oceania ASEAN Satellite-based Earth Observation Market Revenue (Million) Forecast, by Application 2019 & 2032
- Table 61: Rest of Asia Pacific ASEAN Satellite-based Earth Observation Market Revenue (Million) Forecast, by Application 2019 & 2032
Frequently Asked Questions
1. What is the projected Compound Annual Growth Rate (CAGR) of the ASEAN Satellite-based Earth Observation Market?
The projected CAGR is approximately 12.59%.
2. Which companies are prominent players in the ASEAN Satellite-based Earth Observation Market?
Key companies in the market include EOMAP Indonesia *List Not Exhaustive, Airbus SE, Philippine Earth Data Resource Observation Center, Thales Group, Maxar Technologies Inc, Boeing Co, NEC Corporation, ST Engineering, Spire Global Inc.
3. What are the main segments of the ASEAN Satellite-based Earth Observation Market?
The market segments include Type, Satellite Orbit, End-use.
4. Can you provide details about the market size?
The market size is estimated to be USD 0.2 Million as of 2022.
5. What are some drivers contributing to market growth?
Government Initiatives and Investments; Technological Advancements.
6. What are the notable trends driving market growth?
Government Initiatives and Investments is Driving the Market.
7. Are there any restraints impacting market growth?
Budget Constraints and Technological Limitations; Regulatory and Legal Challenges.
8. Can you provide examples of recent developments in the market?
February 2023: An MOU was formed to establish an international space collaboration between the Geo-Informatics and Space Technology Development Agency (GISTDA) of Thailand and the Office for Space Technology & Industry, Singapore (OSTIn) to develop a framework for close collaboration on Earth observation (EO) applications between the two countries of the ASEAN region, which would create an opportunity for the market vendors.
9. What pricing options are available for accessing the report?
Pricing options include single-user, multi-user, and enterprise licenses priced at USD 3800, USD 4500, and USD 5800 respectively.
10. Is the market size provided in terms of value or volume?
The market size is provided in terms of value, measured in Million.
11. Are there any specific market keywords associated with the report?
Yes, the market keyword associated with the report is "ASEAN Satellite-based Earth Observation Market," which aids in identifying and referencing the specific market segment covered.
12. How do I determine which pricing option suits my needs best?
The pricing options vary based on user requirements and access needs. Individual users may opt for single-user licenses, while businesses requiring broader access may choose multi-user or enterprise licenses for cost-effective access to the report.
13. Are there any additional resources or data provided in the ASEAN Satellite-based Earth Observation Market report?
While the report offers comprehensive insights, it's advisable to review the specific contents or supplementary materials provided to ascertain if additional resources or data are available.
14. How can I stay updated on further developments or reports in the ASEAN Satellite-based Earth Observation Market?
To stay informed about further developments, trends, and reports in the ASEAN Satellite-based Earth Observation Market, consider subscribing to industry newsletters, following relevant companies and organizations, or regularly checking reputable industry news sources and publications.
Methodology
Step 1 - Identification of Relevant Samples Size from Population Database


Step 2 - Approaches for Defining Global Market Size (Value, Volume* & Price*)

Note*: In applicable scenarios
Step 3 - Data Sources
Primary Research
- Web Analytics
- Survey Reports
- Research Institute
- Latest Research Reports
- Opinion Leaders
Secondary Research
- Annual Reports
- White Paper
- Latest Press Release
- Industry Association
- Paid Database
- Investor Presentations

Step 4 - Data Triangulation
Involves using different sources of information in order to increase the validity of a study
These sources are likely to be stakeholders in a program - participants, other researchers, program staff, other community members, and so on.
Then we put all data in single framework & apply various statistical tools to find out the dynamic on the market.
During the analysis stage, feedback from the stakeholder groups would be compared to determine areas of agreement as well as areas of divergence


