
Key Insights
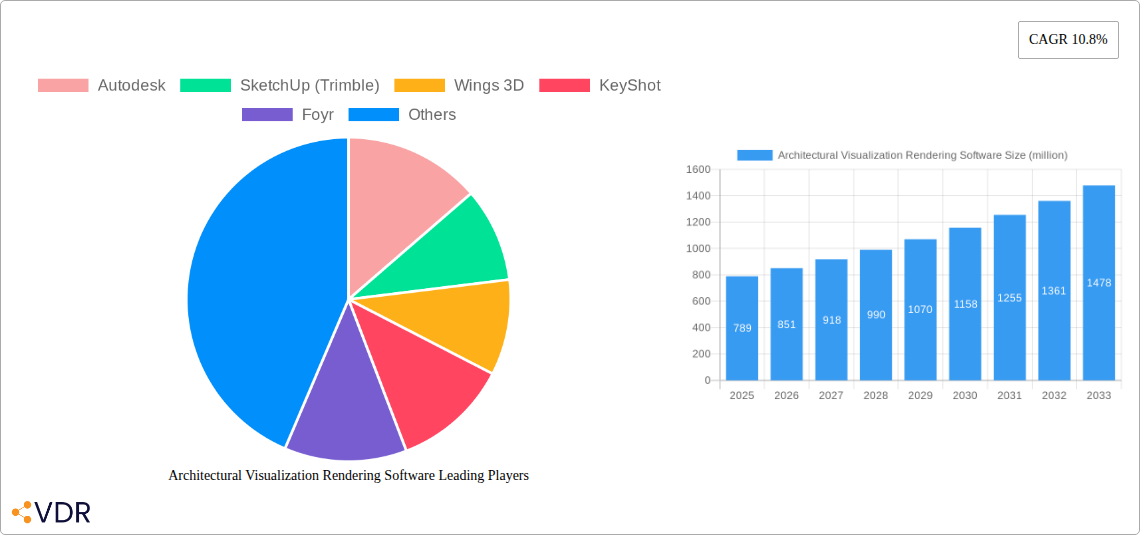
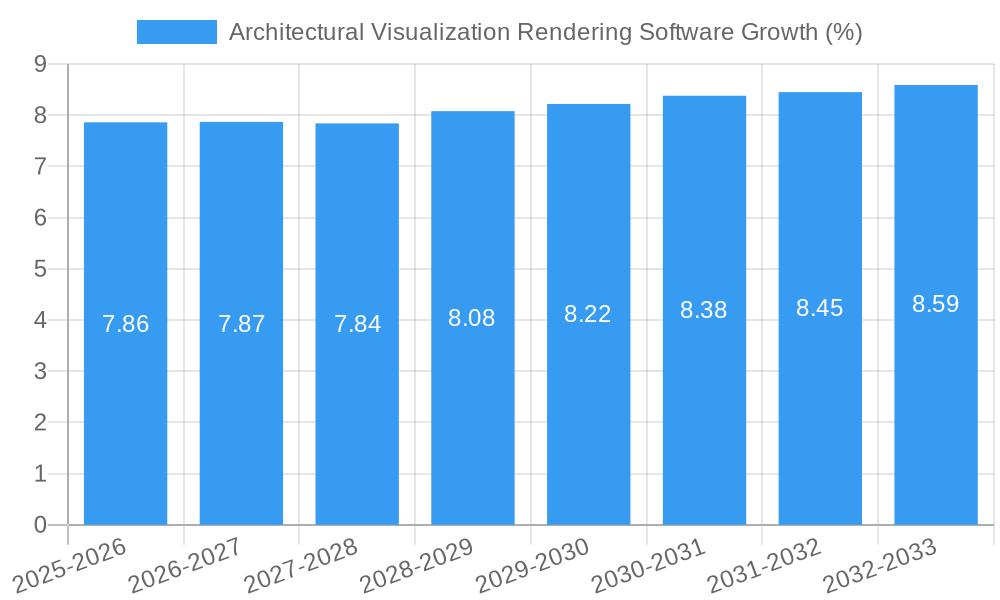
The global Architectural Visualization Rendering Software market is poised for substantial expansion, projected to reach an impressive market size of $789 million by 2025, with a robust Compound Annual Growth Rate (CAGR) of 10.8% anticipated throughout the forecast period. This dynamic growth is propelled by an increasing demand for realistic and immersive architectural visualizations across both Small and Medium-sized Enterprises (SMEs) and large enterprises. The shift towards cloud-based solutions is a significant driver, offering enhanced accessibility, scalability, and collaborative features that are particularly attractive to modern architectural firms. This trend is further amplified by the growing adoption of advanced rendering techniques and the need for sophisticated visualization tools to effectively communicate design intent, secure client approvals, and streamline project workflows. The software plays a critical role in the pre-construction phase, enabling architects and designers to present photorealistic renderings, walkthroughs, and virtual reality experiences, thereby reducing potential design conflicts and improving client satisfaction.
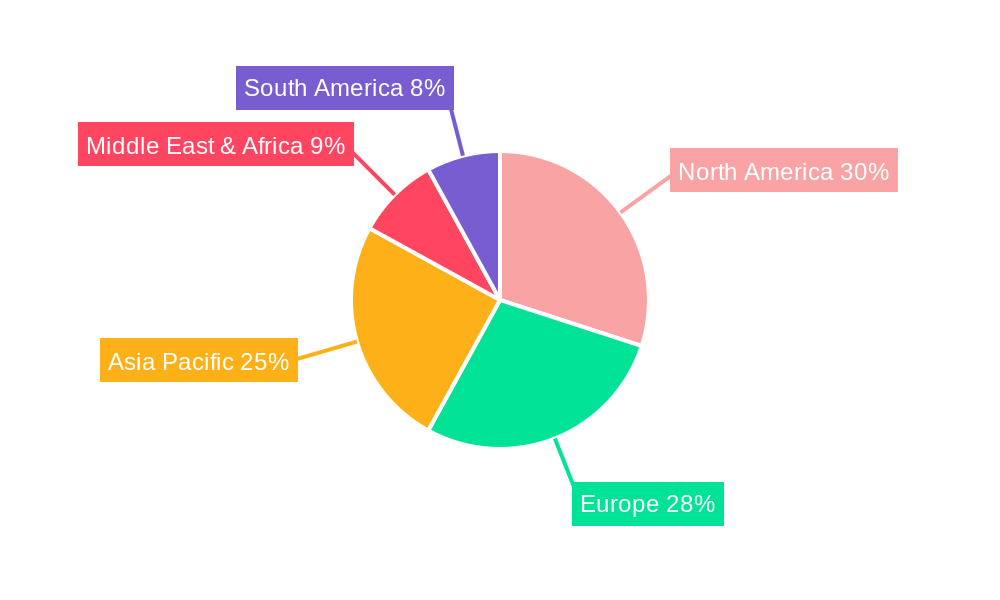
Key factors influencing this upward trajectory include the rapid technological advancements in rendering engines, the proliferation of real-time visualization capabilities, and the increasing integration of AI-powered features that automate complex rendering processes. The rising complexity of architectural projects and the competitive landscape necessitate sophisticated visualization tools to differentiate offerings and win bids. While the market is experiencing robust growth, certain restraints, such as the initial investment cost for premium software and hardware, and the need for specialized skills to operate advanced features, may pose challenges for smaller firms. However, the burgeoning adoption of open-source solutions and the increasing availability of tiered pricing models are mitigating these concerns. Geographically, North America and Europe currently dominate the market due to the early adoption of technology and the presence of established architectural practices. The Asia Pacific region, driven by rapid urbanization and infrastructure development in countries like China and India, presents the most significant growth opportunity.
Architectural Visualization Rendering Software Market Dynamics & Structure
The architectural visualization rendering software market is characterized by dynamic shifts driven by rapid technological innovation and evolving industry demands. Market concentration varies across segments, with dominant players like Autodesk, SketchUp (Trimble), and Lumion holding significant shares, particularly in the large enterprise segment, while cloud-based solutions are increasingly favored for their scalability and accessibility. Technological innovation is a primary driver, with advancements in real-time rendering, AI-powered features, and integration with BIM (Building Information Modeling) workflows continuously pushing the boundaries of visual realism and efficiency. Regulatory frameworks are largely supportive, focusing on intellectual property rights and data security, though increasing demand for sustainable building practices may influence software development towards features that support eco-friendly design visualization. Competitive product substitutes exist, ranging from in-house development teams utilizing general 3D modeling software to more accessible, albeit less specialized, rendering plugins. End-user demographics are broadening, encompassing not only large architectural firms and construction companies but also an increasing number of SMEs seeking to enhance their client presentations and marketing efforts. Mergers and acquisition (M&A) trends are moderately active, with larger software providers acquiring smaller, innovative companies to expand their feature sets and market reach.
- Market Concentration: Moderate to high in the enterprise segment, lower in the SME segment.
- Technological Innovation Drivers: Real-time rendering, AI, VR/AR integration, BIM compatibility.
- Regulatory Frameworks: Primarily supportive, focusing on IP and data.
- Competitive Product Substitutes: General 3D modeling software, rendering plugins, in-house solutions.
- End-User Demographics: Large enterprises, SMEs, independent architects, interior designers.
- M&A Trends: Moderate activity, with strategic acquisitions to bolster portfolios.
Architectural Visualization Rendering Software Growth Trends & Insights
The architectural visualization rendering software market is poised for robust expansion, fueled by an escalating demand for hyper-realistic visualizations that bridge the gap between design concepts and tangible realities. The market size is projected to witness significant growth, with a projected Compound Annual Growth Rate (CAGR) of approximately 15.5% from the base year 2025 through to 2033. This expansion is intrinsically linked to the increasing adoption of BIM technologies, where rendering software plays a pivotal role in transforming complex design data into immersive and understandable visual experiences for clients and stakeholders. The base year, 2025, is estimated to have a market size of roughly $4,800 million. The historical period from 2019 to 2024 saw steady, albeit slower, growth, driven by the initial wave of 3D visualization adoption. Adoption rates are accelerating, particularly among SMEs, as cloud-based rendering solutions become more affordable and user-friendly, democratizing access to high-quality visualization tools. Technological disruptions are at the forefront of this growth. Advancements in GPU rendering, ray tracing, and AI-powered material generation are significantly reducing rendering times and enhancing visual fidelity, allowing for photorealistic outputs that were previously unattainable. Furthermore, the integration of Virtual Reality (VR) and Augmented Reality (AR) into rendering workflows is creating new avenues for client engagement and design exploration, offering immersive walkthroughs and on-site visualizations. Consumer behavior is also shifting; clients and investors are increasingly expecting high-quality visual presentations as a standard, pushing architectural firms to invest in cutting-edge rendering software to remain competitive. The focus is moving beyond static images to dynamic, interactive visualizations that provide a comprehensive understanding of the proposed project. The proliferation of high-speed internet and cloud computing infrastructure further supports the adoption of cloud-based rendering solutions, enabling seamless collaboration and access to powerful rendering capabilities without substantial upfront hardware investment. The accessibility of powerful yet intuitive software like Lumion and SketchUp has also broadened the user base, attracting a new generation of designers and visualization artists. The continuous development of rendering engines, such as OctaneRender (OTOY) and V-Ray (Chaos Group), pushing the envelope of photorealism, is a key indicator of the industry's forward momentum. This evolution not only enhances the aesthetic appeal of architectural designs but also aids in early error detection and design validation, ultimately leading to more efficient and cost-effective project execution.
Dominant Regions, Countries, or Segments in Architectural Visualization Rendering Software
The global architectural visualization rendering software market is experiencing significant growth, with North America currently leading in terms of market share and adoption. This dominance is propelled by a confluence of factors, including a mature architectural and construction industry, substantial investments in infrastructure development, and a strong emphasis on technological innovation. The United States, in particular, accounts for a significant portion of this regional leadership, driven by major metropolitan areas with high demand for commercial and residential development, alongside a robust ecosystem of software developers and early adopters. The large enterprise segment within North America is a key driver, with major architectural firms and real estate developers consistently investing in high-end rendering solutions to gain a competitive edge in a sophisticated market. Cloud-based solutions are also experiencing rapid penetration in this region due to its advanced digital infrastructure and the widespread adoption of cloud services across industries. The emphasis on client experience and the increasing demand for photorealistic marketing materials in the real estate sector further solidify North America's leading position.
- Leading Region: North America.
- Key Country: United States.
- Dominant Segment (Application): Large Enterprises.
- Dominant Segment (Type): Cloud Based.
Key Drivers for Dominance in North America:
- Economic Policies & Infrastructure: Significant government and private sector investment in infrastructure projects, coupled with favorable economic policies for businesses, drives demand for architectural services and, consequently, visualization tools.
- Technological Adoption & Innovation Hubs: Presence of leading software developers like Autodesk, and a culture of early adoption of new technologies like VR/AR, fosters a dynamic market.
- Real Estate Market Sophistication: A highly competitive real estate market necessitates compelling visualizations for sales and marketing, pushing demand for advanced rendering capabilities.
- BIM Integration: Widespread adoption of BIM workflows necessitates high-quality rendering software for data visualization and communication.
- Cloud Infrastructure: Robust cloud computing infrastructure supports the seamless deployment and scalability of cloud-based rendering solutions.
The dominance of large enterprises in North America is attributed to their substantial budgets for software acquisition and hardware, enabling them to leverage the full potential of sophisticated rendering engines. Cloud-based solutions are preferred for their flexibility, collaborative features, and reduced IT overhead, aligning with the operational efficiency goals of these organizations. While SMEs are increasingly adopting these technologies, the scale of projects and the intensity of competition among larger firms naturally drive higher investment in cutting-edge visualization tools.
Architectural Visualization Rendering Software Product Landscape
The architectural visualization rendering software landscape is characterized by continuous product innovation, aiming to deliver unparalleled realism and efficiency. Key developments include the integration of real-time ray tracing for instantaneous visual feedback, AI-powered material generation and scene optimization, and seamless compatibility with BIM software like ArchiCad. Software such as Lumion excels in providing intuitive workflows for creating cinematic walkthroughs and photorealistic stills, while V-Ray (Chaos Group) and OctaneRender (OTOY) are renowned for their powerful rendering engines, delivering industry-leading photorealism. KeyShot and Cinema 4D (Maxon Computer) offer versatile solutions for product visualization and animation, often extending into architectural contexts. Foyr and SketchUp (Trimble) provide user-friendly interfaces, making advanced rendering accessible to a wider audience, including SMEs. The performance metrics are increasingly focused on rendering speed, ease of use, and the quality of output, with a growing emphasis on features that support virtual reality and augmented reality experiences.
Key Drivers, Barriers & Challenges in Architectural Visualization Rendering Software
Key Drivers:
- Demand for Photorealism: The increasing need for highly realistic visualizations to secure client approvals, marketing, and investor confidence is a primary driver.
- Technological Advancements: Continuous improvements in GPU power, AI, and rendering algorithms enable more sophisticated and faster visual outputs.
- BIM Integration: The growing adoption of Building Information Modeling (BIM) necessitates robust rendering capabilities for data visualization.
- SME Market Growth: Democratization of technology and cost-effective solutions are enabling smaller firms to access advanced visualization tools.
- VR/AR Expansion: The rise of immersive technologies creates new opportunities for interactive architectural visualizations.
Key Barriers & Challenges:
- High Initial Investment: For cutting-edge, on-premises solutions, the initial cost of software licenses and powerful hardware can be prohibitive, especially for SMEs.
- Steep Learning Curves: Some advanced rendering software requires significant training and expertise, posing a barrier to entry for less experienced users.
- Rendering Time & Computational Power: Achieving photorealistic results can still be time-consuming, requiring substantial computational resources, leading to workflow bottlenecks.
- Software Interoperability: Seamless integration between different design and rendering software can sometimes be a challenge, leading to workflow disruptions.
- Intellectual Property & Piracy: Ensuring the secure licensing and preventing piracy of high-value software remains a persistent concern for developers.
- Supply Chain Issues: For on-premises hardware, global supply chain disruptions can impact the availability and cost of necessary components.
Emerging Opportunities in Architectural Visualization Rendering Software
Emerging opportunities lie in the further integration of Artificial Intelligence (AI) for automated scene generation, lighting optimization, and predictive rendering capabilities, significantly reducing manual effort. The growing demand for sustainable architecture presents a niche for rendering software that can accurately visualize and quantify environmental performance metrics. Untapped markets in developing regions, where BIM adoption is gaining traction, offer significant growth potential. Furthermore, the evolution of real-time rendering engines is opening doors for interactive, live visualization experiences during client meetings and design charrettes, moving beyond static renders. The increasing use of game engines for architectural visualization, due to their real-time rendering capabilities and accessibility, presents both an opportunity and a competitive force.
Growth Accelerators in the Architectural Visualization Rendering Software Industry
Several factors are accelerating growth in the architectural visualization rendering software industry. The ongoing push for hyperrealism, driven by client expectations and competitive pressures, is a significant catalyst. Technological breakthroughs, such as advancements in GPU rendering, AI-driven workflows, and the democratization of accessible yet powerful software like Wings 3D and Blender, are lowering entry barriers and expanding the user base. Strategic partnerships between software developers and hardware manufacturers, or BIM software providers, are enhancing integration and performance. Furthermore, the increasing recognition of visualization as an essential part of the design process, rather than an add-on, is driving consistent investment and adoption across all firm sizes.
Key Players Shaping the Architectural Visualization Rendering Software Market
- Autodesk
- SketchUp (Trimble)
- Wings 3D
- KeyShot
- Foyr
- Blender
- OctaneRender (OTOY)
- Lumion
- Cinema 4D (Maxon Computer)
- ArchiCad (Graphisoft)
- V-Ray (Chaos Group)
- Artlantis
Notable Milestones in Architectural Visualization Rendering Software Sector
- 2019: Widespread adoption of GPU rendering becomes standard, significantly reducing rendering times.
- 2020: Introduction of AI-powered features for texture generation and scene optimization in several leading software packages.
- 2021: Increased integration of real-time ray tracing capabilities, offering unprecedented visual feedback during design.
- 2022: Growth in cloud-based rendering solutions, offering scalability and accessibility to SMEs.
- 2023: Advancements in VR/AR integration, enabling more immersive architectural walkthroughs and client experiences.
- 2024: Further development of AI for automated asset creation and intelligent lighting suggestions.
In-Depth Architectural Visualization Rendering Software Market Outlook
The architectural visualization rendering software market is set for sustained and robust growth, driven by an insatiable demand for increasingly realistic and immersive visual experiences. The forecast period of 2025–2033 indicates a CAGR of around 15.5%, with the market size projected to reach approximately $14,000 million by 2033. This optimistic outlook is underpinned by continuous technological innovation, particularly in AI and real-time rendering, which will further democratize access to high-fidelity visualizations. Strategic partnerships and the expansion of cloud-based services will accelerate adoption among SMEs, while large enterprises will continue to invest in advanced features for competitive advantage. The evolving nature of client expectations and the increasing integration of visualization into the entire design lifecycle will ensure its persistent relevance and growth.
Architectural Visualization Rendering Software Segmentation
-
1. Application
- 1.1. SMEs
- 1.2. Large Enterprises
-
2. Type
- 2.1. Cloud Based
- 2.2. On-premises
Architectural Visualization Rendering Software Segmentation By Geography
-
1. North America
- 1.1. United States
- 1.2. Canada
- 1.3. Mexico
-
2. South America
- 2.1. Brazil
- 2.2. Argentina
- 2.3. Rest of South America
-
3. Europe
- 3.1. United Kingdom
- 3.2. Germany
- 3.3. France
- 3.4. Italy
- 3.5. Spain
- 3.6. Russia
- 3.7. Benelux
- 3.8. Nordics
- 3.9. Rest of Europe
-
4. Middle East & Africa
- 4.1. Turkey
- 4.2. Israel
- 4.3. GCC
- 4.4. North Africa
- 4.5. South Africa
- 4.6. Rest of Middle East & Africa
-
5. Asia Pacific
- 5.1. China
- 5.2. India
- 5.3. Japan
- 5.4. South Korea
- 5.5. ASEAN
- 5.6. Oceania
- 5.7. Rest of Asia Pacific
Architectural Visualization Rendering Software REPORT HIGHLIGHTS
| Aspects | Details |
|---|---|
| Study Period | 2019-2033 |
| Base Year | 2024 |
| Estimated Year | 2025 |
| Forecast Period | 2025-2033 |
| Historical Period | 2019-2024 |
| Growth Rate | CAGR of 10.8% from 2019-2033 |
| Segmentation |
|
Table of Contents
- 1. Introduction
- 1.1. Research Scope
- 1.2. Market Segmentation
- 1.3. Research Methodology
- 1.4. Definitions and Assumptions
- 2. Executive Summary
- 2.1. Introduction
- 3. Market Dynamics
- 3.1. Introduction
- 3.2. Market Drivers
- 3.3. Market Restrains
- 3.4. Market Trends
- 4. Market Factor Analysis
- 4.1. Porters Five Forces
- 4.2. Supply/Value Chain
- 4.3. PESTEL analysis
- 4.4. Market Entropy
- 4.5. Patent/Trademark Analysis
- 5. Global Architectural Visualization Rendering Software Analysis, Insights and Forecast, 2019-2031
- 5.1. Market Analysis, Insights and Forecast - by Application
- 5.1.1. SMEs
- 5.1.2. Large Enterprises
- 5.2. Market Analysis, Insights and Forecast - by Type
- 5.2.1. Cloud Based
- 5.2.2. On-premises
- 5.3. Market Analysis, Insights and Forecast - by Region
- 5.3.1. North America
- 5.3.2. South America
- 5.3.3. Europe
- 5.3.4. Middle East & Africa
- 5.3.5. Asia Pacific
- 5.1. Market Analysis, Insights and Forecast - by Application
- 6. North America Architectural Visualization Rendering Software Analysis, Insights and Forecast, 2019-2031
- 6.1. Market Analysis, Insights and Forecast - by Application
- 6.1.1. SMEs
- 6.1.2. Large Enterprises
- 6.2. Market Analysis, Insights and Forecast - by Type
- 6.2.1. Cloud Based
- 6.2.2. On-premises
- 6.1. Market Analysis, Insights and Forecast - by Application
- 7. South America Architectural Visualization Rendering Software Analysis, Insights and Forecast, 2019-2031
- 7.1. Market Analysis, Insights and Forecast - by Application
- 7.1.1. SMEs
- 7.1.2. Large Enterprises
- 7.2. Market Analysis, Insights and Forecast - by Type
- 7.2.1. Cloud Based
- 7.2.2. On-premises
- 7.1. Market Analysis, Insights and Forecast - by Application
- 8. Europe Architectural Visualization Rendering Software Analysis, Insights and Forecast, 2019-2031
- 8.1. Market Analysis, Insights and Forecast - by Application
- 8.1.1. SMEs
- 8.1.2. Large Enterprises
- 8.2. Market Analysis, Insights and Forecast - by Type
- 8.2.1. Cloud Based
- 8.2.2. On-premises
- 8.1. Market Analysis, Insights and Forecast - by Application
- 9. Middle East & Africa Architectural Visualization Rendering Software Analysis, Insights and Forecast, 2019-2031
- 9.1. Market Analysis, Insights and Forecast - by Application
- 9.1.1. SMEs
- 9.1.2. Large Enterprises
- 9.2. Market Analysis, Insights and Forecast - by Type
- 9.2.1. Cloud Based
- 9.2.2. On-premises
- 9.1. Market Analysis, Insights and Forecast - by Application
- 10. Asia Pacific Architectural Visualization Rendering Software Analysis, Insights and Forecast, 2019-2031
- 10.1. Market Analysis, Insights and Forecast - by Application
- 10.1.1. SMEs
- 10.1.2. Large Enterprises
- 10.2. Market Analysis, Insights and Forecast - by Type
- 10.2.1. Cloud Based
- 10.2.2. On-premises
- 10.1. Market Analysis, Insights and Forecast - by Application
- 11. Competitive Analysis
- 11.1. Global Market Share Analysis 2024
- 11.2. Company Profiles
- 11.2.1 Autodesk
- 11.2.1.1. Overview
- 11.2.1.2. Products
- 11.2.1.3. SWOT Analysis
- 11.2.1.4. Recent Developments
- 11.2.1.5. Financials (Based on Availability)
- 11.2.2 SketchUp (Trimble)
- 11.2.2.1. Overview
- 11.2.2.2. Products
- 11.2.2.3. SWOT Analysis
- 11.2.2.4. Recent Developments
- 11.2.2.5. Financials (Based on Availability)
- 11.2.3 Wings 3D
- 11.2.3.1. Overview
- 11.2.3.2. Products
- 11.2.3.3. SWOT Analysis
- 11.2.3.4. Recent Developments
- 11.2.3.5. Financials (Based on Availability)
- 11.2.4 KeyShot
- 11.2.4.1. Overview
- 11.2.4.2. Products
- 11.2.4.3. SWOT Analysis
- 11.2.4.4. Recent Developments
- 11.2.4.5. Financials (Based on Availability)
- 11.2.5 Foyr
- 11.2.5.1. Overview
- 11.2.5.2. Products
- 11.2.5.3. SWOT Analysis
- 11.2.5.4. Recent Developments
- 11.2.5.5. Financials (Based on Availability)
- 11.2.6 Blender
- 11.2.6.1. Overview
- 11.2.6.2. Products
- 11.2.6.3. SWOT Analysis
- 11.2.6.4. Recent Developments
- 11.2.6.5. Financials (Based on Availability)
- 11.2.7 OctaneRender (OTOY)
- 11.2.7.1. Overview
- 11.2.7.2. Products
- 11.2.7.3. SWOT Analysis
- 11.2.7.4. Recent Developments
- 11.2.7.5. Financials (Based on Availability)
- 11.2.8 Lumion
- 11.2.8.1. Overview
- 11.2.8.2. Products
- 11.2.8.3. SWOT Analysis
- 11.2.8.4. Recent Developments
- 11.2.8.5. Financials (Based on Availability)
- 11.2.9 Cinema 4D (Maxon Computer)
- 11.2.9.1. Overview
- 11.2.9.2. Products
- 11.2.9.3. SWOT Analysis
- 11.2.9.4. Recent Developments
- 11.2.9.5. Financials (Based on Availability)
- 11.2.10 ArchiCad (Graphisoft)
- 11.2.10.1. Overview
- 11.2.10.2. Products
- 11.2.10.3. SWOT Analysis
- 11.2.10.4. Recent Developments
- 11.2.10.5. Financials (Based on Availability)
- 11.2.11 V-Ray (Chaos Group)
- 11.2.11.1. Overview
- 11.2.11.2. Products
- 11.2.11.3. SWOT Analysis
- 11.2.11.4. Recent Developments
- 11.2.11.5. Financials (Based on Availability)
- 11.2.12 Artlantis
- 11.2.12.1. Overview
- 11.2.12.2. Products
- 11.2.12.3. SWOT Analysis
- 11.2.12.4. Recent Developments
- 11.2.12.5. Financials (Based on Availability)
- 11.2.1 Autodesk
List of Figures
- Figure 1: Global Architectural Visualization Rendering Software Revenue Breakdown (million, %) by Region 2024 & 2032
- Figure 2: North America Architectural Visualization Rendering Software Revenue (million), by Application 2024 & 2032
- Figure 3: North America Architectural Visualization Rendering Software Revenue Share (%), by Application 2024 & 2032
- Figure 4: North America Architectural Visualization Rendering Software Revenue (million), by Type 2024 & 2032
- Figure 5: North America Architectural Visualization Rendering Software Revenue Share (%), by Type 2024 & 2032
- Figure 6: North America Architectural Visualization Rendering Software Revenue (million), by Country 2024 & 2032
- Figure 7: North America Architectural Visualization Rendering Software Revenue Share (%), by Country 2024 & 2032
- Figure 8: South America Architectural Visualization Rendering Software Revenue (million), by Application 2024 & 2032
- Figure 9: South America Architectural Visualization Rendering Software Revenue Share (%), by Application 2024 & 2032
- Figure 10: South America Architectural Visualization Rendering Software Revenue (million), by Type 2024 & 2032
- Figure 11: South America Architectural Visualization Rendering Software Revenue Share (%), by Type 2024 & 2032
- Figure 12: South America Architectural Visualization Rendering Software Revenue (million), by Country 2024 & 2032
- Figure 13: South America Architectural Visualization Rendering Software Revenue Share (%), by Country 2024 & 2032
- Figure 14: Europe Architectural Visualization Rendering Software Revenue (million), by Application 2024 & 2032
- Figure 15: Europe Architectural Visualization Rendering Software Revenue Share (%), by Application 2024 & 2032
- Figure 16: Europe Architectural Visualization Rendering Software Revenue (million), by Type 2024 & 2032
- Figure 17: Europe Architectural Visualization Rendering Software Revenue Share (%), by Type 2024 & 2032
- Figure 18: Europe Architectural Visualization Rendering Software Revenue (million), by Country 2024 & 2032
- Figure 19: Europe Architectural Visualization Rendering Software Revenue Share (%), by Country 2024 & 2032
- Figure 20: Middle East & Africa Architectural Visualization Rendering Software Revenue (million), by Application 2024 & 2032
- Figure 21: Middle East & Africa Architectural Visualization Rendering Software Revenue Share (%), by Application 2024 & 2032
- Figure 22: Middle East & Africa Architectural Visualization Rendering Software Revenue (million), by Type 2024 & 2032
- Figure 23: Middle East & Africa Architectural Visualization Rendering Software Revenue Share (%), by Type 2024 & 2032
- Figure 24: Middle East & Africa Architectural Visualization Rendering Software Revenue (million), by Country 2024 & 2032
- Figure 25: Middle East & Africa Architectural Visualization Rendering Software Revenue Share (%), by Country 2024 & 2032
- Figure 26: Asia Pacific Architectural Visualization Rendering Software Revenue (million), by Application 2024 & 2032
- Figure 27: Asia Pacific Architectural Visualization Rendering Software Revenue Share (%), by Application 2024 & 2032
- Figure 28: Asia Pacific Architectural Visualization Rendering Software Revenue (million), by Type 2024 & 2032
- Figure 29: Asia Pacific Architectural Visualization Rendering Software Revenue Share (%), by Type 2024 & 2032
- Figure 30: Asia Pacific Architectural Visualization Rendering Software Revenue (million), by Country 2024 & 2032
- Figure 31: Asia Pacific Architectural Visualization Rendering Software Revenue Share (%), by Country 2024 & 2032
List of Tables
- Table 1: Global Architectural Visualization Rendering Software Revenue million Forecast, by Region 2019 & 2032
- Table 2: Global Architectural Visualization Rendering Software Revenue million Forecast, by Application 2019 & 2032
- Table 3: Global Architectural Visualization Rendering Software Revenue million Forecast, by Type 2019 & 2032
- Table 4: Global Architectural Visualization Rendering Software Revenue million Forecast, by Region 2019 & 2032
- Table 5: Global Architectural Visualization Rendering Software Revenue million Forecast, by Application 2019 & 2032
- Table 6: Global Architectural Visualization Rendering Software Revenue million Forecast, by Type 2019 & 2032
- Table 7: Global Architectural Visualization Rendering Software Revenue million Forecast, by Country 2019 & 2032
- Table 8: United States Architectural Visualization Rendering Software Revenue (million) Forecast, by Application 2019 & 2032
- Table 9: Canada Architectural Visualization Rendering Software Revenue (million) Forecast, by Application 2019 & 2032
- Table 10: Mexico Architectural Visualization Rendering Software Revenue (million) Forecast, by Application 2019 & 2032
- Table 11: Global Architectural Visualization Rendering Software Revenue million Forecast, by Application 2019 & 2032
- Table 12: Global Architectural Visualization Rendering Software Revenue million Forecast, by Type 2019 & 2032
- Table 13: Global Architectural Visualization Rendering Software Revenue million Forecast, by Country 2019 & 2032
- Table 14: Brazil Architectural Visualization Rendering Software Revenue (million) Forecast, by Application 2019 & 2032
- Table 15: Argentina Architectural Visualization Rendering Software Revenue (million) Forecast, by Application 2019 & 2032
- Table 16: Rest of South America Architectural Visualization Rendering Software Revenue (million) Forecast, by Application 2019 & 2032
- Table 17: Global Architectural Visualization Rendering Software Revenue million Forecast, by Application 2019 & 2032
- Table 18: Global Architectural Visualization Rendering Software Revenue million Forecast, by Type 2019 & 2032
- Table 19: Global Architectural Visualization Rendering Software Revenue million Forecast, by Country 2019 & 2032
- Table 20: United Kingdom Architectural Visualization Rendering Software Revenue (million) Forecast, by Application 2019 & 2032
- Table 21: Germany Architectural Visualization Rendering Software Revenue (million) Forecast, by Application 2019 & 2032
- Table 22: France Architectural Visualization Rendering Software Revenue (million) Forecast, by Application 2019 & 2032
- Table 23: Italy Architectural Visualization Rendering Software Revenue (million) Forecast, by Application 2019 & 2032
- Table 24: Spain Architectural Visualization Rendering Software Revenue (million) Forecast, by Application 2019 & 2032
- Table 25: Russia Architectural Visualization Rendering Software Revenue (million) Forecast, by Application 2019 & 2032
- Table 26: Benelux Architectural Visualization Rendering Software Revenue (million) Forecast, by Application 2019 & 2032
- Table 27: Nordics Architectural Visualization Rendering Software Revenue (million) Forecast, by Application 2019 & 2032
- Table 28: Rest of Europe Architectural Visualization Rendering Software Revenue (million) Forecast, by Application 2019 & 2032
- Table 29: Global Architectural Visualization Rendering Software Revenue million Forecast, by Application 2019 & 2032
- Table 30: Global Architectural Visualization Rendering Software Revenue million Forecast, by Type 2019 & 2032
- Table 31: Global Architectural Visualization Rendering Software Revenue million Forecast, by Country 2019 & 2032
- Table 32: Turkey Architectural Visualization Rendering Software Revenue (million) Forecast, by Application 2019 & 2032
- Table 33: Israel Architectural Visualization Rendering Software Revenue (million) Forecast, by Application 2019 & 2032
- Table 34: GCC Architectural Visualization Rendering Software Revenue (million) Forecast, by Application 2019 & 2032
- Table 35: North Africa Architectural Visualization Rendering Software Revenue (million) Forecast, by Application 2019 & 2032
- Table 36: South Africa Architectural Visualization Rendering Software Revenue (million) Forecast, by Application 2019 & 2032
- Table 37: Rest of Middle East & Africa Architectural Visualization Rendering Software Revenue (million) Forecast, by Application 2019 & 2032
- Table 38: Global Architectural Visualization Rendering Software Revenue million Forecast, by Application 2019 & 2032
- Table 39: Global Architectural Visualization Rendering Software Revenue million Forecast, by Type 2019 & 2032
- Table 40: Global Architectural Visualization Rendering Software Revenue million Forecast, by Country 2019 & 2032
- Table 41: China Architectural Visualization Rendering Software Revenue (million) Forecast, by Application 2019 & 2032
- Table 42: India Architectural Visualization Rendering Software Revenue (million) Forecast, by Application 2019 & 2032
- Table 43: Japan Architectural Visualization Rendering Software Revenue (million) Forecast, by Application 2019 & 2032
- Table 44: South Korea Architectural Visualization Rendering Software Revenue (million) Forecast, by Application 2019 & 2032
- Table 45: ASEAN Architectural Visualization Rendering Software Revenue (million) Forecast, by Application 2019 & 2032
- Table 46: Oceania Architectural Visualization Rendering Software Revenue (million) Forecast, by Application 2019 & 2032
- Table 47: Rest of Asia Pacific Architectural Visualization Rendering Software Revenue (million) Forecast, by Application 2019 & 2032
Frequently Asked Questions
1. What is the projected Compound Annual Growth Rate (CAGR) of the Architectural Visualization Rendering Software?
The projected CAGR is approximately 10.8%.
2. Which companies are prominent players in the Architectural Visualization Rendering Software?
Key companies in the market include Autodesk, SketchUp (Trimble), Wings 3D, KeyShot, Foyr, Blender, OctaneRender (OTOY), Lumion, Cinema 4D (Maxon Computer), ArchiCad (Graphisoft), V-Ray (Chaos Group), Artlantis.
3. What are the main segments of the Architectural Visualization Rendering Software?
The market segments include Application, Type.
4. Can you provide details about the market size?
The market size is estimated to be USD 789 million as of 2022.
5. What are some drivers contributing to market growth?
N/A
6. What are the notable trends driving market growth?
N/A
7. Are there any restraints impacting market growth?
N/A
8. Can you provide examples of recent developments in the market?
N/A
9. What pricing options are available for accessing the report?
Pricing options include single-user, multi-user, and enterprise licenses priced at USD 4250.00, USD 6375.00, and USD 8500.00 respectively.
10. Is the market size provided in terms of value or volume?
The market size is provided in terms of value, measured in million.
11. Are there any specific market keywords associated with the report?
Yes, the market keyword associated with the report is "Architectural Visualization Rendering Software," which aids in identifying and referencing the specific market segment covered.
12. How do I determine which pricing option suits my needs best?
The pricing options vary based on user requirements and access needs. Individual users may opt for single-user licenses, while businesses requiring broader access may choose multi-user or enterprise licenses for cost-effective access to the report.
13. Are there any additional resources or data provided in the Architectural Visualization Rendering Software report?
While the report offers comprehensive insights, it's advisable to review the specific contents or supplementary materials provided to ascertain if additional resources or data are available.
14. How can I stay updated on further developments or reports in the Architectural Visualization Rendering Software?
To stay informed about further developments, trends, and reports in the Architectural Visualization Rendering Software, consider subscribing to industry newsletters, following relevant companies and organizations, or regularly checking reputable industry news sources and publications.
Methodology
Step 1 - Identification of Relevant Samples Size from Population Database


Step 2 - Approaches for Defining Global Market Size (Value, Volume* & Price*)

Note*: In applicable scenarios
Step 3 - Data Sources
Primary Research
- Web Analytics
- Survey Reports
- Research Institute
- Latest Research Reports
- Opinion Leaders
Secondary Research
- Annual Reports
- White Paper
- Latest Press Release
- Industry Association
- Paid Database
- Investor Presentations

Step 4 - Data Triangulation
Involves using different sources of information in order to increase the validity of a study
These sources are likely to be stakeholders in a program - participants, other researchers, program staff, other community members, and so on.
Then we put all data in single framework & apply various statistical tools to find out the dynamic on the market.
During the analysis stage, feedback from the stakeholder groups would be compared to determine areas of agreement as well as areas of divergence


