

Key Insights
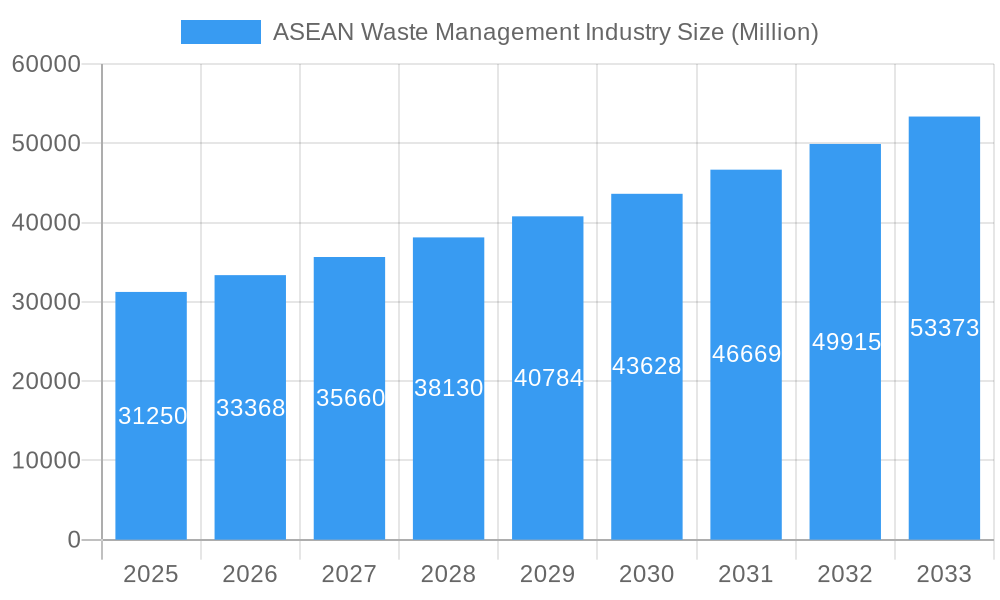
The ASEAN waste management industry, valued at $31.25 billion in 2025, is poised for substantial growth, exhibiting a Compound Annual Growth Rate (CAGR) of 6.74% from 2025 to 2033. This expansion is fueled by several key drivers. Rapid urbanization across the region leads to increased waste generation, demanding efficient and sustainable waste management solutions. Stringent government regulations aimed at improving environmental protection and promoting recycling are also playing a significant role. Growing environmental awareness among consumers and businesses is further driving demand for eco-friendly waste management practices. The industry is witnessing a shift towards innovative technologies, including advanced waste-to-energy solutions and smart waste management systems, enhancing efficiency and reducing environmental impact. Furthermore, the increasing adoption of public-private partnerships (PPPs) is attracting significant investment and fostering collaboration to address the region's waste management challenges. However, challenges remain, including a lack of infrastructure in certain areas, limited awareness about proper waste disposal practices in some communities, and the high cost of implementing advanced technologies in less developed regions.
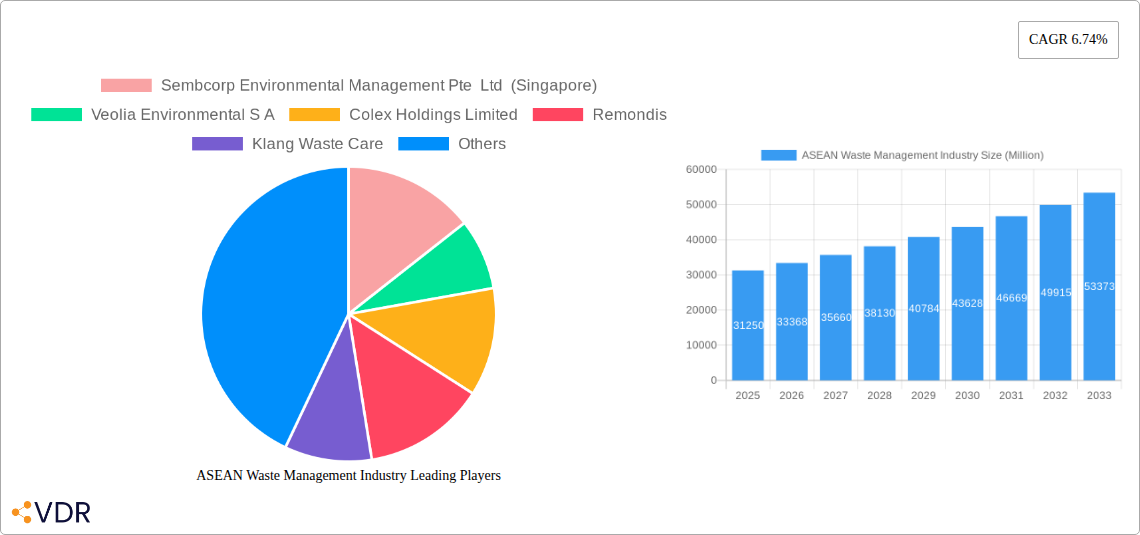
ASEAN Waste Management Industry Market Size (In Billion)
Despite these challenges, the ASEAN waste management market presents significant opportunities for both established players and new entrants. The diverse range of waste management services, encompassing collection, transportation, processing, recycling, and disposal, provides ample scope for specialization. Furthermore, the growing adoption of circular economy principles presents avenues for developing innovative business models focused on resource recovery and waste reduction. The market is segmented by waste type (municipal solid waste, industrial waste, hazardous waste), service type (collection, processing, disposal), and geography (countries within ASEAN). Key players in this dynamic landscape include Sembcorp Environmental Management Pte Ltd, Veolia Environmental S.A., Colex Holdings Limited, and Remondis, among others, actively competing to capture market share through strategic partnerships, technological advancements, and expansion into new markets within the region. The long-term outlook for the ASEAN waste management industry remains positive, driven by sustained economic growth, improving infrastructure, and a growing commitment to environmental sustainability.
ASEAN Waste Management Industry Company Market Share
ASEAN Waste Management Industry: A Comprehensive Market Report (2019-2033)
This in-depth report provides a comprehensive analysis of the ASEAN waste management industry, covering market dynamics, growth trends, key players, and future outlook. With a study period spanning 2019-2033, a base year of 2025, and a forecast period of 2025-2033, this report is an essential resource for industry professionals, investors, and policymakers seeking to navigate this rapidly evolving sector. The report incorporates data from the historical period (2019-2024) and leverages advanced analytical methodologies to deliver precise market sizing and forecasting.
Parent Market: Environmental Services Market in ASEAN Child Market: Waste Collection, Treatment, and Disposal
The report meticulously analyzes the market dynamics of the waste management industry in ASEAN by focusing on its sub-segments such as waste collection, recycling, waste-to-energy, and landfill management.
ASEAN Waste Management Industry Market Dynamics & Structure
The ASEAN waste management market is characterized by a fragmented landscape with a mix of large multinational corporations and smaller local players. Market concentration is moderate, with the top five players holding an estimated xx% market share in 2025. Technological innovation is a key driver, with increasing adoption of advanced waste treatment technologies such as anaerobic digestion and waste-to-energy solutions. Stringent government regulations, including those focusing on landfill diversion and extended producer responsibility (EPR), are shaping industry practices. The market also faces competition from substitute technologies, such as incineration versus recycling. End-user demographics are diverse, encompassing residential, commercial, and industrial sectors, each with unique waste generation patterns. Mergers and acquisitions (M&A) activity is moderate, driven by the need for expansion and technological capabilities.
- Market Concentration: Moderate, top 5 players holding xx% market share (2025).
- Technological Innovation: Strong focus on waste-to-energy, anaerobic digestion, and advanced recycling technologies.
- Regulatory Framework: Stringent regulations promoting landfill diversion and EPR schemes.
- Competitive Substitutes: Incineration, composting, etc., compete with traditional methods.
- End-User Demographics: Diverse mix of residential, commercial, and industrial sectors.
- M&A Trends: Moderate activity, driven by expansion and technology acquisition.
ASEAN Waste Management Industry Growth Trends & Insights
The ASEAN waste management market is experiencing robust growth, driven by increasing urbanization, rising waste generation, and growing environmental awareness. The market size is projected to reach xx million units by 2033, registering a CAGR of xx% during the forecast period. Adoption rates of advanced waste management technologies are increasing, reflecting a shift towards sustainable waste management practices. Technological disruptions, such as AI-powered waste sorting and smart bin systems, are transforming the industry. Consumer behavior is evolving, with a greater emphasis on recycling and waste reduction.
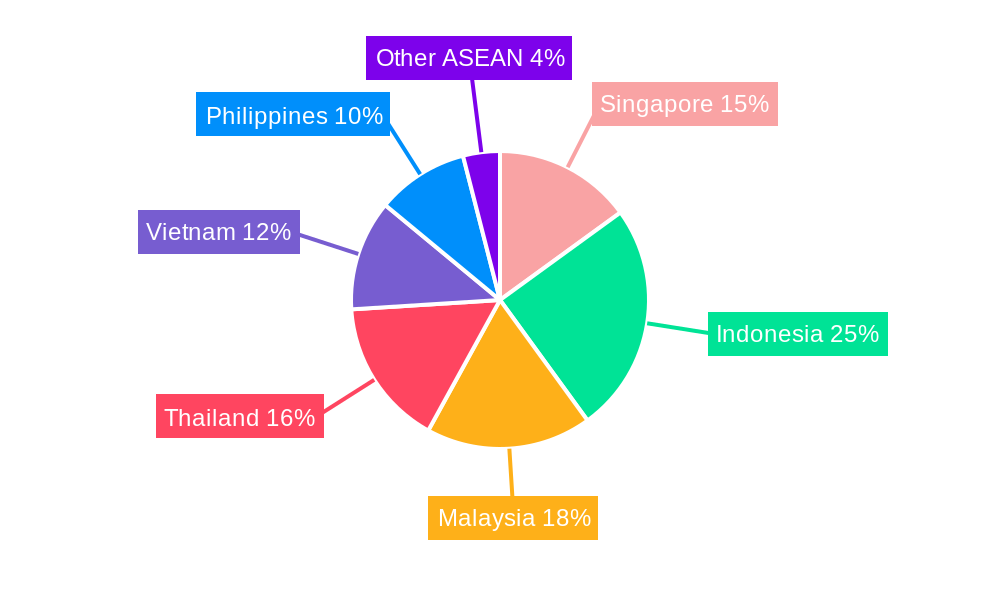
Dominant Regions, Countries, or Segments in ASEAN Waste Management Industry
Singapore, Indonesia, and Malaysia are currently the dominant markets within ASEAN, driven by factors such as higher waste generation, robust infrastructure development, and supportive government policies. These countries represent a significant share of the overall market, estimated at xx% in 2025.
- Singapore: Strong government support, advanced infrastructure, high recycling rates.
- Indonesia: Large population, rapidly growing economy, increasing waste generation.
- Malaysia: Growing industrial sector, rising environmental awareness.
- Thailand: Increasing urbanization, government initiatives promoting waste management.
- Vietnam: Rapid economic growth, increasing focus on sustainable waste solutions.
The waste-to-energy segment demonstrates high growth potential due to increasing energy demands and stringent landfill regulations.
ASEAN Waste Management Industry Product Landscape
The ASEAN waste management industry showcases a diverse product landscape encompassing waste collection vehicles, sorting equipment, recycling technologies, and waste-to-energy plants. Recent innovations include AI-powered waste sorting systems, improving efficiency and accuracy in material recovery. These advancements offer unique selling propositions such as increased efficiency, reduced operational costs, and environmental benefits.
Key Drivers, Barriers & Challenges in ASEAN Waste Management Industry
Key Drivers:
- Rising urbanization and increasing waste generation.
- Growing environmental awareness and stricter government regulations.
- Technological advancements in waste management solutions.
- Increasing investment in waste-to-energy projects.
Challenges:
- Lack of infrastructure in certain regions.
- Limited public awareness and participation in recycling programs.
- High upfront costs associated with advanced technologies.
- Regulatory inconsistencies across different countries.
- Supply chain disruptions, affecting the procurement of raw materials and equipment. This has resulted in a xx% increase in operational costs for some companies in 2024.
Emerging Opportunities in ASEAN Waste Management Industry
The ASEAN waste management industry presents significant untapped opportunities, particularly in the areas of plastic waste recycling, organic waste composting, and the development of circular economy models. Innovative applications of technology, such as blockchain for waste tracking and IoT for smart waste management, offer immense potential. The increasing consumer demand for sustainable and eco-friendly products further fuels the growth of the sector.
Growth Accelerators in the ASEAN Waste Management Industry
Technological breakthroughs in waste sorting, treatment, and recycling are driving long-term growth. Strategic partnerships between public and private sectors are fostering infrastructure development and promoting innovation. Market expansion into less developed regions with high waste generation potential provides significant growth opportunities.
Key Players Shaping the ASEAN Waste Management Industry Market
- Sembcorp Environmental Management Pte Ltd (Singapore)
- Veolia Environmental S A
- Colex Holdings Limited
- Remondis
- Klang Waste Care
- Starpal Pte Ltd
- Blue Planet Environmental Solutions
- Greenway Environmental
- PT Prasadha Pamunah Limbah Industri - PPLI
- Boon Poh Refuse Disposal Pte Ltd
- Suez Environment
- Earth Recycling Services Ltd
- ALBA Group Asia
- Se Cure Waste Management
Notable Milestones in ASEAN Waste Management Industry Sector
- June 2022: PT Prasadha Pamunah Waste Industries (PPLI) established a representative office in the Wijayakusuma Industrial Area, Indonesia, signifying expansion into a key market.
- December 2022: The Rebottle initiative between Singapore Polytechnic (SP) and SembWaste aims to boost PET bottle recycling in Singapore, demonstrating a commitment to sustainable practices and technological innovation.
In-Depth ASEAN Waste Management Industry Market Outlook
The ASEAN waste management market is poised for significant growth in the coming years, fueled by strong economic growth, increasing urbanization, and a growing focus on environmental sustainability. Strategic investments in infrastructure development, technological advancements, and public-private partnerships will be crucial to unlocking the sector's full potential. Companies focusing on innovative solutions, efficient operations, and sustainable practices are well-positioned to capture significant market share and drive the transformation of the waste management landscape in ASEAN.
ASEAN Waste Management Industry Segmentation
-
1. Waste type
- 1.1. Industrial waste
- 1.2. Municipal solid waste
- 1.3. E-waste
- 1.4. Other Waste types
-
2. Disposal methods
- 2.1. Collection
- 2.2. Landfill
- 2.3. Others
-
3. Geography
- 3.1. Indonesia
- 3.2. Thailand
- 3.3. Malaysia
- 3.4. Singapore
- 3.5. Rest of ASEAN
ASEAN Waste Management Industry Segmentation By Geography
- 1. Indonesia
- 2. Thailand
- 3. Malaysia
- 4. Singapore
- 5. Rest of ASEAN
ASEAN Waste Management Industry Regional Market Share
Geographic Coverage of ASEAN Waste Management Industry
ASEAN Waste Management Industry REPORT HIGHLIGHTS
| Aspects | Details |
|---|---|
| Study Period | 2020-2034 |
| Base Year | 2025 |
| Estimated Year | 2026 |
| Forecast Period | 2026-2034 |
| Historical Period | 2020-2025 |
| Growth Rate | CAGR of 6.74% from 2020-2034 |
| Segmentation |
|
Table of Contents
- 1. Introduction
- 1.1. Research Scope
- 1.2. Market Segmentation
- 1.3. Research Objective
- 1.4. Definitions and Assumptions
- 2. Executive Summary
- 2.1. Market Snapshot
- 3. Market Dynamics
- 3.1. Market Drivers
- 3.2. Market Restrains
- 3.3. Market Trends
- 3.4. Market Opportunities
- 4. Market Factor Analysis
- 4.1. Porters Five Forces
- 4.1.1. Bargaining Power of Suppliers
- 4.1.2. Bargaining Power of Buyers
- 4.1.3. Threat of New Entrants
- 4.1.4. Threat of Substitutes
- 4.1.5. Competitive Rivalry
- 4.2. PESTEL analysis
- 4.3. BCG Analysis
- 4.3.1. Stars (High Growth, High Market Share)
- 4.3.2. Cash Cows (Low Growth, High Market Share)
- 4.3.3. Question Mark (High Growth, Low Market Share)
- 4.3.4. Dogs (Low Growth, Low Market Share)
- 4.4. Ansoff Matrix Analysis
- 4.5. Supply Chain Analysis
- 4.6. Regulatory Landscape
- 4.7. Current Market Potential and Opportunity Assessment (TAM–SAM–SOM Framework)
- 4.8. VDR Analyst Note
- 4.1. Porters Five Forces
- 5. Market Analysis, Insights and Forecast 2021-2033
- 5.1. Market Analysis, Insights and Forecast - by Waste type
- 5.1.1. Industrial waste
- 5.1.2. Municipal solid waste
- 5.1.3. E-waste
- 5.1.4. Other Waste types
- 5.2. Market Analysis, Insights and Forecast - by Disposal methods
- 5.2.1. Collection
- 5.2.2. Landfill
- 5.2.3. Others
- 5.3. Market Analysis, Insights and Forecast - by Geography
- 5.3.1. Indonesia
- 5.3.2. Thailand
- 5.3.3. Malaysia
- 5.3.4. Singapore
- 5.3.5. Rest of ASEAN
- 5.4. Market Analysis, Insights and Forecast - by Region
- 5.4.1. Indonesia
- 5.4.2. Thailand
- 5.4.3. Malaysia
- 5.4.4. Singapore
- 5.4.5. Rest of ASEAN
- 5.1. Market Analysis, Insights and Forecast - by Waste type
- 6. Global ASEAN Waste Management Industry Analysis, Insights and Forecast, 2021-2033
- 6.1. Market Analysis, Insights and Forecast - by Waste type
- 6.1.1. Industrial waste
- 6.1.2. Municipal solid waste
- 6.1.3. E-waste
- 6.1.4. Other Waste types
- 6.2. Market Analysis, Insights and Forecast - by Disposal methods
- 6.2.1. Collection
- 6.2.2. Landfill
- 6.2.3. Others
- 6.3. Market Analysis, Insights and Forecast - by Geography
- 6.3.1. Indonesia
- 6.3.2. Thailand
- 6.3.3. Malaysia
- 6.3.4. Singapore
- 6.3.5. Rest of ASEAN
- 6.1. Market Analysis, Insights and Forecast - by Waste type
- 7. Indonesia ASEAN Waste Management Industry Analysis, Insights and Forecast, 2021-2033
- 7.1. Market Analysis, Insights and Forecast - by Waste type
- 7.1.1. Industrial waste
- 7.1.2. Municipal solid waste
- 7.1.3. E-waste
- 7.1.4. Other Waste types
- 7.2. Market Analysis, Insights and Forecast - by Disposal methods
- 7.2.1. Collection
- 7.2.2. Landfill
- 7.2.3. Others
- 7.3. Market Analysis, Insights and Forecast - by Geography
- 7.3.1. Indonesia
- 7.3.2. Thailand
- 7.3.3. Malaysia
- 7.3.4. Singapore
- 7.3.5. Rest of ASEAN
- 7.1. Market Analysis, Insights and Forecast - by Waste type
- 8. Thailand ASEAN Waste Management Industry Analysis, Insights and Forecast, 2021-2033
- 8.1. Market Analysis, Insights and Forecast - by Waste type
- 8.1.1. Industrial waste
- 8.1.2. Municipal solid waste
- 8.1.3. E-waste
- 8.1.4. Other Waste types
- 8.2. Market Analysis, Insights and Forecast - by Disposal methods
- 8.2.1. Collection
- 8.2.2. Landfill
- 8.2.3. Others
- 8.3. Market Analysis, Insights and Forecast - by Geography
- 8.3.1. Indonesia
- 8.3.2. Thailand
- 8.3.3. Malaysia
- 8.3.4. Singapore
- 8.3.5. Rest of ASEAN
- 8.1. Market Analysis, Insights and Forecast - by Waste type
- 9. Malaysia ASEAN Waste Management Industry Analysis, Insights and Forecast, 2021-2033
- 9.1. Market Analysis, Insights and Forecast - by Waste type
- 9.1.1. Industrial waste
- 9.1.2. Municipal solid waste
- 9.1.3. E-waste
- 9.1.4. Other Waste types
- 9.2. Market Analysis, Insights and Forecast - by Disposal methods
- 9.2.1. Collection
- 9.2.2. Landfill
- 9.2.3. Others
- 9.3. Market Analysis, Insights and Forecast - by Geography
- 9.3.1. Indonesia
- 9.3.2. Thailand
- 9.3.3. Malaysia
- 9.3.4. Singapore
- 9.3.5. Rest of ASEAN
- 9.1. Market Analysis, Insights and Forecast - by Waste type
- 10. Singapore ASEAN Waste Management Industry Analysis, Insights and Forecast, 2021-2033
- 10.1. Market Analysis, Insights and Forecast - by Waste type
- 10.1.1. Industrial waste
- 10.1.2. Municipal solid waste
- 10.1.3. E-waste
- 10.1.4. Other Waste types
- 10.2. Market Analysis, Insights and Forecast - by Disposal methods
- 10.2.1. Collection
- 10.2.2. Landfill
- 10.2.3. Others
- 10.3. Market Analysis, Insights and Forecast - by Geography
- 10.3.1. Indonesia
- 10.3.2. Thailand
- 10.3.3. Malaysia
- 10.3.4. Singapore
- 10.3.5. Rest of ASEAN
- 10.1. Market Analysis, Insights and Forecast - by Waste type
- 11. Rest of ASEAN ASEAN Waste Management Industry Analysis, Insights and Forecast, 2021-2033
- 11.1. Market Analysis, Insights and Forecast - by Waste type
- 11.1.1. Industrial waste
- 11.1.2. Municipal solid waste
- 11.1.3. E-waste
- 11.1.4. Other Waste types
- 11.2. Market Analysis, Insights and Forecast - by Disposal methods
- 11.2.1. Collection
- 11.2.2. Landfill
- 11.2.3. Others
- 11.3. Market Analysis, Insights and Forecast - by Geography
- 11.3.1. Indonesia
- 11.3.2. Thailand
- 11.3.3. Malaysia
- 11.3.4. Singapore
- 11.3.5. Rest of ASEAN
- 11.1. Market Analysis, Insights and Forecast - by Waste type
- 12. Competitive Analysis
- 12.1. Company Profiles
- 12.1.1 Sembcorp Environmental Management Pte Ltd (Singapore)
- 12.1.1.1. Company Overview
- 12.1.1.2. Products
- 12.1.1.3. Company Financials
- 12.1.1.4. SWOT Analysis
- 12.1.2 Veolia Environmental S A
- 12.1.2.1. Company Overview
- 12.1.2.2. Products
- 12.1.2.3. Company Financials
- 12.1.2.4. SWOT Analysis
- 12.1.3 Colex Holdings Limited
- 12.1.3.1. Company Overview
- 12.1.3.2. Products
- 12.1.3.3. Company Financials
- 12.1.3.4. SWOT Analysis
- 12.1.4 Remondis
- 12.1.4.1. Company Overview
- 12.1.4.2. Products
- 12.1.4.3. Company Financials
- 12.1.4.4. SWOT Analysis
- 12.1.5 Klang Waste Care
- 12.1.5.1. Company Overview
- 12.1.5.2. Products
- 12.1.5.3. Company Financials
- 12.1.5.4. SWOT Analysis
- 12.1.6 Starpal Pte Ltd
- 12.1.6.1. Company Overview
- 12.1.6.2. Products
- 12.1.6.3. Company Financials
- 12.1.6.4. SWOT Analysis
- 12.1.7 Blue Planet Environmental Solutions
- 12.1.7.1. Company Overview
- 12.1.7.2. Products
- 12.1.7.3. Company Financials
- 12.1.7.4. SWOT Analysis
- 12.1.8 Greenway Environmental
- 12.1.8.1. Company Overview
- 12.1.8.2. Products
- 12.1.8.3. Company Financials
- 12.1.8.4. SWOT Analysis
- 12.1.9 PT Prasadha Pamunah Limbah Industri - PPLI
- 12.1.9.1. Company Overview
- 12.1.9.2. Products
- 12.1.9.3. Company Financials
- 12.1.9.4. SWOT Analysis
- 12.1.10 Boon Poh Refuse Disposal Pte Ltd
- 12.1.10.1. Company Overview
- 12.1.10.2. Products
- 12.1.10.3. Company Financials
- 12.1.10.4. SWOT Analysis
- 12.1.11 Suez Environment
- 12.1.11.1. Company Overview
- 12.1.11.2. Products
- 12.1.11.3. Company Financials
- 12.1.11.4. SWOT Analysis
- 12.1.12 Earth Recycling Services Ltd
- 12.1.12.1. Company Overview
- 12.1.12.2. Products
- 12.1.12.3. Company Financials
- 12.1.12.4. SWOT Analysis
- 12.1.13 ALBA Group Asia
- 12.1.13.1. Company Overview
- 12.1.13.2. Products
- 12.1.13.3. Company Financials
- 12.1.13.4. SWOT Analysis
- 12.1.14 Se Cure Waste Management**List Not Exhaustive
- 12.1.14.1. Company Overview
- 12.1.14.2. Products
- 12.1.14.3. Company Financials
- 12.1.14.4. SWOT Analysis
- 12.1.1 Sembcorp Environmental Management Pte Ltd (Singapore)
- 12.2. Market Entropy
- 12.2.1 Company's Key Areas Served
- 12.2.2 Recent Developments
- 12.3. Company Market Share Analysis 2025
- 12.3.1 Top 5 Companies Market Share Analysis
- 12.3.2 Top 3 Companies Market Share Analysis
- 12.4. List of Potential Customers
- 13. Research Methodology
List of Figures
- Figure 1: Global ASEAN Waste Management Industry Revenue Breakdown (Million, %) by Region 2025 & 2033
- Figure 2: Global ASEAN Waste Management Industry Volume Breakdown (Billion, %) by Region 2025 & 2033
- Figure 3: Indonesia ASEAN Waste Management Industry Revenue (Million), by Waste type 2025 & 2033
- Figure 4: Indonesia ASEAN Waste Management Industry Volume (Billion), by Waste type 2025 & 2033
- Figure 5: Indonesia ASEAN Waste Management Industry Revenue Share (%), by Waste type 2025 & 2033
- Figure 6: Indonesia ASEAN Waste Management Industry Volume Share (%), by Waste type 2025 & 2033
- Figure 7: Indonesia ASEAN Waste Management Industry Revenue (Million), by Disposal methods 2025 & 2033
- Figure 8: Indonesia ASEAN Waste Management Industry Volume (Billion), by Disposal methods 2025 & 2033
- Figure 9: Indonesia ASEAN Waste Management Industry Revenue Share (%), by Disposal methods 2025 & 2033
- Figure 10: Indonesia ASEAN Waste Management Industry Volume Share (%), by Disposal methods 2025 & 2033
- Figure 11: Indonesia ASEAN Waste Management Industry Revenue (Million), by Geography 2025 & 2033
- Figure 12: Indonesia ASEAN Waste Management Industry Volume (Billion), by Geography 2025 & 2033
- Figure 13: Indonesia ASEAN Waste Management Industry Revenue Share (%), by Geography 2025 & 2033
- Figure 14: Indonesia ASEAN Waste Management Industry Volume Share (%), by Geography 2025 & 2033
- Figure 15: Indonesia ASEAN Waste Management Industry Revenue (Million), by Country 2025 & 2033
- Figure 16: Indonesia ASEAN Waste Management Industry Volume (Billion), by Country 2025 & 2033
- Figure 17: Indonesia ASEAN Waste Management Industry Revenue Share (%), by Country 2025 & 2033
- Figure 18: Indonesia ASEAN Waste Management Industry Volume Share (%), by Country 2025 & 2033
- Figure 19: Thailand ASEAN Waste Management Industry Revenue (Million), by Waste type 2025 & 2033
- Figure 20: Thailand ASEAN Waste Management Industry Volume (Billion), by Waste type 2025 & 2033
- Figure 21: Thailand ASEAN Waste Management Industry Revenue Share (%), by Waste type 2025 & 2033
- Figure 22: Thailand ASEAN Waste Management Industry Volume Share (%), by Waste type 2025 & 2033
- Figure 23: Thailand ASEAN Waste Management Industry Revenue (Million), by Disposal methods 2025 & 2033
- Figure 24: Thailand ASEAN Waste Management Industry Volume (Billion), by Disposal methods 2025 & 2033
- Figure 25: Thailand ASEAN Waste Management Industry Revenue Share (%), by Disposal methods 2025 & 2033
- Figure 26: Thailand ASEAN Waste Management Industry Volume Share (%), by Disposal methods 2025 & 2033
- Figure 27: Thailand ASEAN Waste Management Industry Revenue (Million), by Geography 2025 & 2033
- Figure 28: Thailand ASEAN Waste Management Industry Volume (Billion), by Geography 2025 & 2033
- Figure 29: Thailand ASEAN Waste Management Industry Revenue Share (%), by Geography 2025 & 2033
- Figure 30: Thailand ASEAN Waste Management Industry Volume Share (%), by Geography 2025 & 2033
- Figure 31: Thailand ASEAN Waste Management Industry Revenue (Million), by Country 2025 & 2033
- Figure 32: Thailand ASEAN Waste Management Industry Volume (Billion), by Country 2025 & 2033
- Figure 33: Thailand ASEAN Waste Management Industry Revenue Share (%), by Country 2025 & 2033
- Figure 34: Thailand ASEAN Waste Management Industry Volume Share (%), by Country 2025 & 2033
- Figure 35: Malaysia ASEAN Waste Management Industry Revenue (Million), by Waste type 2025 & 2033
- Figure 36: Malaysia ASEAN Waste Management Industry Volume (Billion), by Waste type 2025 & 2033
- Figure 37: Malaysia ASEAN Waste Management Industry Revenue Share (%), by Waste type 2025 & 2033
- Figure 38: Malaysia ASEAN Waste Management Industry Volume Share (%), by Waste type 2025 & 2033
- Figure 39: Malaysia ASEAN Waste Management Industry Revenue (Million), by Disposal methods 2025 & 2033
- Figure 40: Malaysia ASEAN Waste Management Industry Volume (Billion), by Disposal methods 2025 & 2033
- Figure 41: Malaysia ASEAN Waste Management Industry Revenue Share (%), by Disposal methods 2025 & 2033
- Figure 42: Malaysia ASEAN Waste Management Industry Volume Share (%), by Disposal methods 2025 & 2033
- Figure 43: Malaysia ASEAN Waste Management Industry Revenue (Million), by Geography 2025 & 2033
- Figure 44: Malaysia ASEAN Waste Management Industry Volume (Billion), by Geography 2025 & 2033
- Figure 45: Malaysia ASEAN Waste Management Industry Revenue Share (%), by Geography 2025 & 2033
- Figure 46: Malaysia ASEAN Waste Management Industry Volume Share (%), by Geography 2025 & 2033
- Figure 47: Malaysia ASEAN Waste Management Industry Revenue (Million), by Country 2025 & 2033
- Figure 48: Malaysia ASEAN Waste Management Industry Volume (Billion), by Country 2025 & 2033
- Figure 49: Malaysia ASEAN Waste Management Industry Revenue Share (%), by Country 2025 & 2033
- Figure 50: Malaysia ASEAN Waste Management Industry Volume Share (%), by Country 2025 & 2033
- Figure 51: Singapore ASEAN Waste Management Industry Revenue (Million), by Waste type 2025 & 2033
- Figure 52: Singapore ASEAN Waste Management Industry Volume (Billion), by Waste type 2025 & 2033
- Figure 53: Singapore ASEAN Waste Management Industry Revenue Share (%), by Waste type 2025 & 2033
- Figure 54: Singapore ASEAN Waste Management Industry Volume Share (%), by Waste type 2025 & 2033
- Figure 55: Singapore ASEAN Waste Management Industry Revenue (Million), by Disposal methods 2025 & 2033
- Figure 56: Singapore ASEAN Waste Management Industry Volume (Billion), by Disposal methods 2025 & 2033
- Figure 57: Singapore ASEAN Waste Management Industry Revenue Share (%), by Disposal methods 2025 & 2033
- Figure 58: Singapore ASEAN Waste Management Industry Volume Share (%), by Disposal methods 2025 & 2033
- Figure 59: Singapore ASEAN Waste Management Industry Revenue (Million), by Geography 2025 & 2033
- Figure 60: Singapore ASEAN Waste Management Industry Volume (Billion), by Geography 2025 & 2033
- Figure 61: Singapore ASEAN Waste Management Industry Revenue Share (%), by Geography 2025 & 2033
- Figure 62: Singapore ASEAN Waste Management Industry Volume Share (%), by Geography 2025 & 2033
- Figure 63: Singapore ASEAN Waste Management Industry Revenue (Million), by Country 2025 & 2033
- Figure 64: Singapore ASEAN Waste Management Industry Volume (Billion), by Country 2025 & 2033
- Figure 65: Singapore ASEAN Waste Management Industry Revenue Share (%), by Country 2025 & 2033
- Figure 66: Singapore ASEAN Waste Management Industry Volume Share (%), by Country 2025 & 2033
- Figure 67: Rest of ASEAN ASEAN Waste Management Industry Revenue (Million), by Waste type 2025 & 2033
- Figure 68: Rest of ASEAN ASEAN Waste Management Industry Volume (Billion), by Waste type 2025 & 2033
- Figure 69: Rest of ASEAN ASEAN Waste Management Industry Revenue Share (%), by Waste type 2025 & 2033
- Figure 70: Rest of ASEAN ASEAN Waste Management Industry Volume Share (%), by Waste type 2025 & 2033
- Figure 71: Rest of ASEAN ASEAN Waste Management Industry Revenue (Million), by Disposal methods 2025 & 2033
- Figure 72: Rest of ASEAN ASEAN Waste Management Industry Volume (Billion), by Disposal methods 2025 & 2033
- Figure 73: Rest of ASEAN ASEAN Waste Management Industry Revenue Share (%), by Disposal methods 2025 & 2033
- Figure 74: Rest of ASEAN ASEAN Waste Management Industry Volume Share (%), by Disposal methods 2025 & 2033
- Figure 75: Rest of ASEAN ASEAN Waste Management Industry Revenue (Million), by Geography 2025 & 2033
- Figure 76: Rest of ASEAN ASEAN Waste Management Industry Volume (Billion), by Geography 2025 & 2033
- Figure 77: Rest of ASEAN ASEAN Waste Management Industry Revenue Share (%), by Geography 2025 & 2033
- Figure 78: Rest of ASEAN ASEAN Waste Management Industry Volume Share (%), by Geography 2025 & 2033
- Figure 79: Rest of ASEAN ASEAN Waste Management Industry Revenue (Million), by Country 2025 & 2033
- Figure 80: Rest of ASEAN ASEAN Waste Management Industry Volume (Billion), by Country 2025 & 2033
- Figure 81: Rest of ASEAN ASEAN Waste Management Industry Revenue Share (%), by Country 2025 & 2033
- Figure 82: Rest of ASEAN ASEAN Waste Management Industry Volume Share (%), by Country 2025 & 2033
List of Tables
- Table 1: Global ASEAN Waste Management Industry Revenue Million Forecast, by Waste type 2020 & 2033
- Table 2: Global ASEAN Waste Management Industry Volume Billion Forecast, by Waste type 2020 & 2033
- Table 3: Global ASEAN Waste Management Industry Revenue Million Forecast, by Disposal methods 2020 & 2033
- Table 4: Global ASEAN Waste Management Industry Volume Billion Forecast, by Disposal methods 2020 & 2033
- Table 5: Global ASEAN Waste Management Industry Revenue Million Forecast, by Geography 2020 & 2033
- Table 6: Global ASEAN Waste Management Industry Volume Billion Forecast, by Geography 2020 & 2033
- Table 7: Global ASEAN Waste Management Industry Revenue Million Forecast, by Region 2020 & 2033
- Table 8: Global ASEAN Waste Management Industry Volume Billion Forecast, by Region 2020 & 2033
- Table 9: Global ASEAN Waste Management Industry Revenue Million Forecast, by Waste type 2020 & 2033
- Table 10: Global ASEAN Waste Management Industry Volume Billion Forecast, by Waste type 2020 & 2033
- Table 11: Global ASEAN Waste Management Industry Revenue Million Forecast, by Disposal methods 2020 & 2033
- Table 12: Global ASEAN Waste Management Industry Volume Billion Forecast, by Disposal methods 2020 & 2033
- Table 13: Global ASEAN Waste Management Industry Revenue Million Forecast, by Geography 2020 & 2033
- Table 14: Global ASEAN Waste Management Industry Volume Billion Forecast, by Geography 2020 & 2033
- Table 15: Global ASEAN Waste Management Industry Revenue Million Forecast, by Country 2020 & 2033
- Table 16: Global ASEAN Waste Management Industry Volume Billion Forecast, by Country 2020 & 2033
- Table 17: Global ASEAN Waste Management Industry Revenue Million Forecast, by Waste type 2020 & 2033
- Table 18: Global ASEAN Waste Management Industry Volume Billion Forecast, by Waste type 2020 & 2033
- Table 19: Global ASEAN Waste Management Industry Revenue Million Forecast, by Disposal methods 2020 & 2033
- Table 20: Global ASEAN Waste Management Industry Volume Billion Forecast, by Disposal methods 2020 & 2033
- Table 21: Global ASEAN Waste Management Industry Revenue Million Forecast, by Geography 2020 & 2033
- Table 22: Global ASEAN Waste Management Industry Volume Billion Forecast, by Geography 2020 & 2033
- Table 23: Global ASEAN Waste Management Industry Revenue Million Forecast, by Country 2020 & 2033
- Table 24: Global ASEAN Waste Management Industry Volume Billion Forecast, by Country 2020 & 2033
- Table 25: Global ASEAN Waste Management Industry Revenue Million Forecast, by Waste type 2020 & 2033
- Table 26: Global ASEAN Waste Management Industry Volume Billion Forecast, by Waste type 2020 & 2033
- Table 27: Global ASEAN Waste Management Industry Revenue Million Forecast, by Disposal methods 2020 & 2033
- Table 28: Global ASEAN Waste Management Industry Volume Billion Forecast, by Disposal methods 2020 & 2033
- Table 29: Global ASEAN Waste Management Industry Revenue Million Forecast, by Geography 2020 & 2033
- Table 30: Global ASEAN Waste Management Industry Volume Billion Forecast, by Geography 2020 & 2033
- Table 31: Global ASEAN Waste Management Industry Revenue Million Forecast, by Country 2020 & 2033
- Table 32: Global ASEAN Waste Management Industry Volume Billion Forecast, by Country 2020 & 2033
- Table 33: Global ASEAN Waste Management Industry Revenue Million Forecast, by Waste type 2020 & 2033
- Table 34: Global ASEAN Waste Management Industry Volume Billion Forecast, by Waste type 2020 & 2033
- Table 35: Global ASEAN Waste Management Industry Revenue Million Forecast, by Disposal methods 2020 & 2033
- Table 36: Global ASEAN Waste Management Industry Volume Billion Forecast, by Disposal methods 2020 & 2033
- Table 37: Global ASEAN Waste Management Industry Revenue Million Forecast, by Geography 2020 & 2033
- Table 38: Global ASEAN Waste Management Industry Volume Billion Forecast, by Geography 2020 & 2033
- Table 39: Global ASEAN Waste Management Industry Revenue Million Forecast, by Country 2020 & 2033
- Table 40: Global ASEAN Waste Management Industry Volume Billion Forecast, by Country 2020 & 2033
- Table 41: Global ASEAN Waste Management Industry Revenue Million Forecast, by Waste type 2020 & 2033
- Table 42: Global ASEAN Waste Management Industry Volume Billion Forecast, by Waste type 2020 & 2033
- Table 43: Global ASEAN Waste Management Industry Revenue Million Forecast, by Disposal methods 2020 & 2033
- Table 44: Global ASEAN Waste Management Industry Volume Billion Forecast, by Disposal methods 2020 & 2033
- Table 45: Global ASEAN Waste Management Industry Revenue Million Forecast, by Geography 2020 & 2033
- Table 46: Global ASEAN Waste Management Industry Volume Billion Forecast, by Geography 2020 & 2033
- Table 47: Global ASEAN Waste Management Industry Revenue Million Forecast, by Country 2020 & 2033
- Table 48: Global ASEAN Waste Management Industry Volume Billion Forecast, by Country 2020 & 2033
Frequently Asked Questions
1. What is the projected Compound Annual Growth Rate (CAGR) of the ASEAN Waste Management Industry?
The projected CAGR is approximately 6.74%.
2. Which companies are prominent players in the ASEAN Waste Management Industry?
Key companies in the market include Sembcorp Environmental Management Pte Ltd (Singapore), Veolia Environmental S A, Colex Holdings Limited, Remondis, Klang Waste Care, Starpal Pte Ltd, Blue Planet Environmental Solutions, Greenway Environmental, PT Prasadha Pamunah Limbah Industri - PPLI, Boon Poh Refuse Disposal Pte Ltd, Suez Environment, Earth Recycling Services Ltd, ALBA Group Asia, Se Cure Waste Management**List Not Exhaustive.
3. What are the main segments of the ASEAN Waste Management Industry?
The market segments include Waste type, Disposal methods, Geography.
4. Can you provide details about the market size?
The market size is estimated to be USD 31.25 Million as of 2022.
5. What are some drivers contributing to market growth?
N/A
6. What are the notable trends driving market growth?
Indonesia Advances Zero-Plastic Waste Ambitions with Public-Private Partnership to Build Waste Management Capacity and Capability.
7. Are there any restraints impacting market growth?
N/A
8. Can you provide examples of recent developments in the market?
December 2022: A cooperative venture called Rebottle between Singapore Polytechnic (SP) and SembWaste, a fully owned subsidiary of Sembcorp Industries (Sembcorp) intends to increase the amount of PET bottles that are recycled in Singapore, beginning with the Punggol Shore area.June 2022: The introduction of a representative office in the Wijayakusuma Industrial Area was conducted on Thursday, June 30, 2022, making it a significant day in the history of PT Prasadha Pamunah Waste Industries (PPLI). The Wijayakusuma Industrial Estate's management, PT KIW, has leased space to the newly established PT PPLI representative office (Persero). Selling land for industrial usage, renting Ready-to-Use Factory Buildings (BPSP), and leasing space for offices are all part of PT KIW's primary business. The PT PPLI-DESI representative office will be opened with the intention of being a dependable partner for businesses, the Indonesian government, and other stakeholders, and contributing to Indonesia's economic and environmental growth.
9. What pricing options are available for accessing the report?
Pricing options include single-user, multi-user, and enterprise licenses priced at USD 4750, USD 5250, and USD 8750 respectively.
10. Is the market size provided in terms of value or volume?
The market size is provided in terms of value, measured in Million and volume, measured in Billion.
11. Are there any specific market keywords associated with the report?
Yes, the market keyword associated with the report is "ASEAN Waste Management Industry," which aids in identifying and referencing the specific market segment covered.
12. How do I determine which pricing option suits my needs best?
The pricing options vary based on user requirements and access needs. Individual users may opt for single-user licenses, while businesses requiring broader access may choose multi-user or enterprise licenses for cost-effective access to the report.
13. Are there any additional resources or data provided in the ASEAN Waste Management Industry report?
While the report offers comprehensive insights, it's advisable to review the specific contents or supplementary materials provided to ascertain if additional resources or data are available.
14. How can I stay updated on further developments or reports in the ASEAN Waste Management Industry?
To stay informed about further developments, trends, and reports in the ASEAN Waste Management Industry, consider subscribing to industry newsletters, following relevant companies and organizations, or regularly checking reputable industry news sources and publications.
Methodology
Step 1 - Identification of Relevant Samples Size from Population Database


Step 2 - Approaches for Defining Global Market Size (Value, Volume* & Price*)

Note*: In applicable scenarios
Step 3 - Data Sources
Primary Research
- Web Analytics
- Survey Reports
- Research Institute
- Latest Research Reports
- Opinion Leaders
Secondary Research
- Annual Reports
- White Paper
- Latest Press Release
- Industry Association
- Paid Database
- Investor Presentations

Step 4 - Data Triangulation
Involves using different sources of information in order to increase the validity of a study
These sources are likely to be stakeholders in a program - participants, other researchers, program staff, other community members, and so on.
Then we put all data in single framework & apply various statistical tools to find out the dynamic on the market.
During the analysis stage, feedback from the stakeholder groups would be compared to determine areas of agreement as well as areas of divergence