

Key Insights
The global Edutainment market, merging education and entertainment, is set for substantial growth. Projected to expand at a Compound Annual Growth Rate (CAGR) of 16.1%, the market size is estimated to reach 3 billion by 2025. This expansion is driven by increasing parental disposable income and a greater understanding of experiential learning's benefits. Parents are actively seeking engaging educational activities for children, fueling demand for innovative edutainment solutions. Technological advancements, including interactive exhibits, augmented reality, and educational apps, are significant growth catalysts. The trend toward personalized learning experiences further enhances market appeal.
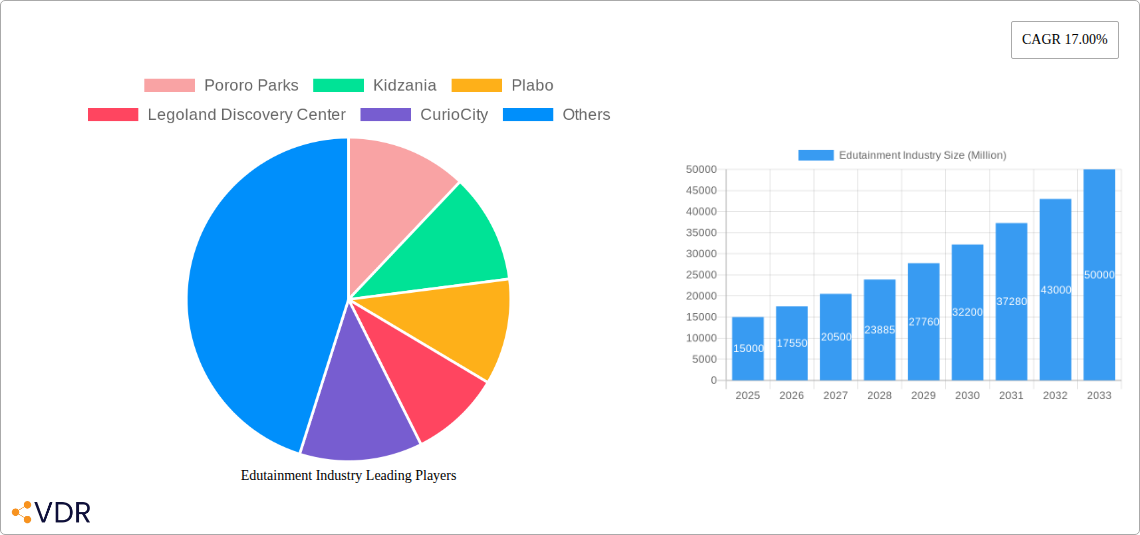
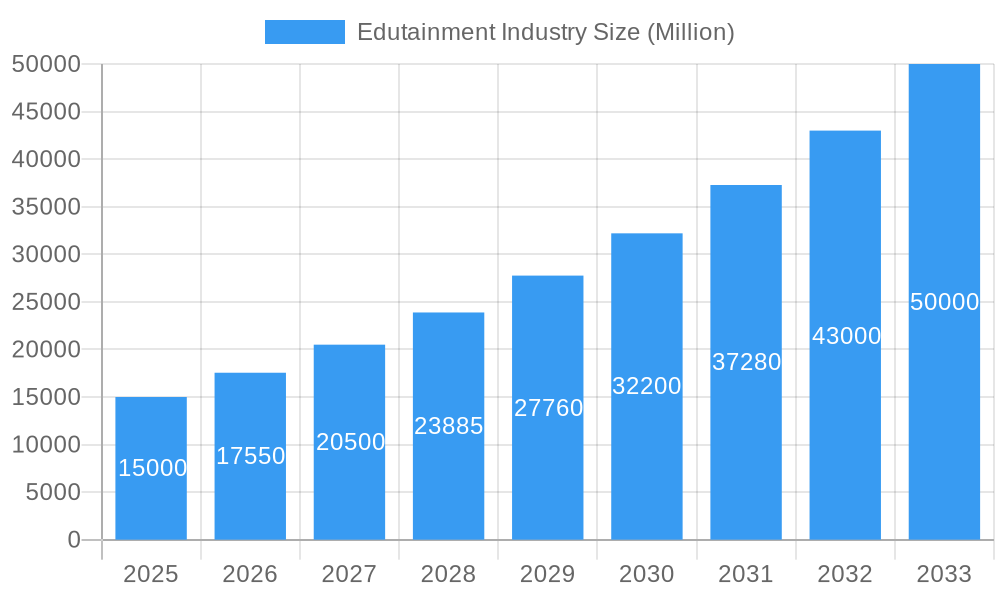
Edutainment Industry Market Size (In Billion)
The market is segmented by offerings such as theme parks, interactive museums, educational play centers, and technology-driven solutions. Intense competition exists among established and emerging players. Continuous integration of technology and innovative pedagogical approaches will likely sustain future growth.
Edutainment Industry Company Market Share
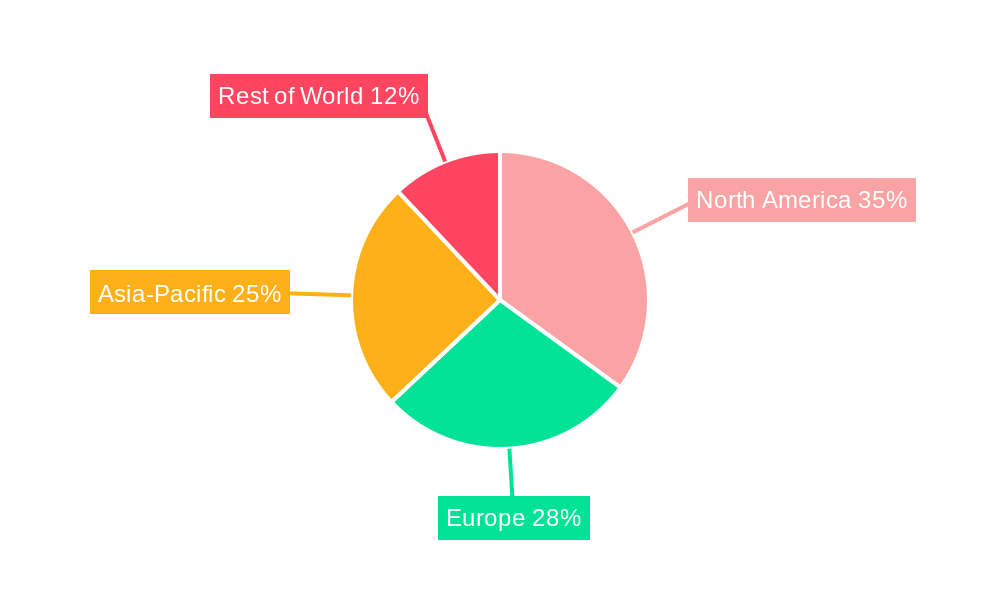
Geographically, regions with higher disposable incomes and a focus on early childhood education, such as North America, Europe, and Asia-Pacific, are anticipated to lead. Key industry challenges include maintaining innovation, managing operational costs for competitive pricing, and adapting to technological shifts. Despite these challenges, the Edutainment sector's outlook remains positive, presenting significant growth opportunities. Strategic collaborations between educational institutions, technology providers, and entertainment firms are expected to drive industry development and overall market momentum.
Edutainment Industry Market Report: 2019-2033
This comprehensive report provides a detailed analysis of the Edutainment industry, encompassing market dynamics, growth trends, competitive landscape, and future outlook. The study period covers 2019-2033, with 2025 serving as the base and estimated year. The forecast period spans 2025-2033, while the historical period encompasses 2019-2024. This report is crucial for industry professionals, investors, and strategists seeking to understand and capitalize on opportunities within this dynamic sector. The report analyzes parent markets (e.g., children's entertainment, education technology) and their influence on child-focused segments (e.g., theme parks, interactive learning centers). Market values are presented in millions of units.
Edutainment Industry Market Dynamics & Structure
The global edutainment market, valued at XX million in 2025, exhibits a moderately concentrated structure with key players like Pororo Parks, Kidzania, and Legoland Discovery Center holding significant market share. Technological innovation, particularly in interactive learning technologies and augmented reality (AR)/virtual reality (VR) applications, is a key driver. Regulatory frameworks concerning child safety and data privacy significantly impact operations. Competitive substitutes include traditional entertainment venues and online educational platforms. The end-user demographic primarily comprises children aged 2-12, and their parents' disposable income levels are a critical factor. M&A activity has been moderate in recent years, with approximately XX deals completed between 2019-2024, driven by expansion strategies and technological integration.
- Market Concentration: Moderately concentrated, with top 5 players holding approximately XX% market share in 2025.
- Technological Innovation: AR/VR integration, gamified learning platforms, and personalized learning experiences are key drivers.
- Regulatory Framework: Stringent safety regulations and data privacy laws shape market practices.
- Competitive Substitutes: Traditional entertainment and online educational platforms pose significant competition.
- End-User Demographics: Children aged 2-12, with parental purchasing power significantly impacting demand.
- M&A Trends: Approximately XX M&A deals between 2019-2024, focusing on expansion and technology integration.
Edutainment Industry Growth Trends & Insights
The edutainment market is experiencing robust growth, fueled by increasing parental disposable incomes, a rising awareness of the benefits of experiential learning, and the rapid adoption of technology within the education sector. The market is expected to register a CAGR of XX% during the forecast period (2025-2033), reaching XX million by 2033. Market penetration within developed regions is relatively high, but significant growth potential exists in emerging economies. Technological disruptions, such as the widespread adoption of mobile learning and interactive exhibits, are accelerating market expansion. Changing consumer behavior, with a preference for experiential and engaging learning approaches, further contributes to industry growth. The rising adoption of hybrid learning models, combining physical and digital experiences, also presents a significant opportunity.
Dominant Regions, Countries, or Segments in Edutainment Industry
North America currently holds the largest market share in the edutainment sector, driven by high disposable incomes, established infrastructure, and a strong emphasis on early childhood development. However, Asia-Pacific is projected to exhibit the highest growth rate during the forecast period, fueled by rising middle-class incomes, rapid urbanization, and increasing investment in education.
- North America: High disposable incomes, established infrastructure, and focus on early childhood education contribute to market dominance.
- Asia-Pacific: Rapid urbanization, rising middle-class incomes, and increasing education investment drive significant growth.
- Europe: Strong focus on educational tourism and established edutainment parks contribute to steady growth.
Edutainment Industry Product Landscape
The edutainment product landscape is diverse, encompassing theme parks, interactive museums, educational gaming platforms, and mobile learning applications. These offerings incorporate innovative technologies, such as AR/VR, to enhance engagement and personalize learning experiences. Key selling propositions often focus on creating fun, interactive, and educational environments that cater to children's learning styles and developmental stages. Recent advancements include personalized learning pathways tailored to individual needs and progress tracking tools for parents and educators.
Key Drivers, Barriers & Challenges in Edutainment Industry
Key Drivers:
- Rising disposable incomes and increased parental spending on children's education and entertainment.
- Growing awareness of the benefits of experiential learning and its positive impact on child development.
- Technological advancements, such as AR/VR, gamification, and personalized learning platforms.
- Government initiatives promoting early childhood development and STEM education.
Challenges and Restraints:
- High initial investment costs associated with developing and maintaining edutainment facilities and digital platforms.
- Intense competition from traditional entertainment venues and online educational resources.
- Regulatory hurdles and safety concerns regarding child protection and data privacy.
- Dependence on tourism and travel, making the sector vulnerable to external shocks like economic downturns or pandemics. The COVID-19 pandemic, for example, resulted in a XX million decrease in revenue in 2020 (estimated).
Emerging Opportunities in Edutainment Industry
- Expansion into untapped markets in developing economies with growing middle classes.
- Development of personalized learning experiences using AI and data analytics.
- Integration of STEM concepts into edutainment offerings to foster interest in science and technology.
- Collaboration with educational institutions and schools to incorporate edutainment into curricula.
Growth Accelerators in the Edutainment Industry
Strategic partnerships between edutainment companies and educational institutions can drive long-term growth by creating integrated learning experiences. Technological breakthroughs in AI, VR, and personalized learning will continue to enhance engagement and effectiveness. Market expansion into underserved regions and demographics through franchising or strategic alliances will also play a vital role.
Key Players Shaping the Edutainment Industry Market
- Pororo Parks
- Kidzania
- Plabo
- Legoland Discovery Center
- CurioCity
- Kindercity
- Mattel Play! Town
- Totter's Otterville
- Kidz Holding S A L
- Little Explorers
- ConveGenius
- Grey Sim
- Edsys
- IdeaCrate Edutainment Company
- DreamUs Edutainment
Notable Milestones in Edutainment Industry Sector
- 2020: Significant impact of COVID-19 pandemic on visitor numbers and revenue, leading to operational adaptations and the rise of virtual edutainment.
- 2022: Several major edutainment companies launched innovative AR/VR applications to enhance learning experiences and attract younger audiences.
- 2023: Increased collaborations between edutainment companies and educational institutions to integrate experiential learning into curricula.
In-Depth Edutainment Industry Market Outlook
The edutainment market is poised for continued growth driven by technological advancements, strategic partnerships, and expanding consumer demand. The integration of personalized learning and immersive technologies will reshape the industry landscape, creating opportunities for new product offerings and business models. The increasing focus on STEM education and early childhood development presents further expansion potential. Companies that can effectively leverage technology, build strong brands, and cater to evolving consumer preferences will be well-positioned for success in this dynamic sector.
Edutainment Industry Segmentation
-
1. product type
- 1.1. Interactive
- 1.2. Non interactive
- 1.3. Hybrid
- 1.4. Explorative
-
2. end use age group
- 2.1. Children
- 2.2. Teenagers
- 2.3. Young Adult
-
3. region/ country
- 3.1. United States of America
- 3.2. Europe
- 3.3. China
- 3.4. Japan
- 3.5. South East Asia
- 3.6. India
- 3.7. Central and South America
Edutainment Industry Segmentation By Geography
-
1. North America
- 1.1. United States
- 1.2. Canada
- 1.3. Mexico
-
2. South America
- 2.1. Brazil
- 2.2. Argentina
- 2.3. Rest of South America
-
3. Europe
- 3.1. United Kingdom
- 3.2. Germany
- 3.3. France
- 3.4. Italy
- 3.5. Spain
- 3.6. Russia
- 3.7. Benelux
- 3.8. Nordics
- 3.9. Rest of Europe
-
4. Middle East & Africa
- 4.1. Turkey
- 4.2. Israel
- 4.3. GCC
- 4.4. North Africa
- 4.5. South Africa
- 4.6. Rest of Middle East & Africa
-
5. Asia Pacific
- 5.1. China
- 5.2. India
- 5.3. Japan
- 5.4. South Korea
- 5.5. ASEAN
- 5.6. Oceania
- 5.7. Rest of Asia Pacific
Edutainment Industry Regional Market Share
Geographic Coverage of Edutainment Industry
Edutainment Industry REPORT HIGHLIGHTS
| Aspects | Details |
|---|---|
| Study Period | 2020-2034 |
| Base Year | 2025 |
| Estimated Year | 2026 |
| Forecast Period | 2026-2034 |
| Historical Period | 2020-2025 |
| Growth Rate | CAGR of 16.1% from 2020-2034 |
| Segmentation |
|
Table of Contents
- 1. Introduction
- 1.1. Research Scope
- 1.2. Market Segmentation
- 1.3. Research Objective
- 1.4. Definitions and Assumptions
- 2. Executive Summary
- 2.1. Market Snapshot
- 3. Market Dynamics
- 3.1. Market Drivers
- 3.2. Market Restrains
- 3.3. Market Trends
- 3.4. Market Opportunities
- 4. Market Factor Analysis
- 4.1. Porters Five Forces
- 4.1.1. Bargaining Power of Suppliers
- 4.1.2. Bargaining Power of Buyers
- 4.1.3. Threat of New Entrants
- 4.1.4. Threat of Substitutes
- 4.1.5. Competitive Rivalry
- 4.2. PESTEL analysis
- 4.3. BCG Analysis
- 4.3.1. Stars (High Growth, High Market Share)
- 4.3.2. Cash Cows (Low Growth, High Market Share)
- 4.3.3. Question Mark (High Growth, Low Market Share)
- 4.3.4. Dogs (Low Growth, Low Market Share)
- 4.4. Ansoff Matrix Analysis
- 4.5. Supply Chain Analysis
- 4.6. Regulatory Landscape
- 4.7. Current Market Potential and Opportunity Assessment (TAM–SAM–SOM Framework)
- 4.8. VDR Analyst Note
- 4.1. Porters Five Forces
- 5. Market Analysis, Insights and Forecast 2021-2033
- 5.1. Market Analysis, Insights and Forecast - by product type
- 5.1.1. Interactive
- 5.1.2. Non interactive
- 5.1.3. Hybrid
- 5.1.4. Explorative
- 5.2. Market Analysis, Insights and Forecast - by end use age group
- 5.2.1. Children
- 5.2.2. Teenagers
- 5.2.3. Young Adult
- 5.3. Market Analysis, Insights and Forecast - by region/ country
- 5.3.1. United States of America
- 5.3.2. Europe
- 5.3.3. China
- 5.3.4. Japan
- 5.3.5. South East Asia
- 5.3.6. India
- 5.3.7. Central and South America
- 5.4. Market Analysis, Insights and Forecast - by Region
- 5.4.1. North America
- 5.4.2. South America
- 5.4.3. Europe
- 5.4.4. Middle East & Africa
- 5.4.5. Asia Pacific
- 5.1. Market Analysis, Insights and Forecast - by product type
- 6. Global Edutainment Industry Analysis, Insights and Forecast, 2021-2033
- 6.1. Market Analysis, Insights and Forecast - by product type
- 6.1.1. Interactive
- 6.1.2. Non interactive
- 6.1.3. Hybrid
- 6.1.4. Explorative
- 6.2. Market Analysis, Insights and Forecast - by end use age group
- 6.2.1. Children
- 6.2.2. Teenagers
- 6.2.3. Young Adult
- 6.3. Market Analysis, Insights and Forecast - by region/ country
- 6.3.1. United States of America
- 6.3.2. Europe
- 6.3.3. China
- 6.3.4. Japan
- 6.3.5. South East Asia
- 6.3.6. India
- 6.3.7. Central and South America
- 6.1. Market Analysis, Insights and Forecast - by product type
- 7. North America Edutainment Industry Analysis, Insights and Forecast, 2021-2033
- 7.1. Market Analysis, Insights and Forecast - by product type
- 7.1.1. Interactive
- 7.1.2. Non interactive
- 7.1.3. Hybrid
- 7.1.4. Explorative
- 7.2. Market Analysis, Insights and Forecast - by end use age group
- 7.2.1. Children
- 7.2.2. Teenagers
- 7.2.3. Young Adult
- 7.3. Market Analysis, Insights and Forecast - by region/ country
- 7.3.1. United States of America
- 7.3.2. Europe
- 7.3.3. China
- 7.3.4. Japan
- 7.3.5. South East Asia
- 7.3.6. India
- 7.3.7. Central and South America
- 7.1. Market Analysis, Insights and Forecast - by product type
- 8. South America Edutainment Industry Analysis, Insights and Forecast, 2021-2033
- 8.1. Market Analysis, Insights and Forecast - by product type
- 8.1.1. Interactive
- 8.1.2. Non interactive
- 8.1.3. Hybrid
- 8.1.4. Explorative
- 8.2. Market Analysis, Insights and Forecast - by end use age group
- 8.2.1. Children
- 8.2.2. Teenagers
- 8.2.3. Young Adult
- 8.3. Market Analysis, Insights and Forecast - by region/ country
- 8.3.1. United States of America
- 8.3.2. Europe
- 8.3.3. China
- 8.3.4. Japan
- 8.3.5. South East Asia
- 8.3.6. India
- 8.3.7. Central and South America
- 8.1. Market Analysis, Insights and Forecast - by product type
- 9. Europe Edutainment Industry Analysis, Insights and Forecast, 2021-2033
- 9.1. Market Analysis, Insights and Forecast - by product type
- 9.1.1. Interactive
- 9.1.2. Non interactive
- 9.1.3. Hybrid
- 9.1.4. Explorative
- 9.2. Market Analysis, Insights and Forecast - by end use age group
- 9.2.1. Children
- 9.2.2. Teenagers
- 9.2.3. Young Adult
- 9.3. Market Analysis, Insights and Forecast - by region/ country
- 9.3.1. United States of America
- 9.3.2. Europe
- 9.3.3. China
- 9.3.4. Japan
- 9.3.5. South East Asia
- 9.3.6. India
- 9.3.7. Central and South America
- 9.1. Market Analysis, Insights and Forecast - by product type
- 10. Middle East & Africa Edutainment Industry Analysis, Insights and Forecast, 2021-2033
- 10.1. Market Analysis, Insights and Forecast - by product type
- 10.1.1. Interactive
- 10.1.2. Non interactive
- 10.1.3. Hybrid
- 10.1.4. Explorative
- 10.2. Market Analysis, Insights and Forecast - by end use age group
- 10.2.1. Children
- 10.2.2. Teenagers
- 10.2.3. Young Adult
- 10.3. Market Analysis, Insights and Forecast - by region/ country
- 10.3.1. United States of America
- 10.3.2. Europe
- 10.3.3. China
- 10.3.4. Japan
- 10.3.5. South East Asia
- 10.3.6. India
- 10.3.7. Central and South America
- 10.1. Market Analysis, Insights and Forecast - by product type
- 11. Asia Pacific Edutainment Industry Analysis, Insights and Forecast, 2021-2033
- 11.1. Market Analysis, Insights and Forecast - by product type
- 11.1.1. Interactive
- 11.1.2. Non interactive
- 11.1.3. Hybrid
- 11.1.4. Explorative
- 11.2. Market Analysis, Insights and Forecast - by end use age group
- 11.2.1. Children
- 11.2.2. Teenagers
- 11.2.3. Young Adult
- 11.3. Market Analysis, Insights and Forecast - by region/ country
- 11.3.1. United States of America
- 11.3.2. Europe
- 11.3.3. China
- 11.3.4. Japan
- 11.3.5. South East Asia
- 11.3.6. India
- 11.3.7. Central and South America
- 11.1. Market Analysis, Insights and Forecast - by product type
- 12. Competitive Analysis
- 12.1. Company Profiles
- 12.1.1 Pororo Parks
- 12.1.1.1. Company Overview
- 12.1.1.2. Products
- 12.1.1.3. Company Financials
- 12.1.1.4. SWOT Analysis
- 12.1.2 Kidzania
- 12.1.2.1. Company Overview
- 12.1.2.2. Products
- 12.1.2.3. Company Financials
- 12.1.2.4. SWOT Analysis
- 12.1.3 Plabo
- 12.1.3.1. Company Overview
- 12.1.3.2. Products
- 12.1.3.3. Company Financials
- 12.1.3.4. SWOT Analysis
- 12.1.4 Legoland Discovery Center
- 12.1.4.1. Company Overview
- 12.1.4.2. Products
- 12.1.4.3. Company Financials
- 12.1.4.4. SWOT Analysis
- 12.1.5 CurioCity
- 12.1.5.1. Company Overview
- 12.1.5.2. Products
- 12.1.5.3. Company Financials
- 12.1.5.4. SWOT Analysis
- 12.1.6 Kindercity
- 12.1.6.1. Company Overview
- 12.1.6.2. Products
- 12.1.6.3. Company Financials
- 12.1.6.4. SWOT Analysis
- 12.1.7 Mattel Play! Town
- 12.1.7.1. Company Overview
- 12.1.7.2. Products
- 12.1.7.3. Company Financials
- 12.1.7.4. SWOT Analysis
- 12.1.8 Totter's Otterville
- 12.1.8.1. Company Overview
- 12.1.8.2. Products
- 12.1.8.3. Company Financials
- 12.1.8.4. SWOT Analysis
- 12.1.9 Kidz Holding S A L
- 12.1.9.1. Company Overview
- 12.1.9.2. Products
- 12.1.9.3. Company Financials
- 12.1.9.4. SWOT Analysis
- 12.1.10 Little Explorers
- 12.1.10.1. Company Overview
- 12.1.10.2. Products
- 12.1.10.3. Company Financials
- 12.1.10.4. SWOT Analysis
- 12.1.11 ConveGenius
- 12.1.11.1. Company Overview
- 12.1.11.2. Products
- 12.1.11.3. Company Financials
- 12.1.11.4. SWOT Analysis
- 12.1.12 Grey Sim
- 12.1.12.1. Company Overview
- 12.1.12.2. Products
- 12.1.12.3. Company Financials
- 12.1.12.4. SWOT Analysis
- 12.1.13 Edsys
- 12.1.13.1. Company Overview
- 12.1.13.2. Products
- 12.1.13.3. Company Financials
- 12.1.13.4. SWOT Analysis
- 12.1.14 IdeaCrate Edutainment Company
- 12.1.14.1. Company Overview
- 12.1.14.2. Products
- 12.1.14.3. Company Financials
- 12.1.14.4. SWOT Analysis
- 12.1.15 DreamUs Edutainment*List Not Exhaustive
- 12.1.15.1. Company Overview
- 12.1.15.2. Products
- 12.1.15.3. Company Financials
- 12.1.15.4. SWOT Analysis
- 12.1.1 Pororo Parks
- 12.2. Market Entropy
- 12.2.1 Company's Key Areas Served
- 12.2.2 Recent Developments
- 12.3. Company Market Share Analysis 2025
- 12.3.1 Top 5 Companies Market Share Analysis
- 12.3.2 Top 3 Companies Market Share Analysis
- 12.4. List of Potential Customers
- 13. Research Methodology
List of Figures
- Figure 1: Global Edutainment Industry Revenue Breakdown (billion, %) by Region 2025 & 2033
- Figure 2: North America Edutainment Industry Revenue (billion), by product type 2025 & 2033
- Figure 3: North America Edutainment Industry Revenue Share (%), by product type 2025 & 2033
- Figure 4: North America Edutainment Industry Revenue (billion), by end use age group 2025 & 2033
- Figure 5: North America Edutainment Industry Revenue Share (%), by end use age group 2025 & 2033
- Figure 6: North America Edutainment Industry Revenue (billion), by region/ country 2025 & 2033
- Figure 7: North America Edutainment Industry Revenue Share (%), by region/ country 2025 & 2033
- Figure 8: North America Edutainment Industry Revenue (billion), by Country 2025 & 2033
- Figure 9: North America Edutainment Industry Revenue Share (%), by Country 2025 & 2033
- Figure 10: South America Edutainment Industry Revenue (billion), by product type 2025 & 2033
- Figure 11: South America Edutainment Industry Revenue Share (%), by product type 2025 & 2033
- Figure 12: South America Edutainment Industry Revenue (billion), by end use age group 2025 & 2033
- Figure 13: South America Edutainment Industry Revenue Share (%), by end use age group 2025 & 2033
- Figure 14: South America Edutainment Industry Revenue (billion), by region/ country 2025 & 2033
- Figure 15: South America Edutainment Industry Revenue Share (%), by region/ country 2025 & 2033
- Figure 16: South America Edutainment Industry Revenue (billion), by Country 2025 & 2033
- Figure 17: South America Edutainment Industry Revenue Share (%), by Country 2025 & 2033
- Figure 18: Europe Edutainment Industry Revenue (billion), by product type 2025 & 2033
- Figure 19: Europe Edutainment Industry Revenue Share (%), by product type 2025 & 2033
- Figure 20: Europe Edutainment Industry Revenue (billion), by end use age group 2025 & 2033
- Figure 21: Europe Edutainment Industry Revenue Share (%), by end use age group 2025 & 2033
- Figure 22: Europe Edutainment Industry Revenue (billion), by region/ country 2025 & 2033
- Figure 23: Europe Edutainment Industry Revenue Share (%), by region/ country 2025 & 2033
- Figure 24: Europe Edutainment Industry Revenue (billion), by Country 2025 & 2033
- Figure 25: Europe Edutainment Industry Revenue Share (%), by Country 2025 & 2033
- Figure 26: Middle East & Africa Edutainment Industry Revenue (billion), by product type 2025 & 2033
- Figure 27: Middle East & Africa Edutainment Industry Revenue Share (%), by product type 2025 & 2033
- Figure 28: Middle East & Africa Edutainment Industry Revenue (billion), by end use age group 2025 & 2033
- Figure 29: Middle East & Africa Edutainment Industry Revenue Share (%), by end use age group 2025 & 2033
- Figure 30: Middle East & Africa Edutainment Industry Revenue (billion), by region/ country 2025 & 2033
- Figure 31: Middle East & Africa Edutainment Industry Revenue Share (%), by region/ country 2025 & 2033
- Figure 32: Middle East & Africa Edutainment Industry Revenue (billion), by Country 2025 & 2033
- Figure 33: Middle East & Africa Edutainment Industry Revenue Share (%), by Country 2025 & 2033
- Figure 34: Asia Pacific Edutainment Industry Revenue (billion), by product type 2025 & 2033
- Figure 35: Asia Pacific Edutainment Industry Revenue Share (%), by product type 2025 & 2033
- Figure 36: Asia Pacific Edutainment Industry Revenue (billion), by end use age group 2025 & 2033
- Figure 37: Asia Pacific Edutainment Industry Revenue Share (%), by end use age group 2025 & 2033
- Figure 38: Asia Pacific Edutainment Industry Revenue (billion), by region/ country 2025 & 2033
- Figure 39: Asia Pacific Edutainment Industry Revenue Share (%), by region/ country 2025 & 2033
- Figure 40: Asia Pacific Edutainment Industry Revenue (billion), by Country 2025 & 2033
- Figure 41: Asia Pacific Edutainment Industry Revenue Share (%), by Country 2025 & 2033
List of Tables
- Table 1: Global Edutainment Industry Revenue billion Forecast, by product type 2020 & 2033
- Table 2: Global Edutainment Industry Revenue billion Forecast, by end use age group 2020 & 2033
- Table 3: Global Edutainment Industry Revenue billion Forecast, by region/ country 2020 & 2033
- Table 4: Global Edutainment Industry Revenue billion Forecast, by Region 2020 & 2033
- Table 5: Global Edutainment Industry Revenue billion Forecast, by product type 2020 & 2033
- Table 6: Global Edutainment Industry Revenue billion Forecast, by end use age group 2020 & 2033
- Table 7: Global Edutainment Industry Revenue billion Forecast, by region/ country 2020 & 2033
- Table 8: Global Edutainment Industry Revenue billion Forecast, by Country 2020 & 2033
- Table 9: United States Edutainment Industry Revenue (billion) Forecast, by Application 2020 & 2033
- Table 10: Canada Edutainment Industry Revenue (billion) Forecast, by Application 2020 & 2033
- Table 11: Mexico Edutainment Industry Revenue (billion) Forecast, by Application 2020 & 2033
- Table 12: Global Edutainment Industry Revenue billion Forecast, by product type 2020 & 2033
- Table 13: Global Edutainment Industry Revenue billion Forecast, by end use age group 2020 & 2033
- Table 14: Global Edutainment Industry Revenue billion Forecast, by region/ country 2020 & 2033
- Table 15: Global Edutainment Industry Revenue billion Forecast, by Country 2020 & 2033
- Table 16: Brazil Edutainment Industry Revenue (billion) Forecast, by Application 2020 & 2033
- Table 17: Argentina Edutainment Industry Revenue (billion) Forecast, by Application 2020 & 2033
- Table 18: Rest of South America Edutainment Industry Revenue (billion) Forecast, by Application 2020 & 2033
- Table 19: Global Edutainment Industry Revenue billion Forecast, by product type 2020 & 2033
- Table 20: Global Edutainment Industry Revenue billion Forecast, by end use age group 2020 & 2033
- Table 21: Global Edutainment Industry Revenue billion Forecast, by region/ country 2020 & 2033
- Table 22: Global Edutainment Industry Revenue billion Forecast, by Country 2020 & 2033
- Table 23: United Kingdom Edutainment Industry Revenue (billion) Forecast, by Application 2020 & 2033
- Table 24: Germany Edutainment Industry Revenue (billion) Forecast, by Application 2020 & 2033
- Table 25: France Edutainment Industry Revenue (billion) Forecast, by Application 2020 & 2033
- Table 26: Italy Edutainment Industry Revenue (billion) Forecast, by Application 2020 & 2033
- Table 27: Spain Edutainment Industry Revenue (billion) Forecast, by Application 2020 & 2033
- Table 28: Russia Edutainment Industry Revenue (billion) Forecast, by Application 2020 & 2033
- Table 29: Benelux Edutainment Industry Revenue (billion) Forecast, by Application 2020 & 2033
- Table 30: Nordics Edutainment Industry Revenue (billion) Forecast, by Application 2020 & 2033
- Table 31: Rest of Europe Edutainment Industry Revenue (billion) Forecast, by Application 2020 & 2033
- Table 32: Global Edutainment Industry Revenue billion Forecast, by product type 2020 & 2033
- Table 33: Global Edutainment Industry Revenue billion Forecast, by end use age group 2020 & 2033
- Table 34: Global Edutainment Industry Revenue billion Forecast, by region/ country 2020 & 2033
- Table 35: Global Edutainment Industry Revenue billion Forecast, by Country 2020 & 2033
- Table 36: Turkey Edutainment Industry Revenue (billion) Forecast, by Application 2020 & 2033
- Table 37: Israel Edutainment Industry Revenue (billion) Forecast, by Application 2020 & 2033
- Table 38: GCC Edutainment Industry Revenue (billion) Forecast, by Application 2020 & 2033
- Table 39: North Africa Edutainment Industry Revenue (billion) Forecast, by Application 2020 & 2033
- Table 40: South Africa Edutainment Industry Revenue (billion) Forecast, by Application 2020 & 2033
- Table 41: Rest of Middle East & Africa Edutainment Industry Revenue (billion) Forecast, by Application 2020 & 2033
- Table 42: Global Edutainment Industry Revenue billion Forecast, by product type 2020 & 2033
- Table 43: Global Edutainment Industry Revenue billion Forecast, by end use age group 2020 & 2033
- Table 44: Global Edutainment Industry Revenue billion Forecast, by region/ country 2020 & 2033
- Table 45: Global Edutainment Industry Revenue billion Forecast, by Country 2020 & 2033
- Table 46: China Edutainment Industry Revenue (billion) Forecast, by Application 2020 & 2033
- Table 47: India Edutainment Industry Revenue (billion) Forecast, by Application 2020 & 2033
- Table 48: Japan Edutainment Industry Revenue (billion) Forecast, by Application 2020 & 2033
- Table 49: South Korea Edutainment Industry Revenue (billion) Forecast, by Application 2020 & 2033
- Table 50: ASEAN Edutainment Industry Revenue (billion) Forecast, by Application 2020 & 2033
- Table 51: Oceania Edutainment Industry Revenue (billion) Forecast, by Application 2020 & 2033
- Table 52: Rest of Asia Pacific Edutainment Industry Revenue (billion) Forecast, by Application 2020 & 2033
Frequently Asked Questions
1. What is the projected Compound Annual Growth Rate (CAGR) of the Edutainment Industry?
The projected CAGR is approximately 16.1%.
2. Which companies are prominent players in the Edutainment Industry?
Key companies in the market include Pororo Parks, Kidzania, Plabo, Legoland Discovery Center, CurioCity, Kindercity, Mattel Play! Town, Totter's Otterville, Kidz Holding S A L, Little Explorers, ConveGenius, Grey Sim, Edsys, IdeaCrate Edutainment Company, DreamUs Edutainment*List Not Exhaustive.
3. What are the main segments of the Edutainment Industry?
The market segments include product type, end use age group, region/ country.
4. Can you provide details about the market size?
The market size is estimated to be USD 3 billion as of 2022.
5. What are some drivers contributing to market growth?
N/A
6. What are the notable trends driving market growth?
Technological Advancement Is Driving Edutech To Newer Heights.
7. Are there any restraints impacting market growth?
N/A
8. Can you provide examples of recent developments in the market?
N/A
9. What pricing options are available for accessing the report?
Pricing options include single-user, multi-user, and enterprise licenses priced at USD 4750, USD 4950, and USD 6800 respectively.
10. Is the market size provided in terms of value or volume?
The market size is provided in terms of value, measured in billion.
11. Are there any specific market keywords associated with the report?
Yes, the market keyword associated with the report is "Edutainment Industry," which aids in identifying and referencing the specific market segment covered.
12. How do I determine which pricing option suits my needs best?
The pricing options vary based on user requirements and access needs. Individual users may opt for single-user licenses, while businesses requiring broader access may choose multi-user or enterprise licenses for cost-effective access to the report.
13. Are there any additional resources or data provided in the Edutainment Industry report?
While the report offers comprehensive insights, it's advisable to review the specific contents or supplementary materials provided to ascertain if additional resources or data are available.
14. How can I stay updated on further developments or reports in the Edutainment Industry?
To stay informed about further developments, trends, and reports in the Edutainment Industry, consider subscribing to industry newsletters, following relevant companies and organizations, or regularly checking reputable industry news sources and publications.
Methodology
Step 1 - Identification of Relevant Samples Size from Population Database


Step 2 - Approaches for Defining Global Market Size (Value, Volume* & Price*)

Note*: In applicable scenarios
Step 3 - Data Sources
Primary Research
- Web Analytics
- Survey Reports
- Research Institute
- Latest Research Reports
- Opinion Leaders
Secondary Research
- Annual Reports
- White Paper
- Latest Press Release
- Industry Association
- Paid Database
- Investor Presentations

Step 4 - Data Triangulation
Involves using different sources of information in order to increase the validity of a study
These sources are likely to be stakeholders in a program - participants, other researchers, program staff, other community members, and so on.
Then we put all data in single framework & apply various statistical tools to find out the dynamic on the market.
During the analysis stage, feedback from the stakeholder groups would be compared to determine areas of agreement as well as areas of divergence