

Key Insights
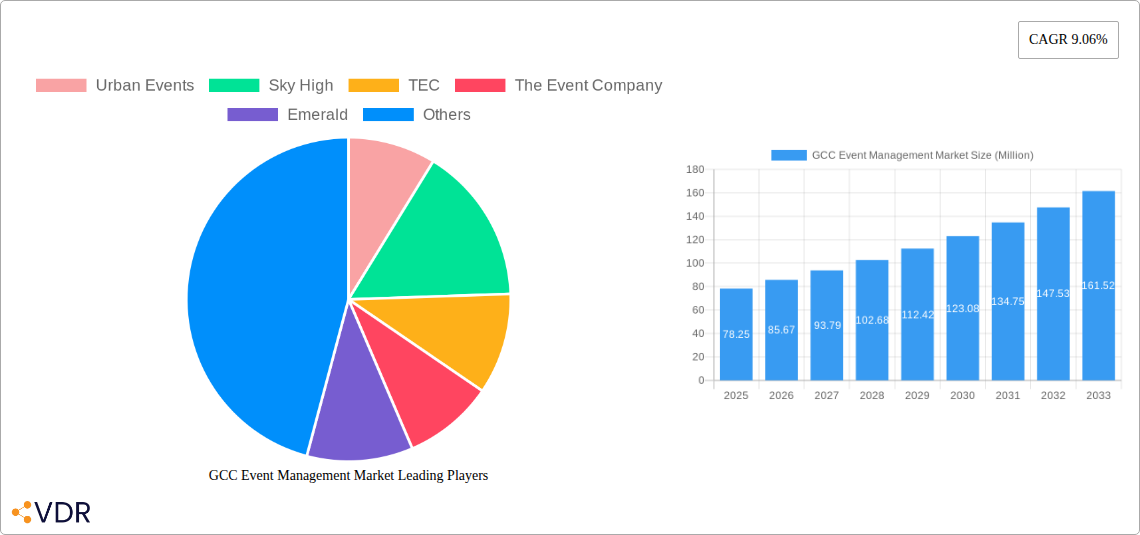
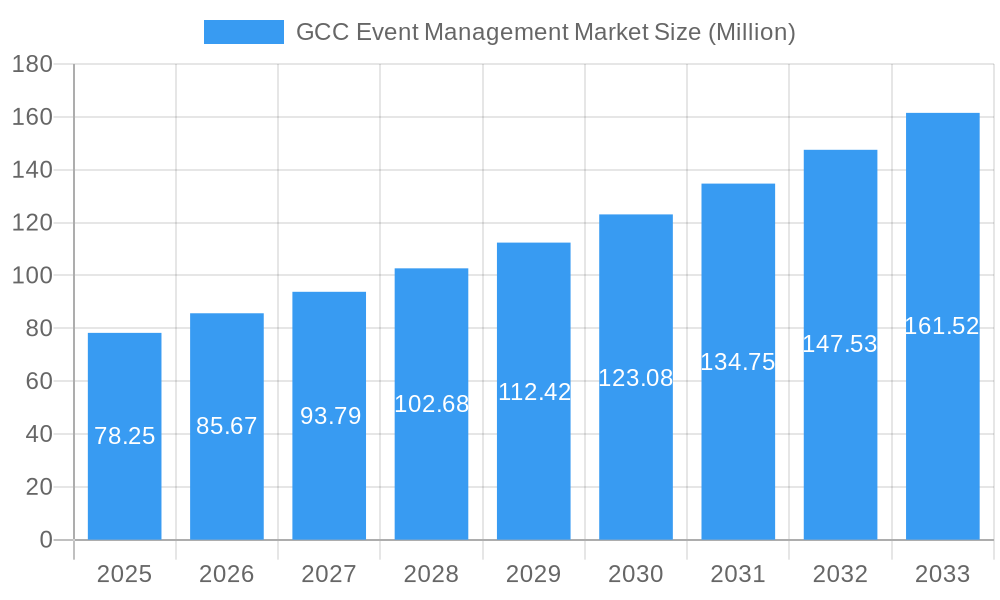
The GCC event management market, valued at $78.25 million in 2025, is projected to experience robust growth, driven by a Compound Annual Growth Rate (CAGR) of 9.06% from 2025 to 2033. This expansion is fueled by several key factors. The region's burgeoning tourism sector, coupled with significant investments in infrastructure for large-scale events, creates a fertile ground for market expansion. Furthermore, a growing preference for experiential marketing among businesses and a rising disposable income among consumers are contributing to increased demand for sophisticated and innovative event management services. The diversification of the GCC economy beyond oil, with a focus on entertainment and cultural events, further bolsters the market's prospects. Key players like Urban Events, Sky High, TEC, The Event Company, and others are capitalizing on this growth, offering specialized services ranging from corporate events and conferences to festivals and exhibitions. Competition is expected to remain strong, necessitating continuous innovation and adaptation to evolving consumer preferences and technological advancements.
GCC Event Management Market Market Size (In Million)
However, certain challenges exist. Economic fluctuations, although less pronounced than in some other regions, could impact spending on events. Regulations related to event permits and licenses might pose operational complexities for event management companies. Furthermore, the market faces the challenge of attracting and retaining skilled professionals amidst increasing competition for talent. The ongoing development of sustainable event practices is also gaining momentum, requiring event organizers to incorporate environmentally friendly initiatives into their operations. Despite these restraints, the long-term outlook for the GCC event management market remains positive, with considerable potential for growth throughout the forecast period. The strategic adoption of digital technologies, creative event concepts, and a focus on sustainability are key to navigating market dynamics and capitalizing on future growth opportunities.
GCC Event Management Market Company Market Share
GCC Event Management Market: A Comprehensive Market Report (2019-2033)
This in-depth report provides a comprehensive analysis of the GCC event management market, encompassing market dynamics, growth trends, key players, and future outlook. With a study period spanning 2019-2033, a base year of 2025, and a forecast period of 2025-2033, this report is an invaluable resource for industry professionals, investors, and stakeholders seeking to understand and capitalize on the opportunities within this dynamic sector. The report’s analysis covers the parent market of global event management and the child market of GCC event management, offering a nuanced understanding of market segmentation and regional specificities. The market size is projected to reach xx Million by 2033.
GCC Event Management Market Dynamics & Structure
This section delves into the intricacies of the GCC event management market, examining its structure, key drivers, and challenges. Market concentration is analyzed, revealing the market share held by major players like Urban Events, Sky High, TEC, The Event Company, Emerald, Plan3Media, CWE, M&M Group, Great Wall Events, and GM Events (list not exhaustive). The report explores the impact of technological innovations, such as virtual and hybrid event platforms, on market dynamics. Regulatory frameworks and their influence on market growth are also assessed. The analysis further considers the presence of competitive product substitutes and the evolving demographics of end-users within the GCC region. Finally, it examines M&A activity, including deal volumes and their impact on market consolidation.
- Market Concentration: The GCC event management market exhibits a [describe level of concentration – e.g., moderately concentrated] structure, with the top 5 players holding an estimated [xx]% market share in 2025.
- Technological Innovation: Adoption of virtual and hybrid event technologies is a key driver, offering cost-effectiveness and expanded reach. However, challenges remain in bridging the digital divide and ensuring equitable access.
- Regulatory Framework: Government regulations related to event permits, safety standards, and sponsorship influence market operations. [Describe specific regulations and their impact].
- Competitive Substitutes: The rise of online webinars and virtual conferences presents competitive pressure, but the demand for in-person networking events remains strong.
- End-User Demographics: The report analyzes the evolving demographics of event attendees, including age, income levels, and preferences, influencing event planning strategies.
- M&A Trends: The market has witnessed [xx] M&A deals in the historical period (2019-2024), indicating a trend towards consolidation. [Quantify the impact of these deals on market share and competition].
GCC Event Management Market Growth Trends & Insights
This section leverages extensive market research and data analysis to provide a comprehensive overview of the GCC event management market's growth trajectory. The analysis covers market size evolution from 2019 to 2024, projecting growth to xx Million by 2033. Key factors driving growth are analyzed, including rising disposable incomes, increasing tourism, government investments in infrastructure, and the growing adoption of innovative event technologies. The report also examines market penetration rates across different segments and regions, providing insights into the market's maturation level and future potential. Specific metrics such as CAGR (Compound Annual Growth Rate) and market penetration are provided to further elucidate the market's dynamism.
[Insert 600-word analysis focusing on market size evolution, adoption rates, technological disruptions, and consumer behavior shifts with specific metrics like CAGR and market penetration].
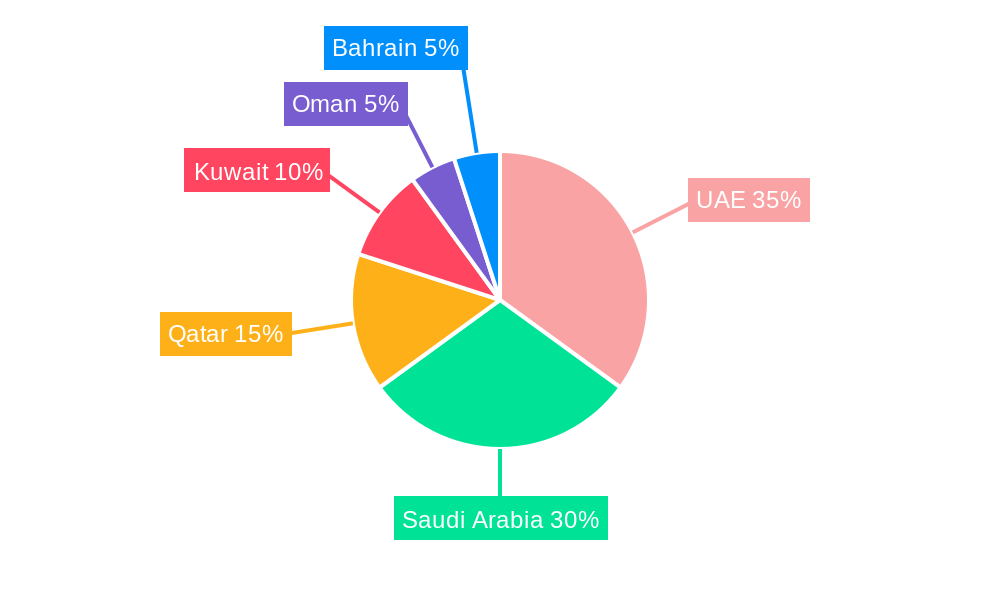
Dominant Regions, Countries, or Segments in GCC Event Management Market
This section identifies the leading regions, countries, or segments within the GCC event management market driving overall growth. Detailed analysis focuses on the factors contributing to their dominance, including economic policies, infrastructure development, and unique market characteristics. The report analyzes market share and growth potential for each leading segment and assesses the competitive landscape within those regions.
[Insert 600-word analysis using bullet points for key drivers and paragraphs to analyze dominance factors, including market share and growth potential. Examples: UAE, Saudi Arabia, specific event types (e.g., corporate events, conferences, exhibitions).]
- Key Drivers: [List key drivers for the dominant region/segment using bullet points].
- Dominance Factors: [Analyze dominance factors with paragraphs, using market share and growth potential data].
GCC Event Management Market Product Landscape
This section offers a concise overview of the product landscape, encompassing product innovations, applications, and key performance indicators. The analysis highlights unique selling propositions (USPs) and technological advancements in event management software, services, and related technologies.
[Insert 100-150-word paragraph detailing product innovations, applications, and performance metrics, highlighting USPs and technological advancements.]
Key Drivers, Barriers & Challenges in GCC Event Management Market
This section identifies the key drivers and challenges impacting the GCC event management market. Drivers include factors like economic growth, increasing tourism, and government support for large-scale events. Challenges include competition from other forms of entertainment, economic downturns, and logistical hurdles.
[Insert 150-word paragraph or bullet points outlining primary forces propelling the market (technological, economic, and policy-driven factors with examples). Follow with 150 words analyzing challenges and restraints (supply chain issues, regulatory hurdles, and competitive pressures with quantifiable impacts).]
Emerging Opportunities in GCC Event Management Market
This section explores emerging opportunities arising from untapped markets, innovative applications, and evolving consumer preferences. It highlights potential for growth in niche segments, such as sustainable events and virtual reality experiences.
[Insert 150-word paragraph or list highlighting emerging trends and opportunities.]
Growth Accelerators in the GCC Event Management Market Industry
This section discusses catalysts driving long-term growth, such as technological advancements, strategic partnerships, and market expansion strategies. It emphasizes the importance of innovation, collaboration, and adaptation to changing consumer expectations.
[Insert 150-word paragraph discussing catalysts driving long-term growth].
Key Players Shaping the GCC Event Management Market Market
This section profiles key players in the GCC event management market, providing an overview of their operations, market share, and competitive strategies.
- Urban Events (if a global link is available, otherwise use only the company name)
- Sky High
- TEC
- The Event Company
- Emerald
- Plan3Media
- CWE
- M&M Group
- Great Wall Events
- GM Events
Notable Milestones in GCC Event Management Market Sector
This section details significant developments that have shaped the market's trajectory.
- March 2024: Emerald Holding Inc. acquired Hotel Interactive (HI), expanding its portfolio of premium hosted-buyer events.
- November 2023: Emerald Holding Inc. acquired Cocina Sabrosa, entering the Latin food & beverage event market.
In-Depth GCC Event Management Market Market Outlook
This section summarizes the key growth accelerators and provides an outlook on the future potential of the GCC event management market. It highlights strategic opportunities for market players, emphasizing the importance of adapting to technological advancements and evolving consumer preferences.
[Insert 150-word paragraph summarizing growth accelerators and focusing on future market potential and strategic opportunities.]
GCC Event Management Market Segmentation
-
1. Event Type
- 1.1. Meetings
- 1.2. Incentives
- 1.3. Conventions
- 1.4. Exhibitions
- 1.5. Others
-
2. Application
- 2.1. Academic
- 2.2. Business
- 2.3. Political
- 2.4. Others
GCC Event Management Market Segmentation By Geography
-
1. North America
- 1.1. United States
- 1.2. Canada
- 1.3. Mexico
-
2. South America
- 2.1. Brazil
- 2.2. Argentina
- 2.3. Rest of South America
-
3. Europe
- 3.1. United Kingdom
- 3.2. Germany
- 3.3. France
- 3.4. Italy
- 3.5. Spain
- 3.6. Russia
- 3.7. Benelux
- 3.8. Nordics
- 3.9. Rest of Europe
-
4. Middle East & Africa
- 4.1. Turkey
- 4.2. Israel
- 4.3. GCC
- 4.4. North Africa
- 4.5. South Africa
- 4.6. Rest of Middle East & Africa
-
5. Asia Pacific
- 5.1. China
- 5.2. India
- 5.3. Japan
- 5.4. South Korea
- 5.5. ASEAN
- 5.6. Oceania
- 5.7. Rest of Asia Pacific
GCC Event Management Market Regional Market Share
Geographic Coverage of GCC Event Management Market
GCC Event Management Market REPORT HIGHLIGHTS
| Aspects | Details |
|---|---|
| Study Period | 2020-2034 |
| Base Year | 2025 |
| Estimated Year | 2026 |
| Forecast Period | 2026-2034 |
| Historical Period | 2020-2025 |
| Growth Rate | CAGR of 9.06% from 2020-2034 |
| Segmentation |
|
Table of Contents
- 1. Introduction
- 1.1. Research Scope
- 1.2. Market Segmentation
- 1.3. Research Objective
- 1.4. Definitions and Assumptions
- 2. Executive Summary
- 2.1. Market Snapshot
- 3. Market Dynamics
- 3.1. Market Drivers
- 3.2. Market Restrains
- 3.3. Market Trends
- 3.4. Market Opportunities
- 4. Market Factor Analysis
- 4.1. Porters Five Forces
- 4.1.1. Bargaining Power of Suppliers
- 4.1.2. Bargaining Power of Buyers
- 4.1.3. Threat of New Entrants
- 4.1.4. Threat of Substitutes
- 4.1.5. Competitive Rivalry
- 4.2. PESTEL analysis
- 4.3. BCG Analysis
- 4.3.1. Stars (High Growth, High Market Share)
- 4.3.2. Cash Cows (Low Growth, High Market Share)
- 4.3.3. Question Mark (High Growth, Low Market Share)
- 4.3.4. Dogs (Low Growth, Low Market Share)
- 4.4. Ansoff Matrix Analysis
- 4.5. Supply Chain Analysis
- 4.6. Regulatory Landscape
- 4.7. Current Market Potential and Opportunity Assessment (TAM–SAM–SOM Framework)
- 4.8. VDR Analyst Note
- 4.1. Porters Five Forces
- 5. Market Analysis, Insights and Forecast 2021-2033
- 5.1. Market Analysis, Insights and Forecast - by Event Type
- 5.1.1. Meetings
- 5.1.2. Incentives
- 5.1.3. Conventions
- 5.1.4. Exhibitions
- 5.1.5. Others
- 5.2. Market Analysis, Insights and Forecast - by Application
- 5.2.1. Academic
- 5.2.2. Business
- 5.2.3. Political
- 5.2.4. Others
- 5.3. Market Analysis, Insights and Forecast - by Region
- 5.3.1. North America
- 5.3.2. South America
- 5.3.3. Europe
- 5.3.4. Middle East & Africa
- 5.3.5. Asia Pacific
- 5.1. Market Analysis, Insights and Forecast - by Event Type
- 6. Global GCC Event Management Market Analysis, Insights and Forecast, 2021-2033
- 6.1. Market Analysis, Insights and Forecast - by Event Type
- 6.1.1. Meetings
- 6.1.2. Incentives
- 6.1.3. Conventions
- 6.1.4. Exhibitions
- 6.1.5. Others
- 6.2. Market Analysis, Insights and Forecast - by Application
- 6.2.1. Academic
- 6.2.2. Business
- 6.2.3. Political
- 6.2.4. Others
- 6.1. Market Analysis, Insights and Forecast - by Event Type
- 7. North America GCC Event Management Market Analysis, Insights and Forecast, 2021-2033
- 7.1. Market Analysis, Insights and Forecast - by Event Type
- 7.1.1. Meetings
- 7.1.2. Incentives
- 7.1.3. Conventions
- 7.1.4. Exhibitions
- 7.1.5. Others
- 7.2. Market Analysis, Insights and Forecast - by Application
- 7.2.1. Academic
- 7.2.2. Business
- 7.2.3. Political
- 7.2.4. Others
- 7.1. Market Analysis, Insights and Forecast - by Event Type
- 8. South America GCC Event Management Market Analysis, Insights and Forecast, 2021-2033
- 8.1. Market Analysis, Insights and Forecast - by Event Type
- 8.1.1. Meetings
- 8.1.2. Incentives
- 8.1.3. Conventions
- 8.1.4. Exhibitions
- 8.1.5. Others
- 8.2. Market Analysis, Insights and Forecast - by Application
- 8.2.1. Academic
- 8.2.2. Business
- 8.2.3. Political
- 8.2.4. Others
- 8.1. Market Analysis, Insights and Forecast - by Event Type
- 9. Europe GCC Event Management Market Analysis, Insights and Forecast, 2021-2033
- 9.1. Market Analysis, Insights and Forecast - by Event Type
- 9.1.1. Meetings
- 9.1.2. Incentives
- 9.1.3. Conventions
- 9.1.4. Exhibitions
- 9.1.5. Others
- 9.2. Market Analysis, Insights and Forecast - by Application
- 9.2.1. Academic
- 9.2.2. Business
- 9.2.3. Political
- 9.2.4. Others
- 9.1. Market Analysis, Insights and Forecast - by Event Type
- 10. Middle East & Africa GCC Event Management Market Analysis, Insights and Forecast, 2021-2033
- 10.1. Market Analysis, Insights and Forecast - by Event Type
- 10.1.1. Meetings
- 10.1.2. Incentives
- 10.1.3. Conventions
- 10.1.4. Exhibitions
- 10.1.5. Others
- 10.2. Market Analysis, Insights and Forecast - by Application
- 10.2.1. Academic
- 10.2.2. Business
- 10.2.3. Political
- 10.2.4. Others
- 10.1. Market Analysis, Insights and Forecast - by Event Type
- 11. Asia Pacific GCC Event Management Market Analysis, Insights and Forecast, 2021-2033
- 11.1. Market Analysis, Insights and Forecast - by Event Type
- 11.1.1. Meetings
- 11.1.2. Incentives
- 11.1.3. Conventions
- 11.1.4. Exhibitions
- 11.1.5. Others
- 11.2. Market Analysis, Insights and Forecast - by Application
- 11.2.1. Academic
- 11.2.2. Business
- 11.2.3. Political
- 11.2.4. Others
- 11.1. Market Analysis, Insights and Forecast - by Event Type
- 12. Competitive Analysis
- 12.1. Company Profiles
- 12.1.1 Urban Events
- 12.1.1.1. Company Overview
- 12.1.1.2. Products
- 12.1.1.3. Company Financials
- 12.1.1.4. SWOT Analysis
- 12.1.2 Sky High
- 12.1.2.1. Company Overview
- 12.1.2.2. Products
- 12.1.2.3. Company Financials
- 12.1.2.4. SWOT Analysis
- 12.1.3 TEC
- 12.1.3.1. Company Overview
- 12.1.3.2. Products
- 12.1.3.3. Company Financials
- 12.1.3.4. SWOT Analysis
- 12.1.4 The Event Company
- 12.1.4.1. Company Overview
- 12.1.4.2. Products
- 12.1.4.3. Company Financials
- 12.1.4.4. SWOT Analysis
- 12.1.5 Emerald
- 12.1.5.1. Company Overview
- 12.1.5.2. Products
- 12.1.5.3. Company Financials
- 12.1.5.4. SWOT Analysis
- 12.1.6 Plan3Media
- 12.1.6.1. Company Overview
- 12.1.6.2. Products
- 12.1.6.3. Company Financials
- 12.1.6.4. SWOT Analysis
- 12.1.7 CWE
- 12.1.7.1. Company Overview
- 12.1.7.2. Products
- 12.1.7.3. Company Financials
- 12.1.7.4. SWOT Analysis
- 12.1.8 M&M Group
- 12.1.8.1. Company Overview
- 12.1.8.2. Products
- 12.1.8.3. Company Financials
- 12.1.8.4. SWOT Analysis
- 12.1.9 Great Wall Events
- 12.1.9.1. Company Overview
- 12.1.9.2. Products
- 12.1.9.3. Company Financials
- 12.1.9.4. SWOT Analysis
- 12.1.10 GM Events**List Not Exhaustive
- 12.1.10.1. Company Overview
- 12.1.10.2. Products
- 12.1.10.3. Company Financials
- 12.1.10.4. SWOT Analysis
- 12.1.1 Urban Events
- 12.2. Market Entropy
- 12.2.1 Company's Key Areas Served
- 12.2.2 Recent Developments
- 12.3. Company Market Share Analysis 2025
- 12.3.1 Top 5 Companies Market Share Analysis
- 12.3.2 Top 3 Companies Market Share Analysis
- 12.4. List of Potential Customers
- 13. Research Methodology
List of Figures
- Figure 1: Global GCC Event Management Market Revenue Breakdown (Million, %) by Region 2025 & 2033
- Figure 2: Global GCC Event Management Market Volume Breakdown (Billion, %) by Region 2025 & 2033
- Figure 3: North America GCC Event Management Market Revenue (Million), by Event Type 2025 & 2033
- Figure 4: North America GCC Event Management Market Volume (Billion), by Event Type 2025 & 2033
- Figure 5: North America GCC Event Management Market Revenue Share (%), by Event Type 2025 & 2033
- Figure 6: North America GCC Event Management Market Volume Share (%), by Event Type 2025 & 2033
- Figure 7: North America GCC Event Management Market Revenue (Million), by Application 2025 & 2033
- Figure 8: North America GCC Event Management Market Volume (Billion), by Application 2025 & 2033
- Figure 9: North America GCC Event Management Market Revenue Share (%), by Application 2025 & 2033
- Figure 10: North America GCC Event Management Market Volume Share (%), by Application 2025 & 2033
- Figure 11: North America GCC Event Management Market Revenue (Million), by Country 2025 & 2033
- Figure 12: North America GCC Event Management Market Volume (Billion), by Country 2025 & 2033
- Figure 13: North America GCC Event Management Market Revenue Share (%), by Country 2025 & 2033
- Figure 14: North America GCC Event Management Market Volume Share (%), by Country 2025 & 2033
- Figure 15: South America GCC Event Management Market Revenue (Million), by Event Type 2025 & 2033
- Figure 16: South America GCC Event Management Market Volume (Billion), by Event Type 2025 & 2033
- Figure 17: South America GCC Event Management Market Revenue Share (%), by Event Type 2025 & 2033
- Figure 18: South America GCC Event Management Market Volume Share (%), by Event Type 2025 & 2033
- Figure 19: South America GCC Event Management Market Revenue (Million), by Application 2025 & 2033
- Figure 20: South America GCC Event Management Market Volume (Billion), by Application 2025 & 2033
- Figure 21: South America GCC Event Management Market Revenue Share (%), by Application 2025 & 2033
- Figure 22: South America GCC Event Management Market Volume Share (%), by Application 2025 & 2033
- Figure 23: South America GCC Event Management Market Revenue (Million), by Country 2025 & 2033
- Figure 24: South America GCC Event Management Market Volume (Billion), by Country 2025 & 2033
- Figure 25: South America GCC Event Management Market Revenue Share (%), by Country 2025 & 2033
- Figure 26: South America GCC Event Management Market Volume Share (%), by Country 2025 & 2033
- Figure 27: Europe GCC Event Management Market Revenue (Million), by Event Type 2025 & 2033
- Figure 28: Europe GCC Event Management Market Volume (Billion), by Event Type 2025 & 2033
- Figure 29: Europe GCC Event Management Market Revenue Share (%), by Event Type 2025 & 2033
- Figure 30: Europe GCC Event Management Market Volume Share (%), by Event Type 2025 & 2033
- Figure 31: Europe GCC Event Management Market Revenue (Million), by Application 2025 & 2033
- Figure 32: Europe GCC Event Management Market Volume (Billion), by Application 2025 & 2033
- Figure 33: Europe GCC Event Management Market Revenue Share (%), by Application 2025 & 2033
- Figure 34: Europe GCC Event Management Market Volume Share (%), by Application 2025 & 2033
- Figure 35: Europe GCC Event Management Market Revenue (Million), by Country 2025 & 2033
- Figure 36: Europe GCC Event Management Market Volume (Billion), by Country 2025 & 2033
- Figure 37: Europe GCC Event Management Market Revenue Share (%), by Country 2025 & 2033
- Figure 38: Europe GCC Event Management Market Volume Share (%), by Country 2025 & 2033
- Figure 39: Middle East & Africa GCC Event Management Market Revenue (Million), by Event Type 2025 & 2033
- Figure 40: Middle East & Africa GCC Event Management Market Volume (Billion), by Event Type 2025 & 2033
- Figure 41: Middle East & Africa GCC Event Management Market Revenue Share (%), by Event Type 2025 & 2033
- Figure 42: Middle East & Africa GCC Event Management Market Volume Share (%), by Event Type 2025 & 2033
- Figure 43: Middle East & Africa GCC Event Management Market Revenue (Million), by Application 2025 & 2033
- Figure 44: Middle East & Africa GCC Event Management Market Volume (Billion), by Application 2025 & 2033
- Figure 45: Middle East & Africa GCC Event Management Market Revenue Share (%), by Application 2025 & 2033
- Figure 46: Middle East & Africa GCC Event Management Market Volume Share (%), by Application 2025 & 2033
- Figure 47: Middle East & Africa GCC Event Management Market Revenue (Million), by Country 2025 & 2033
- Figure 48: Middle East & Africa GCC Event Management Market Volume (Billion), by Country 2025 & 2033
- Figure 49: Middle East & Africa GCC Event Management Market Revenue Share (%), by Country 2025 & 2033
- Figure 50: Middle East & Africa GCC Event Management Market Volume Share (%), by Country 2025 & 2033
- Figure 51: Asia Pacific GCC Event Management Market Revenue (Million), by Event Type 2025 & 2033
- Figure 52: Asia Pacific GCC Event Management Market Volume (Billion), by Event Type 2025 & 2033
- Figure 53: Asia Pacific GCC Event Management Market Revenue Share (%), by Event Type 2025 & 2033
- Figure 54: Asia Pacific GCC Event Management Market Volume Share (%), by Event Type 2025 & 2033
- Figure 55: Asia Pacific GCC Event Management Market Revenue (Million), by Application 2025 & 2033
- Figure 56: Asia Pacific GCC Event Management Market Volume (Billion), by Application 2025 & 2033
- Figure 57: Asia Pacific GCC Event Management Market Revenue Share (%), by Application 2025 & 2033
- Figure 58: Asia Pacific GCC Event Management Market Volume Share (%), by Application 2025 & 2033
- Figure 59: Asia Pacific GCC Event Management Market Revenue (Million), by Country 2025 & 2033
- Figure 60: Asia Pacific GCC Event Management Market Volume (Billion), by Country 2025 & 2033
- Figure 61: Asia Pacific GCC Event Management Market Revenue Share (%), by Country 2025 & 2033
- Figure 62: Asia Pacific GCC Event Management Market Volume Share (%), by Country 2025 & 2033
List of Tables
- Table 1: Global GCC Event Management Market Revenue Million Forecast, by Event Type 2020 & 2033
- Table 2: Global GCC Event Management Market Volume Billion Forecast, by Event Type 2020 & 2033
- Table 3: Global GCC Event Management Market Revenue Million Forecast, by Application 2020 & 2033
- Table 4: Global GCC Event Management Market Volume Billion Forecast, by Application 2020 & 2033
- Table 5: Global GCC Event Management Market Revenue Million Forecast, by Region 2020 & 2033
- Table 6: Global GCC Event Management Market Volume Billion Forecast, by Region 2020 & 2033
- Table 7: Global GCC Event Management Market Revenue Million Forecast, by Event Type 2020 & 2033
- Table 8: Global GCC Event Management Market Volume Billion Forecast, by Event Type 2020 & 2033
- Table 9: Global GCC Event Management Market Revenue Million Forecast, by Application 2020 & 2033
- Table 10: Global GCC Event Management Market Volume Billion Forecast, by Application 2020 & 2033
- Table 11: Global GCC Event Management Market Revenue Million Forecast, by Country 2020 & 2033
- Table 12: Global GCC Event Management Market Volume Billion Forecast, by Country 2020 & 2033
- Table 13: United States GCC Event Management Market Revenue (Million) Forecast, by Application 2020 & 2033
- Table 14: United States GCC Event Management Market Volume (Billion) Forecast, by Application 2020 & 2033
- Table 15: Canada GCC Event Management Market Revenue (Million) Forecast, by Application 2020 & 2033
- Table 16: Canada GCC Event Management Market Volume (Billion) Forecast, by Application 2020 & 2033
- Table 17: Mexico GCC Event Management Market Revenue (Million) Forecast, by Application 2020 & 2033
- Table 18: Mexico GCC Event Management Market Volume (Billion) Forecast, by Application 2020 & 2033
- Table 19: Global GCC Event Management Market Revenue Million Forecast, by Event Type 2020 & 2033
- Table 20: Global GCC Event Management Market Volume Billion Forecast, by Event Type 2020 & 2033
- Table 21: Global GCC Event Management Market Revenue Million Forecast, by Application 2020 & 2033
- Table 22: Global GCC Event Management Market Volume Billion Forecast, by Application 2020 & 2033
- Table 23: Global GCC Event Management Market Revenue Million Forecast, by Country 2020 & 2033
- Table 24: Global GCC Event Management Market Volume Billion Forecast, by Country 2020 & 2033
- Table 25: Brazil GCC Event Management Market Revenue (Million) Forecast, by Application 2020 & 2033
- Table 26: Brazil GCC Event Management Market Volume (Billion) Forecast, by Application 2020 & 2033
- Table 27: Argentina GCC Event Management Market Revenue (Million) Forecast, by Application 2020 & 2033
- Table 28: Argentina GCC Event Management Market Volume (Billion) Forecast, by Application 2020 & 2033
- Table 29: Rest of South America GCC Event Management Market Revenue (Million) Forecast, by Application 2020 & 2033
- Table 30: Rest of South America GCC Event Management Market Volume (Billion) Forecast, by Application 2020 & 2033
- Table 31: Global GCC Event Management Market Revenue Million Forecast, by Event Type 2020 & 2033
- Table 32: Global GCC Event Management Market Volume Billion Forecast, by Event Type 2020 & 2033
- Table 33: Global GCC Event Management Market Revenue Million Forecast, by Application 2020 & 2033
- Table 34: Global GCC Event Management Market Volume Billion Forecast, by Application 2020 & 2033
- Table 35: Global GCC Event Management Market Revenue Million Forecast, by Country 2020 & 2033
- Table 36: Global GCC Event Management Market Volume Billion Forecast, by Country 2020 & 2033
- Table 37: United Kingdom GCC Event Management Market Revenue (Million) Forecast, by Application 2020 & 2033
- Table 38: United Kingdom GCC Event Management Market Volume (Billion) Forecast, by Application 2020 & 2033
- Table 39: Germany GCC Event Management Market Revenue (Million) Forecast, by Application 2020 & 2033
- Table 40: Germany GCC Event Management Market Volume (Billion) Forecast, by Application 2020 & 2033
- Table 41: France GCC Event Management Market Revenue (Million) Forecast, by Application 2020 & 2033
- Table 42: France GCC Event Management Market Volume (Billion) Forecast, by Application 2020 & 2033
- Table 43: Italy GCC Event Management Market Revenue (Million) Forecast, by Application 2020 & 2033
- Table 44: Italy GCC Event Management Market Volume (Billion) Forecast, by Application 2020 & 2033
- Table 45: Spain GCC Event Management Market Revenue (Million) Forecast, by Application 2020 & 2033
- Table 46: Spain GCC Event Management Market Volume (Billion) Forecast, by Application 2020 & 2033
- Table 47: Russia GCC Event Management Market Revenue (Million) Forecast, by Application 2020 & 2033
- Table 48: Russia GCC Event Management Market Volume (Billion) Forecast, by Application 2020 & 2033
- Table 49: Benelux GCC Event Management Market Revenue (Million) Forecast, by Application 2020 & 2033
- Table 50: Benelux GCC Event Management Market Volume (Billion) Forecast, by Application 2020 & 2033
- Table 51: Nordics GCC Event Management Market Revenue (Million) Forecast, by Application 2020 & 2033
- Table 52: Nordics GCC Event Management Market Volume (Billion) Forecast, by Application 2020 & 2033
- Table 53: Rest of Europe GCC Event Management Market Revenue (Million) Forecast, by Application 2020 & 2033
- Table 54: Rest of Europe GCC Event Management Market Volume (Billion) Forecast, by Application 2020 & 2033
- Table 55: Global GCC Event Management Market Revenue Million Forecast, by Event Type 2020 & 2033
- Table 56: Global GCC Event Management Market Volume Billion Forecast, by Event Type 2020 & 2033
- Table 57: Global GCC Event Management Market Revenue Million Forecast, by Application 2020 & 2033
- Table 58: Global GCC Event Management Market Volume Billion Forecast, by Application 2020 & 2033
- Table 59: Global GCC Event Management Market Revenue Million Forecast, by Country 2020 & 2033
- Table 60: Global GCC Event Management Market Volume Billion Forecast, by Country 2020 & 2033
- Table 61: Turkey GCC Event Management Market Revenue (Million) Forecast, by Application 2020 & 2033
- Table 62: Turkey GCC Event Management Market Volume (Billion) Forecast, by Application 2020 & 2033
- Table 63: Israel GCC Event Management Market Revenue (Million) Forecast, by Application 2020 & 2033
- Table 64: Israel GCC Event Management Market Volume (Billion) Forecast, by Application 2020 & 2033
- Table 65: GCC GCC Event Management Market Revenue (Million) Forecast, by Application 2020 & 2033
- Table 66: GCC GCC Event Management Market Volume (Billion) Forecast, by Application 2020 & 2033
- Table 67: North Africa GCC Event Management Market Revenue (Million) Forecast, by Application 2020 & 2033
- Table 68: North Africa GCC Event Management Market Volume (Billion) Forecast, by Application 2020 & 2033
- Table 69: South Africa GCC Event Management Market Revenue (Million) Forecast, by Application 2020 & 2033
- Table 70: South Africa GCC Event Management Market Volume (Billion) Forecast, by Application 2020 & 2033
- Table 71: Rest of Middle East & Africa GCC Event Management Market Revenue (Million) Forecast, by Application 2020 & 2033
- Table 72: Rest of Middle East & Africa GCC Event Management Market Volume (Billion) Forecast, by Application 2020 & 2033
- Table 73: Global GCC Event Management Market Revenue Million Forecast, by Event Type 2020 & 2033
- Table 74: Global GCC Event Management Market Volume Billion Forecast, by Event Type 2020 & 2033
- Table 75: Global GCC Event Management Market Revenue Million Forecast, by Application 2020 & 2033
- Table 76: Global GCC Event Management Market Volume Billion Forecast, by Application 2020 & 2033
- Table 77: Global GCC Event Management Market Revenue Million Forecast, by Country 2020 & 2033
- Table 78: Global GCC Event Management Market Volume Billion Forecast, by Country 2020 & 2033
- Table 79: China GCC Event Management Market Revenue (Million) Forecast, by Application 2020 & 2033
- Table 80: China GCC Event Management Market Volume (Billion) Forecast, by Application 2020 & 2033
- Table 81: India GCC Event Management Market Revenue (Million) Forecast, by Application 2020 & 2033
- Table 82: India GCC Event Management Market Volume (Billion) Forecast, by Application 2020 & 2033
- Table 83: Japan GCC Event Management Market Revenue (Million) Forecast, by Application 2020 & 2033
- Table 84: Japan GCC Event Management Market Volume (Billion) Forecast, by Application 2020 & 2033
- Table 85: South Korea GCC Event Management Market Revenue (Million) Forecast, by Application 2020 & 2033
- Table 86: South Korea GCC Event Management Market Volume (Billion) Forecast, by Application 2020 & 2033
- Table 87: ASEAN GCC Event Management Market Revenue (Million) Forecast, by Application 2020 & 2033
- Table 88: ASEAN GCC Event Management Market Volume (Billion) Forecast, by Application 2020 & 2033
- Table 89: Oceania GCC Event Management Market Revenue (Million) Forecast, by Application 2020 & 2033
- Table 90: Oceania GCC Event Management Market Volume (Billion) Forecast, by Application 2020 & 2033
- Table 91: Rest of Asia Pacific GCC Event Management Market Revenue (Million) Forecast, by Application 2020 & 2033
- Table 92: Rest of Asia Pacific GCC Event Management Market Volume (Billion) Forecast, by Application 2020 & 2033
Frequently Asked Questions
1. What is the projected Compound Annual Growth Rate (CAGR) of the GCC Event Management Market?
The projected CAGR is approximately 9.06%.
2. Which companies are prominent players in the GCC Event Management Market?
Key companies in the market include Urban Events, Sky High, TEC, The Event Company, Emerald, Plan3Media, CWE, M&M Group, Great Wall Events, GM Events**List Not Exhaustive.
3. What are the main segments of the GCC Event Management Market?
The market segments include Event Type, Application.
4. Can you provide details about the market size?
The market size is estimated to be USD 78.25 Million as of 2022.
5. What are some drivers contributing to market growth?
The Corporate Sector Events is Expected to Take the Lead in the Market; High Number of Organizing Events Related to Several Social. Cultural. and Political Functions or Programs Require Management Services..
6. What are the notable trends driving market growth?
The Push for Growth in the Exhibitions Sector Has Contributed to the Expansion of the Event Management Sector.
7. Are there any restraints impacting market growth?
The Corporate Sector Events is Expected to Take the Lead in the Market; High Number of Organizing Events Related to Several Social. Cultural. and Political Functions or Programs Require Management Services..
8. Can you provide examples of recent developments in the market?
March 2024: Emerald Holding Inc. acquired Hotel Interactive (HI), a distinguished B2B digital media platform renowned for its high-quality hosted-buyer events in the hospitality and senior living industries. Following the acquisition, HI became part of Emerald's Connecting Point Marketing Group (CPMG). This strategic integration was intended to enhance their existing portfolio of premium-hosted buyer events, facilitating meaningful one-on-one interactions among industry leaders in significant verticals.
9. What pricing options are available for accessing the report?
Pricing options include single-user, multi-user, and enterprise licenses priced at USD 3800, USD 4500, and USD 5800 respectively.
10. Is the market size provided in terms of value or volume?
The market size is provided in terms of value, measured in Million and volume, measured in Billion.
11. Are there any specific market keywords associated with the report?
Yes, the market keyword associated with the report is "GCC Event Management Market," which aids in identifying and referencing the specific market segment covered.
12. How do I determine which pricing option suits my needs best?
The pricing options vary based on user requirements and access needs. Individual users may opt for single-user licenses, while businesses requiring broader access may choose multi-user or enterprise licenses for cost-effective access to the report.
13. Are there any additional resources or data provided in the GCC Event Management Market report?
While the report offers comprehensive insights, it's advisable to review the specific contents or supplementary materials provided to ascertain if additional resources or data are available.
14. How can I stay updated on further developments or reports in the GCC Event Management Market?
To stay informed about further developments, trends, and reports in the GCC Event Management Market, consider subscribing to industry newsletters, following relevant companies and organizations, or regularly checking reputable industry news sources and publications.
Methodology
Step 1 - Identification of Relevant Samples Size from Population Database


Step 2 - Approaches for Defining Global Market Size (Value, Volume* & Price*)

Note*: In applicable scenarios
Step 3 - Data Sources
Primary Research
- Web Analytics
- Survey Reports
- Research Institute
- Latest Research Reports
- Opinion Leaders
Secondary Research
- Annual Reports
- White Paper
- Latest Press Release
- Industry Association
- Paid Database
- Investor Presentations

Step 4 - Data Triangulation
Involves using different sources of information in order to increase the validity of a study
These sources are likely to be stakeholders in a program - participants, other researchers, program staff, other community members, and so on.
Then we put all data in single framework & apply various statistical tools to find out the dynamic on the market.
During the analysis stage, feedback from the stakeholder groups would be compared to determine areas of agreement as well as areas of divergence