

Key Insights
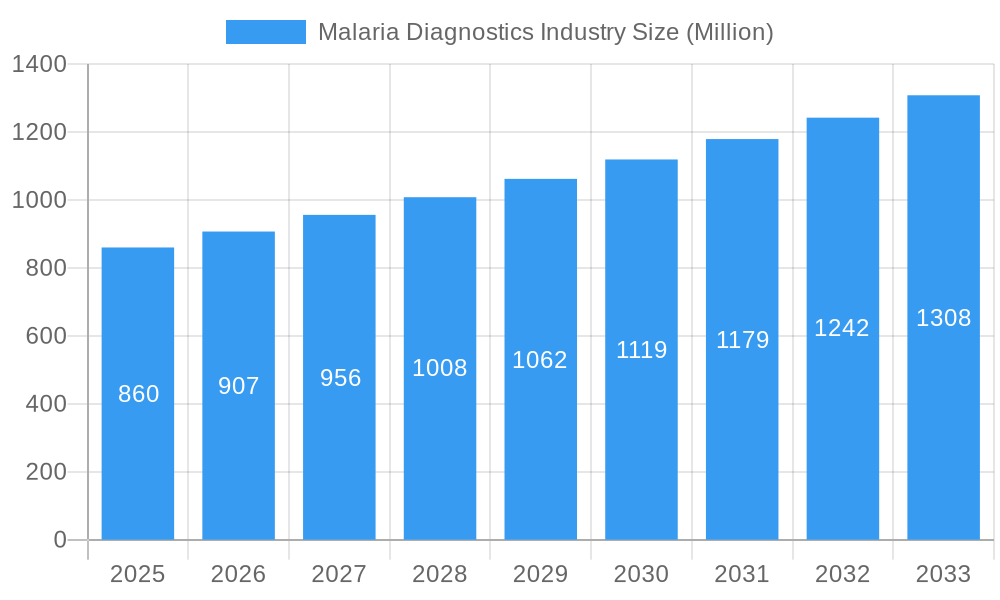
The malaria diagnostics market, valued at $0.86 billion in 2025, is projected to experience robust growth, driven by increasing malaria prevalence in endemic regions, particularly in sub-Saharan Africa and Southeast Asia. This growth is further fueled by advancements in diagnostic technologies, such as rapid diagnostic tests (RDTs) and molecular diagnostics offering faster, more accurate, and easier-to-use solutions compared to traditional microscopic methods. The rising demand for point-of-care diagnostics, enabling quicker treatment initiation and improved patient outcomes, significantly contributes to market expansion. Government initiatives promoting malaria eradication programs and increased healthcare infrastructure investments in developing nations also play a vital role. However, challenges such as the high cost of advanced technologies, particularly molecular diagnostics, limited access to healthcare in remote areas, and the emergence of drug-resistant malaria strains act as restraints to market growth. The market segmentation reveals that RDTs currently dominate, but molecular diagnostics are poised for substantial growth due to their superior accuracy and potential for early detection of drug resistance. Major players are actively investing in research and development to improve diagnostic accuracy, accessibility, and affordability, further shaping market dynamics. The consistent 5.23% CAGR projected through 2033 indicates a continuously expanding market opportunity.
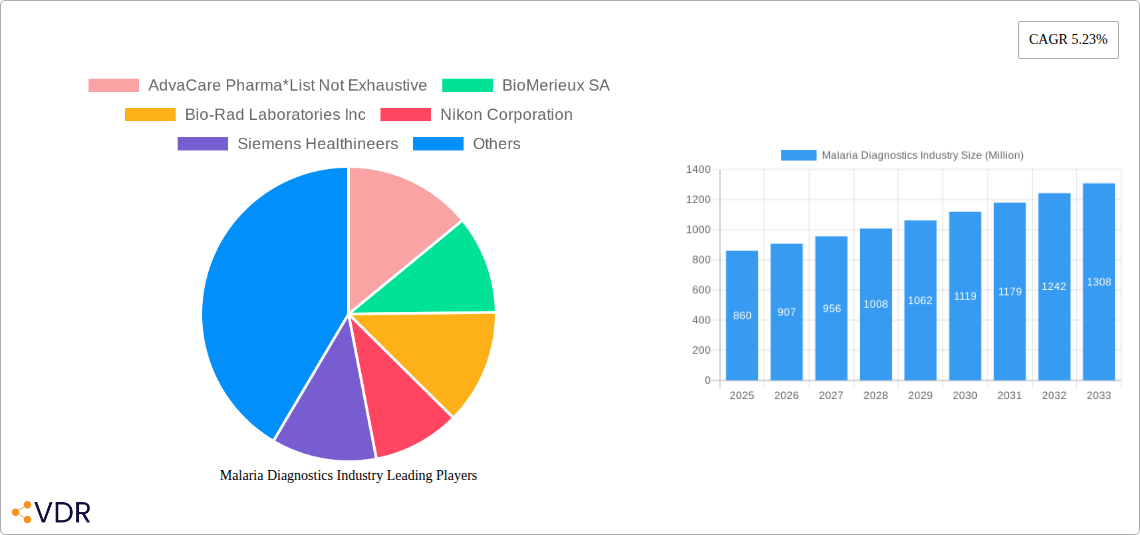
Malaria Diagnostics Industry Market Size (In Million)
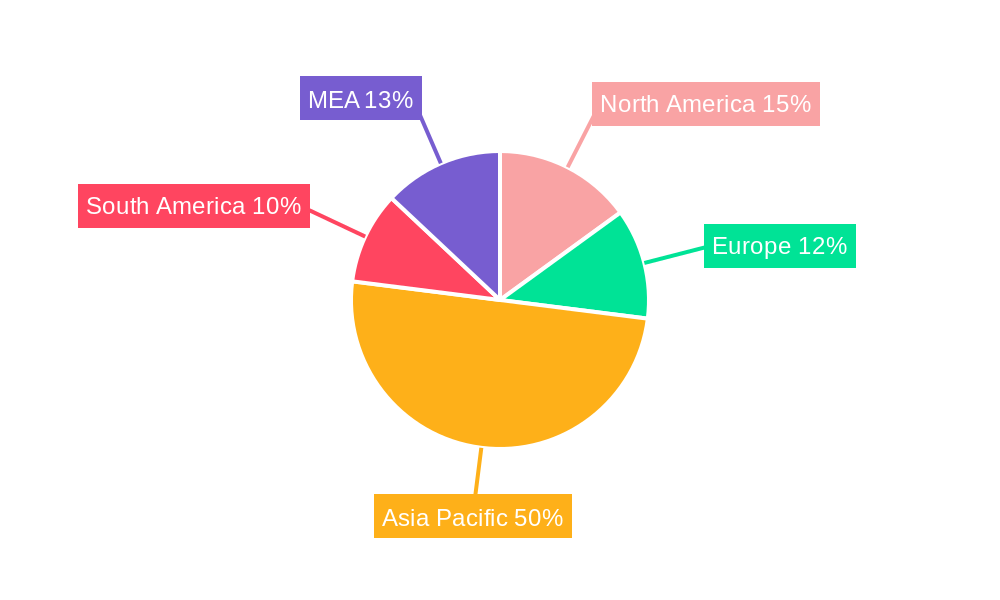
The geographical distribution showcases significant regional variations, with the highest market share currently held by regions with the highest malaria burden. North America and Europe, while experiencing growth, contribute comparatively less to the overall market size due to lower malaria prevalence. Asia Pacific, particularly India, China, and Southeast Asian nations, represent a key focus area for market growth, fueled by the large populations living in malaria-prone regions. Efforts towards improved disease surveillance, coupled with strategic partnerships between diagnostic manufacturers, healthcare organizations, and government agencies, are likely to accelerate market penetration in these areas. Furthermore, the ongoing development of next-generation diagnostics, including integrated platforms combining multiple diagnostic technologies, is anticipated to reshape the competitive landscape and drive market expansion over the forecast period. The market is expected to become increasingly competitive with both established and emerging players vying for a share of the growing demand for reliable and accessible malaria diagnostic solutions.
Malaria Diagnostics Industry Company Market Share
Malaria Diagnostics Industry: A Comprehensive Market Report (2019-2033)
This comprehensive report provides an in-depth analysis of the Malaria Diagnostics industry, encompassing market dynamics, growth trends, regional dominance, product landscape, and future outlook. The study period covers 2019-2033, with 2025 as the base and estimated year. This report is crucial for industry professionals, investors, and stakeholders seeking a clear understanding of this vital sector. The report analyzes the parent market of In-vitro Diagnostics and the child market of Malaria Diagnostics.
Malaria Diagnostics Industry Market Dynamics & Structure
This section analyzes the market concentration, technological innovation drivers, regulatory frameworks, competitive product substitutes, end-user demographics, and M&A trends within the Malaria Diagnostics industry. The global market size in 2024 is estimated at xx Million, with a projected xx% CAGR from 2025 to 2033.
- Market Concentration: The industry exhibits a moderately concentrated structure, with a few major players holding significant market share. The top five companies account for approximately xx% of the market.
- Technological Innovation: Continuous innovation in diagnostic technologies, particularly in RDTs and molecular diagnostics, is a key driver. However, high R&D costs and regulatory hurdles pose challenges.
- Regulatory Frameworks: Stringent regulatory approvals for new diagnostic products influence market entry and growth. Variances in regulatory landscapes across different regions impact market penetration.
- Competitive Landscape: The market witnesses intense competition driven by product differentiation, pricing strategies, and geographical expansion. The presence of both large multinational corporations and smaller specialized companies creates a dynamic environment.
- M&A Activity: The past five years have seen xx M&A deals in the malaria diagnostics space, driven by strategic expansion and technological acquisitions. The average deal size is estimated at xx Million.
- End-User Demographics: The primary end-users are hospitals, clinics, diagnostic laboratories, and public health organizations in malaria-endemic regions. Growing healthcare infrastructure and increased awareness are key factors.
Malaria Diagnostics Industry Growth Trends & Insights
This section leverages extensive primary and secondary research to analyze market size evolution, adoption rates, technological disruptions, and consumer behavior shifts within the Malaria Diagnostics industry. The global market is projected to reach xx Million by 2033, exhibiting a significant growth trajectory.
The historical period (2019-2024) showcased substantial growth, fueled by increased disease prevalence, improved healthcare infrastructure in endemic regions, and the introduction of advanced diagnostic technologies. Factors such as rising government initiatives for malaria eradication and growing awareness among populations contribute to market growth. The adoption rate of rapid diagnostic tests (RDTs) has increased significantly, exceeding xx% in several regions. However, challenges such as inconsistent healthcare access and limited affordability hinder wider market penetration in certain areas. Technological advancements, such as the development of more sensitive and specific molecular diagnostic tests, are driving market evolution. Consumer behavior is shifting towards a preference for rapid, point-of-care diagnostic solutions, influencing product development and market demand.
Dominant Regions, Countries, or Segments in Malaria Diagnostics Industry
Sub-Saharan Africa holds the largest market share in the Malaria Diagnostics industry, driven by high malaria prevalence, increasing healthcare investment, and government initiatives. Asia-Pacific is the second largest market, with significant growth potential.
- Technology Segments:
- Rapid Diagnostic Tests (RDTs): This segment dominates the market, owing to its ease of use, affordability, and rapid results. The market share of RDTs is estimated at xx%.
- Microscopic Diagnostics: Although cost-effective, microscopic diagnostics are limited by its dependence on skilled personnel and time-consuming procedures.
- Molecular Diagnostics: This segment shows promising growth potential, driven by increased accuracy and the ability to detect drug resistance. However, high costs and the need for specialized equipment hinder widespread adoption.
- Clinical Diagnostics: This segment encompasses various laboratory-based tests and contributes significantly to the overall market. The rising prevalence of malaria and improved healthcare infrastructure in several countries contribute to the segment's growth.
- Other Technologies: This category encompasses emerging technologies with significant potential for future growth, but currently holds a relatively small market share.
Key drivers for regional dominance include strong government support for malaria control programs, increasing healthcare spending, expanding healthcare infrastructure, and rising disease awareness.
Malaria Diagnostics Industry Product Landscape
The Malaria Diagnostics market offers a diverse range of products, including RDTs, microscopic slides, PCR-based tests, and other advanced molecular diagnostic tools. These products vary in terms of sensitivity, specificity, speed, and cost. Recent innovations include the development of highly sensitive RDTs with improved accuracy and the introduction of portable PCR devices for point-of-care diagnostics. These advancements cater to the need for faster, more accurate, and accessible diagnostic solutions in resource-limited settings. The unique selling propositions often focus on ease of use, cost-effectiveness, accuracy, and rapid turnaround time.
Key Drivers, Barriers & Challenges in Malaria Diagnostics Industry
Key Drivers:
- Increasing prevalence of malaria in endemic regions.
- Growing government initiatives and funding for malaria control programs.
- Technological advancements leading to more accurate and affordable diagnostic tools.
- Rising awareness among populations regarding malaria prevention and diagnosis.
Challenges & Restraints:
- High cost of advanced diagnostic technologies, limiting access in resource-constrained settings.
- Challenges related to the availability of skilled personnel for using sophisticated diagnostic techniques.
- Inconsistent healthcare infrastructure and supply chain disruptions in some regions.
- Regulatory hurdles and stringent approval processes for new diagnostic products. These hurdles can increase time to market and development costs.
- Competition from established players with extensive market reach and brand recognition.
Emerging Opportunities in Malaria Diagnostics Industry
- Expanding into untapped markets, especially in underserved rural areas in malaria-endemic countries.
- Development of innovative point-of-care diagnostic tools that are user-friendly, portable, and affordable.
- Focus on developing diagnostics that can detect drug resistance to ensure effective treatment strategies.
- Collaboration with public health organizations and government bodies to improve healthcare access.
Growth Accelerators in the Malaria Diagnostics Industry
Technological advancements, specifically in molecular diagnostics and point-of-care technologies, are key catalysts for industry growth. Strategic partnerships between diagnostic companies, research institutions, and international organizations are crucial in expanding access to diagnostics. Furthermore, expanding market access to underserved regions through effective distribution channels and affordability programs is crucial for long-term growth.
Key Players Shaping the Malaria Diagnostics Industry Market
- AdvaCare Pharma
- BioMerieux SA
- Bio-Rad Laboratories Inc
- Nikon Corporation
- Siemens Healthineers
- Abbott Laboratories
- Ortho Clinical Diagnostics
- Premier Medical Corporation Pvt Ltd
- Advy Chemical Pvt Ltd
- Zephyr Biomedicals
- Access Bio Inc
- Thermo Fisher Scientific
Notable Milestones in Malaria Diagnostics Industry Sector
- June 2022: SC Johnson and the Global Fund partnered to eradicate malaria. The Global Fund's substantial investment in malaria control programs significantly impacted market growth by increasing funding for diagnostic initiatives.
- February 2022: The Kenya Medical Research Institute (KEMRI) launched the Plasmochek diagnostic kit, a notable development impacting the local market and potentially influencing the adoption of similar technologies elsewhere.
In-Depth Malaria Diagnostics Industry Market Outlook
The Malaria Diagnostics market is poised for significant growth, driven by continuous technological innovation, increasing healthcare investment in endemic regions, and sustained efforts to eradicate malaria globally. Strategic partnerships, expansion into untapped markets, and the development of user-friendly, affordable diagnostic tools will shape future market potential. Focus on improving accessibility, particularly in underserved areas, will be key to unlocking the full market potential and achieving the goal of malaria eradication.
Malaria Diagnostics Industry Segmentation
-
1. Technology
- 1.1. Clinical Diagnostics
- 1.2. Microscopic Diagnostics
- 1.3. Rapid Diagnostic Tests (RDTs)
- 1.4. Molecular Diagnostics
- 1.5. Other Technologies
Malaria Diagnostics Industry Segmentation By Geography
-
1. Americas
- 1.1. Venezuela
- 1.2. Brazil
- 1.3. Colombia
- 1.4. Rest of the Americas
-
2. Europe
- 2.1. Germany
- 2.2. United Kingdom
- 2.3. France
- 2.4. Turkey
- 2.5. Spain
- 2.6. Rest of Europe
- 3. Asia Pacific
-
4. India
- 4.1. Myanmar
- 4.2. Indonesia
- 4.3. Pakistan
- 4.4. China
- 4.5. Papua New Guinea
- 4.6. Cambodia
- 4.7. Rest of Asia Pacific
-
5. Africa
- 5.1. Democratic Republic of Congo
- 5.2. Nigeria
- 5.3. Uganda
- 5.4. Rest of Africa
Malaria Diagnostics Industry Regional Market Share
Geographic Coverage of Malaria Diagnostics Industry
Malaria Diagnostics Industry REPORT HIGHLIGHTS
| Aspects | Details |
|---|---|
| Study Period | 2020-2034 |
| Base Year | 2025 |
| Estimated Year | 2026 |
| Forecast Period | 2026-2034 |
| Historical Period | 2020-2025 |
| Growth Rate | CAGR of 5.23% from 2020-2034 |
| Segmentation |
|
Table of Contents
- 1. Introduction
- 1.1. Research Scope
- 1.2. Market Segmentation
- 1.3. Research Objective
- 1.4. Definitions and Assumptions
- 2. Executive Summary
- 2.1. Market Snapshot
- 3. Market Dynamics
- 3.1. Market Drivers
- 3.2. Market Restrains
- 3.3. Market Trends
- 3.4. Market Opportunities
- 4. Market Factor Analysis
- 4.1. Porters Five Forces
- 4.1.1. Bargaining Power of Suppliers
- 4.1.2. Bargaining Power of Buyers
- 4.1.3. Threat of New Entrants
- 4.1.4. Threat of Substitutes
- 4.1.5. Competitive Rivalry
- 4.2. PESTEL analysis
- 4.3. BCG Analysis
- 4.3.1. Stars (High Growth, High Market Share)
- 4.3.2. Cash Cows (Low Growth, High Market Share)
- 4.3.3. Question Mark (High Growth, Low Market Share)
- 4.3.4. Dogs (Low Growth, Low Market Share)
- 4.4. Ansoff Matrix Analysis
- 4.5. Supply Chain Analysis
- 4.6. Regulatory Landscape
- 4.7. Current Market Potential and Opportunity Assessment (TAM–SAM–SOM Framework)
- 4.8. VDR Analyst Note
- 4.1. Porters Five Forces
- 5. Market Analysis, Insights and Forecast 2021-2033
- 5.1. Market Analysis, Insights and Forecast - by Technology
- 5.1.1. Clinical Diagnostics
- 5.1.2. Microscopic Diagnostics
- 5.1.3. Rapid Diagnostic Tests (RDTs)
- 5.1.4. Molecular Diagnostics
- 5.1.5. Other Technologies
- 5.2. Market Analysis, Insights and Forecast - by Region
- 5.2.1. Americas
- 5.2.2. Europe
- 5.2.3. Asia Pacific
- 5.2.4. India
- 5.2.5. Africa
- 5.1. Market Analysis, Insights and Forecast - by Technology
- 6. Global Malaria Diagnostics Industry Analysis, Insights and Forecast, 2021-2033
- 6.1. Market Analysis, Insights and Forecast - by Technology
- 6.1.1. Clinical Diagnostics
- 6.1.2. Microscopic Diagnostics
- 6.1.3. Rapid Diagnostic Tests (RDTs)
- 6.1.4. Molecular Diagnostics
- 6.1.5. Other Technologies
- 6.1. Market Analysis, Insights and Forecast - by Technology
- 7. Americas Malaria Diagnostics Industry Analysis, Insights and Forecast, 2021-2033
- 7.1. Market Analysis, Insights and Forecast - by Technology
- 7.1.1. Clinical Diagnostics
- 7.1.2. Microscopic Diagnostics
- 7.1.3. Rapid Diagnostic Tests (RDTs)
- 7.1.4. Molecular Diagnostics
- 7.1.5. Other Technologies
- 7.1. Market Analysis, Insights and Forecast - by Technology
- 8. Europe Malaria Diagnostics Industry Analysis, Insights and Forecast, 2021-2033
- 8.1. Market Analysis, Insights and Forecast - by Technology
- 8.1.1. Clinical Diagnostics
- 8.1.2. Microscopic Diagnostics
- 8.1.3. Rapid Diagnostic Tests (RDTs)
- 8.1.4. Molecular Diagnostics
- 8.1.5. Other Technologies
- 8.1. Market Analysis, Insights and Forecast - by Technology
- 9. Asia Pacific Malaria Diagnostics Industry Analysis, Insights and Forecast, 2021-2033
- 9.1. Market Analysis, Insights and Forecast - by Technology
- 9.1.1. Clinical Diagnostics
- 9.1.2. Microscopic Diagnostics
- 9.1.3. Rapid Diagnostic Tests (RDTs)
- 9.1.4. Molecular Diagnostics
- 9.1.5. Other Technologies
- 9.1. Market Analysis, Insights and Forecast - by Technology
- 10. India Malaria Diagnostics Industry Analysis, Insights and Forecast, 2021-2033
- 10.1. Market Analysis, Insights and Forecast - by Technology
- 10.1.1. Clinical Diagnostics
- 10.1.2. Microscopic Diagnostics
- 10.1.3. Rapid Diagnostic Tests (RDTs)
- 10.1.4. Molecular Diagnostics
- 10.1.5. Other Technologies
- 10.1. Market Analysis, Insights and Forecast - by Technology
- 11. Africa Malaria Diagnostics Industry Analysis, Insights and Forecast, 2021-2033
- 11.1. Market Analysis, Insights and Forecast - by Technology
- 11.1.1. Clinical Diagnostics
- 11.1.2. Microscopic Diagnostics
- 11.1.3. Rapid Diagnostic Tests (RDTs)
- 11.1.4. Molecular Diagnostics
- 11.1.5. Other Technologies
- 11.1. Market Analysis, Insights and Forecast - by Technology
- 12. Competitive Analysis
- 12.1. Company Profiles
- 12.1.1 AdvaCare Pharma*List Not Exhaustive
- 12.1.1.1. Company Overview
- 12.1.1.2. Products
- 12.1.1.3. Company Financials
- 12.1.1.4. SWOT Analysis
- 12.1.2 BioMerieux SA
- 12.1.2.1. Company Overview
- 12.1.2.2. Products
- 12.1.2.3. Company Financials
- 12.1.2.4. SWOT Analysis
- 12.1.3 Bio-Rad Laboratories Inc
- 12.1.3.1. Company Overview
- 12.1.3.2. Products
- 12.1.3.3. Company Financials
- 12.1.3.4. SWOT Analysis
- 12.1.4 Nikon Corporation
- 12.1.4.1. Company Overview
- 12.1.4.2. Products
- 12.1.4.3. Company Financials
- 12.1.4.4. SWOT Analysis
- 12.1.5 Siemens Healthineers
- 12.1.5.1. Company Overview
- 12.1.5.2. Products
- 12.1.5.3. Company Financials
- 12.1.5.4. SWOT Analysis
- 12.1.6 Abbott Laboratories
- 12.1.6.1. Company Overview
- 12.1.6.2. Products
- 12.1.6.3. Company Financials
- 12.1.6.4. SWOT Analysis
- 12.1.7 Ortho Clinical Diagnostics
- 12.1.7.1. Company Overview
- 12.1.7.2. Products
- 12.1.7.3. Company Financials
- 12.1.7.4. SWOT Analysis
- 12.1.8 Premier Medical Corporation Pvt Ltd
- 12.1.8.1. Company Overview
- 12.1.8.2. Products
- 12.1.8.3. Company Financials
- 12.1.8.4. SWOT Analysis
- 12.1.9 Advy Chemical Pvt Ltd
- 12.1.9.1. Company Overview
- 12.1.9.2. Products
- 12.1.9.3. Company Financials
- 12.1.9.4. SWOT Analysis
- 12.1.10 Zephyr Biomedicals
- 12.1.10.1. Company Overview
- 12.1.10.2. Products
- 12.1.10.3. Company Financials
- 12.1.10.4. SWOT Analysis
- 12.1.11 Access Bio Inc
- 12.1.11.1. Company Overview
- 12.1.11.2. Products
- 12.1.11.3. Company Financials
- 12.1.11.4. SWOT Analysis
- 12.1.12 Thermo Fisher Scientific
- 12.1.12.1. Company Overview
- 12.1.12.2. Products
- 12.1.12.3. Company Financials
- 12.1.12.4. SWOT Analysis
- 12.1.1 AdvaCare Pharma*List Not Exhaustive
- 12.2. Market Entropy
- 12.2.1 Company's Key Areas Served
- 12.2.2 Recent Developments
- 12.3. Company Market Share Analysis 2025
- 12.3.1 Top 5 Companies Market Share Analysis
- 12.3.2 Top 3 Companies Market Share Analysis
- 12.4. List of Potential Customers
- 13. Research Methodology
List of Figures
- Figure 1: Global Malaria Diagnostics Industry Revenue Breakdown (Million, %) by Region 2025 & 2033
- Figure 2: Americas Malaria Diagnostics Industry Revenue (Million), by Technology 2025 & 2033
- Figure 3: Americas Malaria Diagnostics Industry Revenue Share (%), by Technology 2025 & 2033
- Figure 4: Americas Malaria Diagnostics Industry Revenue (Million), by Country 2025 & 2033
- Figure 5: Americas Malaria Diagnostics Industry Revenue Share (%), by Country 2025 & 2033
- Figure 6: Europe Malaria Diagnostics Industry Revenue (Million), by Technology 2025 & 2033
- Figure 7: Europe Malaria Diagnostics Industry Revenue Share (%), by Technology 2025 & 2033
- Figure 8: Europe Malaria Diagnostics Industry Revenue (Million), by Country 2025 & 2033
- Figure 9: Europe Malaria Diagnostics Industry Revenue Share (%), by Country 2025 & 2033
- Figure 10: Asia Pacific Malaria Diagnostics Industry Revenue (Million), by Technology 2025 & 2033
- Figure 11: Asia Pacific Malaria Diagnostics Industry Revenue Share (%), by Technology 2025 & 2033
- Figure 12: Asia Pacific Malaria Diagnostics Industry Revenue (Million), by Country 2025 & 2033
- Figure 13: Asia Pacific Malaria Diagnostics Industry Revenue Share (%), by Country 2025 & 2033
- Figure 14: India Malaria Diagnostics Industry Revenue (Million), by Technology 2025 & 2033
- Figure 15: India Malaria Diagnostics Industry Revenue Share (%), by Technology 2025 & 2033
- Figure 16: India Malaria Diagnostics Industry Revenue (Million), by Country 2025 & 2033
- Figure 17: India Malaria Diagnostics Industry Revenue Share (%), by Country 2025 & 2033
- Figure 18: Africa Malaria Diagnostics Industry Revenue (Million), by Technology 2025 & 2033
- Figure 19: Africa Malaria Diagnostics Industry Revenue Share (%), by Technology 2025 & 2033
- Figure 20: Africa Malaria Diagnostics Industry Revenue (Million), by Country 2025 & 2033
- Figure 21: Africa Malaria Diagnostics Industry Revenue Share (%), by Country 2025 & 2033
List of Tables
- Table 1: Global Malaria Diagnostics Industry Revenue Million Forecast, by Technology 2020 & 2033
- Table 2: Global Malaria Diagnostics Industry Revenue Million Forecast, by Region 2020 & 2033
- Table 3: Global Malaria Diagnostics Industry Revenue Million Forecast, by Technology 2020 & 2033
- Table 4: Global Malaria Diagnostics Industry Revenue Million Forecast, by Country 2020 & 2033
- Table 5: Venezuela Malaria Diagnostics Industry Revenue (Million) Forecast, by Application 2020 & 2033
- Table 6: Brazil Malaria Diagnostics Industry Revenue (Million) Forecast, by Application 2020 & 2033
- Table 7: Colombia Malaria Diagnostics Industry Revenue (Million) Forecast, by Application 2020 & 2033
- Table 8: Rest of the Americas Malaria Diagnostics Industry Revenue (Million) Forecast, by Application 2020 & 2033
- Table 9: Global Malaria Diagnostics Industry Revenue Million Forecast, by Technology 2020 & 2033
- Table 10: Global Malaria Diagnostics Industry Revenue Million Forecast, by Country 2020 & 2033
- Table 11: Germany Malaria Diagnostics Industry Revenue (Million) Forecast, by Application 2020 & 2033
- Table 12: United Kingdom Malaria Diagnostics Industry Revenue (Million) Forecast, by Application 2020 & 2033
- Table 13: France Malaria Diagnostics Industry Revenue (Million) Forecast, by Application 2020 & 2033
- Table 14: Turkey Malaria Diagnostics Industry Revenue (Million) Forecast, by Application 2020 & 2033
- Table 15: Spain Malaria Diagnostics Industry Revenue (Million) Forecast, by Application 2020 & 2033
- Table 16: Rest of Europe Malaria Diagnostics Industry Revenue (Million) Forecast, by Application 2020 & 2033
- Table 17: Global Malaria Diagnostics Industry Revenue Million Forecast, by Technology 2020 & 2033
- Table 18: Global Malaria Diagnostics Industry Revenue Million Forecast, by Country 2020 & 2033
- Table 19: Global Malaria Diagnostics Industry Revenue Million Forecast, by Technology 2020 & 2033
- Table 20: Global Malaria Diagnostics Industry Revenue Million Forecast, by Country 2020 & 2033
- Table 21: Myanmar Malaria Diagnostics Industry Revenue (Million) Forecast, by Application 2020 & 2033
- Table 22: Indonesia Malaria Diagnostics Industry Revenue (Million) Forecast, by Application 2020 & 2033
- Table 23: Pakistan Malaria Diagnostics Industry Revenue (Million) Forecast, by Application 2020 & 2033
- Table 24: China Malaria Diagnostics Industry Revenue (Million) Forecast, by Application 2020 & 2033
- Table 25: Papua New Guinea Malaria Diagnostics Industry Revenue (Million) Forecast, by Application 2020 & 2033
- Table 26: Cambodia Malaria Diagnostics Industry Revenue (Million) Forecast, by Application 2020 & 2033
- Table 27: Rest of Asia Pacific Malaria Diagnostics Industry Revenue (Million) Forecast, by Application 2020 & 2033
- Table 28: Global Malaria Diagnostics Industry Revenue Million Forecast, by Technology 2020 & 2033
- Table 29: Global Malaria Diagnostics Industry Revenue Million Forecast, by Country 2020 & 2033
- Table 30: Democratic Republic of Congo Malaria Diagnostics Industry Revenue (Million) Forecast, by Application 2020 & 2033
- Table 31: Nigeria Malaria Diagnostics Industry Revenue (Million) Forecast, by Application 2020 & 2033
- Table 32: Uganda Malaria Diagnostics Industry Revenue (Million) Forecast, by Application 2020 & 2033
- Table 33: Rest of Africa Malaria Diagnostics Industry Revenue (Million) Forecast, by Application 2020 & 2033
Frequently Asked Questions
1. What is the projected Compound Annual Growth Rate (CAGR) of the Malaria Diagnostics Industry?
The projected CAGR is approximately 5.23%.
2. Which companies are prominent players in the Malaria Diagnostics Industry?
Key companies in the market include AdvaCare Pharma*List Not Exhaustive, BioMerieux SA, Bio-Rad Laboratories Inc, Nikon Corporation, Siemens Healthineers, Abbott Laboratories, Ortho Clinical Diagnostics, Premier Medical Corporation Pvt Ltd, Advy Chemical Pvt Ltd, Zephyr Biomedicals, Access Bio Inc, Thermo Fisher Scientific.
3. What are the main segments of the Malaria Diagnostics Industry?
The market segments include Technology.
4. Can you provide details about the market size?
The market size is estimated to be USD 0.86 Million as of 2022.
5. What are some drivers contributing to market growth?
Growing Demand for Diagnostic Tools in Malaria-endemic Regions; Increasing Technological Advancements and Efficient Diagnostics; Scale-up of Rapid Diagnostic Tests and Universal Access to Diagnosis.
6. What are the notable trends driving market growth?
Microscopic Diagnostics is Expected to Hold the Highest Market Share in the Technology Segment.
7. Are there any restraints impacting market growth?
Increasing Number of Malaria-free Countries; Rising Demand for Low-cost Diagnostic Tools.
8. Can you provide examples of recent developments in the market?
In June 2022, SC Johnson and Global Fund partnered to eradicate malaria. The Global Fund provides 56% of all international financing for malaria programs (39% of total available resources) and invested more than USD 16 billion in malaria control programs to date.
9. What pricing options are available for accessing the report?
Pricing options include single-user, multi-user, and enterprise licenses priced at USD 4750, USD 5250, and USD 8750 respectively.
10. Is the market size provided in terms of value or volume?
The market size is provided in terms of value, measured in Million.
11. Are there any specific market keywords associated with the report?
Yes, the market keyword associated with the report is "Malaria Diagnostics Industry," which aids in identifying and referencing the specific market segment covered.
12. How do I determine which pricing option suits my needs best?
The pricing options vary based on user requirements and access needs. Individual users may opt for single-user licenses, while businesses requiring broader access may choose multi-user or enterprise licenses for cost-effective access to the report.
13. Are there any additional resources or data provided in the Malaria Diagnostics Industry report?
While the report offers comprehensive insights, it's advisable to review the specific contents or supplementary materials provided to ascertain if additional resources or data are available.
14. How can I stay updated on further developments or reports in the Malaria Diagnostics Industry?
To stay informed about further developments, trends, and reports in the Malaria Diagnostics Industry, consider subscribing to industry newsletters, following relevant companies and organizations, or regularly checking reputable industry news sources and publications.
Methodology
Step 1 - Identification of Relevant Samples Size from Population Database


Step 2 - Approaches for Defining Global Market Size (Value, Volume* & Price*)

Note*: In applicable scenarios
Step 3 - Data Sources
Primary Research
- Web Analytics
- Survey Reports
- Research Institute
- Latest Research Reports
- Opinion Leaders
Secondary Research
- Annual Reports
- White Paper
- Latest Press Release
- Industry Association
- Paid Database
- Investor Presentations

Step 4 - Data Triangulation
Involves using different sources of information in order to increase the validity of a study
These sources are likely to be stakeholders in a program - participants, other researchers, program staff, other community members, and so on.
Then we put all data in single framework & apply various statistical tools to find out the dynamic on the market.
During the analysis stage, feedback from the stakeholder groups would be compared to determine areas of agreement as well as areas of divergence