

Key Insights
The North America Performing Arts Companies market, valued at $193.38 million in the base year 2025, is poised for significant expansion. This growth is propelled by increasing consumer disposable income, a robust resurgence in live events post-pandemic, and a growing appreciation for cultural experiences among younger demographics. The sector's diversity, encompassing Broadway, concerts, circuses, and opera, ensures broad appeal. However, challenges such as fluctuating ticket prices and competition from digital entertainment necessitate agile strategies. Leading companies like The Walt Disney Company and Live Nation Entertainment leverage strong brand equity and innovative approaches to overcome these hurdles. Technological advancements, including immersive experiences and VR integration, offer substantial opportunities for innovation and market penetration. Regional market performance will vary, with metropolitan areas driving higher demand. Ongoing development of new venues and infrastructure will further support market expansion. The projected Compound Annual Growth Rate (CAGR) of 5.67% from 2025 to 2033 signals sustained growth, making this a compelling market for investment.
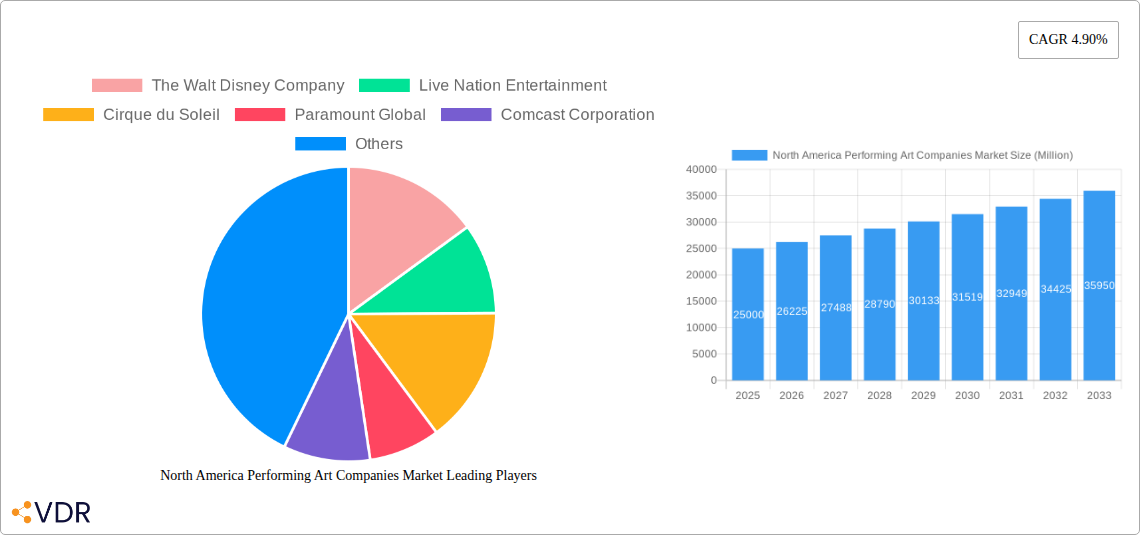
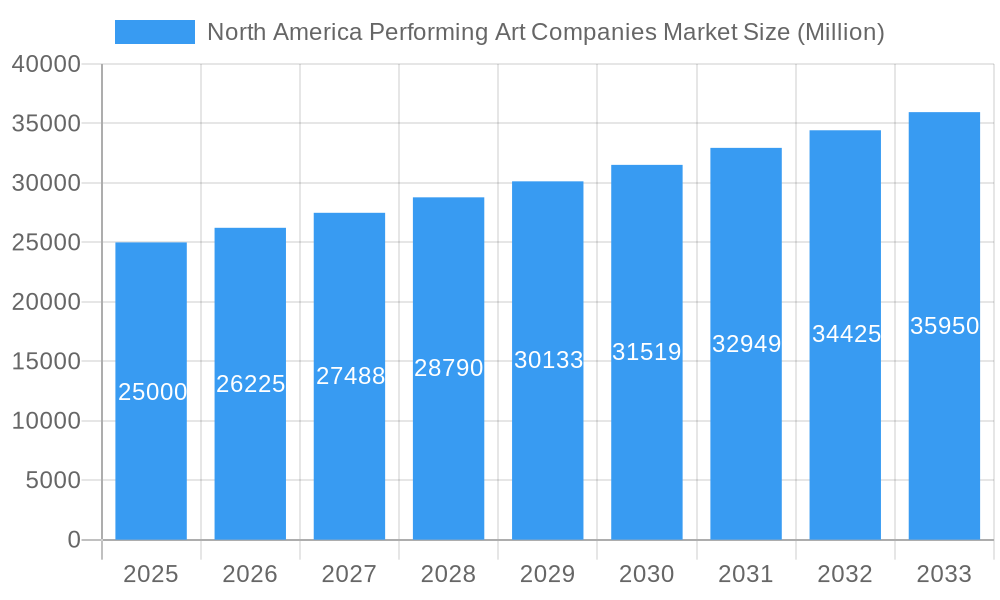
North America Performing Art Companies Market Market Size (In Million)
Market segmentation offers critical insights into the North American Performing Arts industry. Key segments include Broadway productions, concerts and live music, circuses and theater, and opera and ballet. Each segment is shaped by distinct audience preferences and evolving industry trends. The live music segment, in particular, is expected to surge, fueled by genre popularity and the rise of music festivals. Conversely, opera and ballet may require innovative strategies to engage younger audiences and mitigate ticket price concerns. Strategic collaborations between performing arts organizations and technology firms are anticipated to enhance audience engagement and revenue streams. Market consolidation and strategic acquisitions are probable as major players seek to expand their reach and diversify portfolios. The adaptability of performing arts companies to changing consumer demands, technological integration, and efficient cost management will be paramount for success in this competitive landscape.
North America Performing Art Companies Market Company Market Share
North America Performing Arts Companies Market Report: 2019-2033
This comprehensive report provides an in-depth analysis of the North America Performing Arts Companies Market, encompassing market dynamics, growth trends, key players, and future outlook. The study period covers 2019-2033, with a base year of 2025 and a forecast period of 2025-2033. This report is essential for industry professionals, investors, and anyone seeking a detailed understanding of this dynamic sector. The market is segmented by various performance art forms (e.g., theatre, music, dance) and geographic regions, providing a granular view of market opportunities. The total market size is predicted to reach xx Million by 2033.
North America Performing Art Companies Market Dynamics & Structure
The North American performing arts market is characterized by a moderately concentrated structure, with a few major players commanding significant market share. However, a multitude of smaller, independent companies also contribute significantly, creating a vibrant and diverse landscape. Technological innovation, particularly in areas like virtual reality (VR) and streaming technologies, is a key driver of market expansion, opening new avenues for content delivery and audience engagement. Regulatory frameworks, including copyright laws and licensing agreements, significantly impact the market's operational environment. The market also experiences competition from substitute forms of entertainment, such as online gaming and streaming services. End-user demographics are crucial, with younger generations exhibiting evolving preferences influencing market trends. Finally, mergers and acquisitions (M&A) activity plays a role in market consolidation and expansion.
- Market Concentration: Moderately concentrated, with top 5 players holding approximately xx% market share in 2025.
- Technological Innovation: VR/AR experiences, streaming platforms, and interactive performances driving growth.
- Regulatory Framework: Copyright, licensing, and labor laws influencing operational costs and strategies.
- Competitive Substitutes: Online gaming, streaming services, and other forms of entertainment posing challenges.
- End-User Demographics: Shifting preferences of younger audiences impacting content creation and distribution strategies.
- M&A Activity: Average of xx M&A deals per year observed between 2019-2024.
North America Performing Art Companies Market Growth Trends & Insights
The North American performing arts market experienced a period of disruption due to the COVID-19 pandemic (2019-2024), but has shown significant recovery and growth since the lifting of restrictions. The market's size evolved from xx Million in 2019 to xx Million in 2024, with a projected CAGR of xx% during the forecast period (2025-2033). This growth is attributed to factors such as increased disposable income, a resurgence in live entertainment demand, and technological advancements enabling wider reach and accessibility. Adoption rates of digital ticketing and streaming platforms are increasing, reflecting a shift in consumer behavior towards convenient and accessible entertainment options.
The integration of new technologies is disrupting traditional models, creating both opportunities and challenges for companies. Consumer behavior is evolving, with audiences seeking personalized experiences and diversified content. These trends are driving market innovation and reshaping industry strategies.
Dominant Regions, Countries, or Segments in North America Performing Art Companies Market
The New York City metropolitan area maintains its position as the dominant region within the North American performing arts market, driven by a high concentration of venues, talented artists, and a large, diverse audience base. Other major hubs include Los Angeles, Chicago, and Toronto, each contributing substantially to overall market size. Within specific segments, Broadway theatre in New York City and large-scale music concerts across the country demonstrate significant growth potential.
Key Drivers:
- High Population Density: Large urban areas provide a concentrated audience base.
- Established Infrastructure: Extensive networks of venues, supporting businesses, and talent pools.
- Government Support: Funding initiatives and tax incentives for arts organizations.
- Tourism: Significant contribution from international and domestic tourists.
Dominance Factors:
- Market Share: New York City accounts for approximately xx% of total market revenue.
- Growth Potential: High concentration of talent and ongoing investments in infrastructure.
- Brand Recognition: Established reputation as a global center for performing arts.
North America Performing Art Companies Market Product Landscape
Product innovation within the performing arts market is characterized by a constant evolution of show formats, technological integration, and audience engagement strategies. New immersive technologies, such as augmented reality (AR) and virtual reality (VR), are being integrated into performances to enhance audience experience. This includes live streaming, virtual concerts, and on-demand content. Metrics such as ticket sales, audience engagement, and critical acclaim are key indicators of product performance. Unique selling propositions focus on delivering unique and memorable experiences, leveraging both traditional and cutting-edge technologies.
Key Drivers, Barriers & Challenges in North America Performing Art Companies Market
Key Drivers: Increased disposable income, growing interest in live experiences, technological advancements enhancing accessibility and reach, and government funding initiatives supporting arts organizations.
Key Challenges: High operating costs, competition from alternative forms of entertainment, talent acquisition and retention, managing unpredictable economic conditions, and navigating ever-changing audience preferences. For example, the impact of economic downturns on consumer spending on entertainment can significantly reduce revenue, impacting profitability.
Emerging Opportunities in North America Performing Art Companies Market
Emerging opportunities lie in the expansion of digital distribution channels, the integration of immersive technologies, the development of hyper-personalized experiences, and the exploration of new market segments, such as virtual reality concerts and interactive performances. There is also scope for expanding into underserved communities and creating accessible, inclusive experiences.
Growth Accelerators in the North America Performing Art Companies Market Industry
Technological breakthroughs, particularly in virtual and augmented reality, are creating new avenues for content creation and distribution. Strategic partnerships between performing arts organizations and technology companies will further accelerate market growth. Expanding into new markets and diversifying offerings to cater to diverse audience preferences will also fuel growth.
Key Players Shaping the North America Performing Art Companies Market Market
- The Walt Disney Company
- Live Nation Entertainment
- Cirque du Soleil
- Paramount Global
- Comcast Corporation
- The Madison Square Garden Company
- Broadway Across America
- The Shubert Organization
- The Second City
- The Metropolitan Opera
Notable Milestones in North America Performing Art Companies Market Sector
November 2022: Fathom Events and The Metropolitan Opera renew their "The Met: Live in HD" series, extending their partnership through 2025-2026, showcasing the resilience and adaptability of the performing arts sector post-pandemic. This demonstrates a successful strategy for reaching wider audiences through cinematic distribution.
February 2023: Segerstrom Center for the Arts presents the North American premiere of Christopher Wheeldon's "Like Water for Chocolate," demonstrating continued investment in bringing high-quality productions to new audiences and fostering artistic innovation. This highlights the continued demand for premium live performances.
In-Depth North America Performing Art Companies Market Market Outlook
The North American performing arts market is poised for sustained growth, driven by technological innovation, evolving consumer preferences, and increased investment in the sector. Strategic partnerships, diversification of offerings, and expansion into new markets will shape the future landscape. The market's potential for growth is significant, with opportunities for both established players and new entrants to carve out successful niches.
North America Performing Art Companies Market Segmentation
-
1. Type of Performing Arts
- 1.1. Theatre
- 1.2. Music and Opera
- 1.3. Dance
- 1.4. Circus and Other Art Forms
-
2. Venue Type
- 2.1. Concert Halls
- 2.2. Theatres
- 2.3. Stadiums
-
3. Ticket Pricing
- 3.1. Premium
- 3.2. Mid-Range
- 3.3. Economy
North America Performing Art Companies Market Segmentation By Geography
-
1. North America
- 1.1. United States
- 1.2. Canada
- 1.3. Mexico
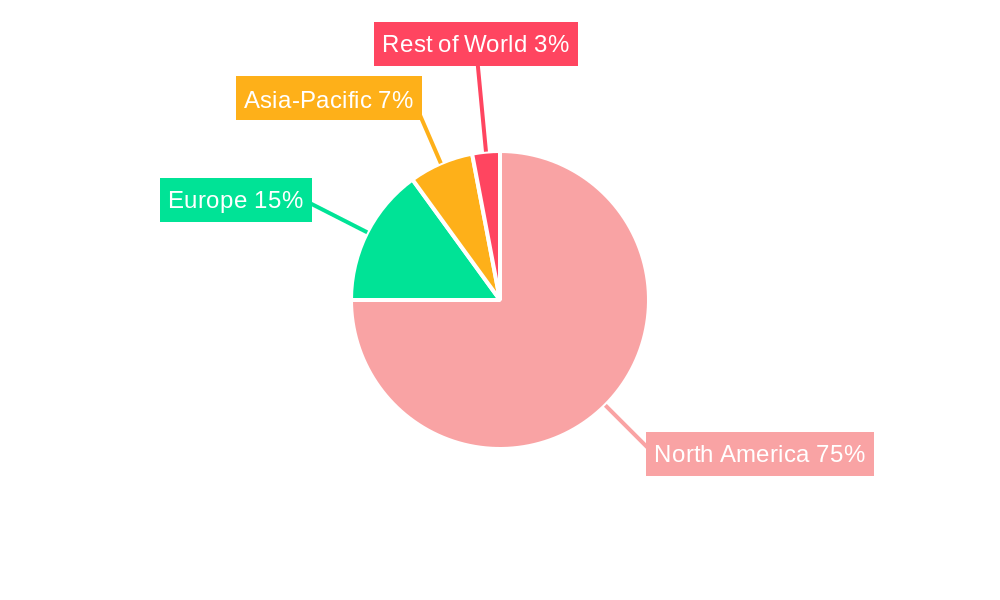
North America Performing Art Companies Market Regional Market Share
Geographic Coverage of North America Performing Art Companies Market
North America Performing Art Companies Market REPORT HIGHLIGHTS
| Aspects | Details |
|---|---|
| Study Period | 2020-2034 |
| Base Year | 2025 |
| Estimated Year | 2026 |
| Forecast Period | 2026-2034 |
| Historical Period | 2020-2025 |
| Growth Rate | CAGR of 5.67% from 2020-2034 |
| Segmentation |
|
Table of Contents
- 1. Introduction
- 1.1. Research Scope
- 1.2. Market Segmentation
- 1.3. Research Objective
- 1.4. Definitions and Assumptions
- 2. Executive Summary
- 2.1. Market Snapshot
- 3. Market Dynamics
- 3.1. Market Drivers
- 3.2. Market Restrains
- 3.3. Market Trends
- 3.4. Market Opportunities
- 4. Market Factor Analysis
- 4.1. Porters Five Forces
- 4.1.1. Bargaining Power of Suppliers
- 4.1.2. Bargaining Power of Buyers
- 4.1.3. Threat of New Entrants
- 4.1.4. Threat of Substitutes
- 4.1.5. Competitive Rivalry
- 4.2. PESTEL analysis
- 4.3. BCG Analysis
- 4.3.1. Stars (High Growth, High Market Share)
- 4.3.2. Cash Cows (Low Growth, High Market Share)
- 4.3.3. Question Mark (High Growth, Low Market Share)
- 4.3.4. Dogs (Low Growth, Low Market Share)
- 4.4. Ansoff Matrix Analysis
- 4.5. Supply Chain Analysis
- 4.6. Regulatory Landscape
- 4.7. Current Market Potential and Opportunity Assessment (TAM–SAM–SOM Framework)
- 4.8. VDR Analyst Note
- 4.1. Porters Five Forces
- 5. Market Analysis, Insights and Forecast 2021-2033
- 5.1. Market Analysis, Insights and Forecast - by Type of Performing Arts
- 5.1.1. Theatre
- 5.1.2. Music and Opera
- 5.1.3. Dance
- 5.1.4. Circus and Other Art Forms
- 5.2. Market Analysis, Insights and Forecast - by Venue Type
- 5.2.1. Concert Halls
- 5.2.2. Theatres
- 5.2.3. Stadiums
- 5.3. Market Analysis, Insights and Forecast - by Ticket Pricing
- 5.3.1. Premium
- 5.3.2. Mid-Range
- 5.3.3. Economy
- 5.4. Market Analysis, Insights and Forecast - by Region
- 5.4.1. North America
- 5.1. Market Analysis, Insights and Forecast - by Type of Performing Arts
- 6. North America Performing Art Companies Market Analysis, Insights and Forecast, 2021-2033
- 6.1. Market Analysis, Insights and Forecast - by Type of Performing Arts
- 6.1.1. Theatre
- 6.1.2. Music and Opera
- 6.1.3. Dance
- 6.1.4. Circus and Other Art Forms
- 6.2. Market Analysis, Insights and Forecast - by Venue Type
- 6.2.1. Concert Halls
- 6.2.2. Theatres
- 6.2.3. Stadiums
- 6.3. Market Analysis, Insights and Forecast - by Ticket Pricing
- 6.3.1. Premium
- 6.3.2. Mid-Range
- 6.3.3. Economy
- 6.1. Market Analysis, Insights and Forecast - by Type of Performing Arts
- 7. Competitive Analysis
- 7.1. Company Profiles
- 7.1.1 The Walt Disney Company
- 7.1.1.1. Company Overview
- 7.1.1.2. Products
- 7.1.1.3. Company Financials
- 7.1.1.4. SWOT Analysis
- 7.1.2 Live Nation Entertainment
- 7.1.2.1. Company Overview
- 7.1.2.2. Products
- 7.1.2.3. Company Financials
- 7.1.2.4. SWOT Analysis
- 7.1.3 Cirque du Soleil
- 7.1.3.1. Company Overview
- 7.1.3.2. Products
- 7.1.3.3. Company Financials
- 7.1.3.4. SWOT Analysis
- 7.1.4 Paramount Global
- 7.1.4.1. Company Overview
- 7.1.4.2. Products
- 7.1.4.3. Company Financials
- 7.1.4.4. SWOT Analysis
- 7.1.5 Comcast Corporation
- 7.1.5.1. Company Overview
- 7.1.5.2. Products
- 7.1.5.3. Company Financials
- 7.1.5.4. SWOT Analysis
- 7.1.6 The Madison Square Garden Company
- 7.1.6.1. Company Overview
- 7.1.6.2. Products
- 7.1.6.3. Company Financials
- 7.1.6.4. SWOT Analysis
- 7.1.7 Broadway Across America
- 7.1.7.1. Company Overview
- 7.1.7.2. Products
- 7.1.7.3. Company Financials
- 7.1.7.4. SWOT Analysis
- 7.1.8 The Shubert Organization
- 7.1.8.1. Company Overview
- 7.1.8.2. Products
- 7.1.8.3. Company Financials
- 7.1.8.4. SWOT Analysis
- 7.1.9 The Second City
- 7.1.9.1. Company Overview
- 7.1.9.2. Products
- 7.1.9.3. Company Financials
- 7.1.9.4. SWOT Analysis
- 7.1.10 The Metropolitan Opera**List Not Exhaustive
- 7.1.10.1. Company Overview
- 7.1.10.2. Products
- 7.1.10.3. Company Financials
- 7.1.10.4. SWOT Analysis
- 7.1.1 The Walt Disney Company
- 7.2. Market Entropy
- 7.2.1 Company's Key Areas Served
- 7.2.2 Recent Developments
- 7.3. Company Market Share Analysis 2025
- 7.3.1 Top 5 Companies Market Share Analysis
- 7.3.2 Top 3 Companies Market Share Analysis
- 7.4. List of Potential Customers
- 8. Research Methodology
List of Figures
- Figure 1: North America Performing Art Companies Market Revenue Breakdown (million, %) by Product 2025 & 2033
- Figure 2: North America Performing Art Companies Market Share (%) by Company 2025
List of Tables
- Table 1: North America Performing Art Companies Market Revenue million Forecast, by Type of Performing Arts 2020 & 2033
- Table 2: North America Performing Art Companies Market Revenue million Forecast, by Venue Type 2020 & 2033
- Table 3: North America Performing Art Companies Market Revenue million Forecast, by Ticket Pricing 2020 & 2033
- Table 4: North America Performing Art Companies Market Revenue million Forecast, by Region 2020 & 2033
- Table 5: North America Performing Art Companies Market Revenue million Forecast, by Type of Performing Arts 2020 & 2033
- Table 6: North America Performing Art Companies Market Revenue million Forecast, by Venue Type 2020 & 2033
- Table 7: North America Performing Art Companies Market Revenue million Forecast, by Ticket Pricing 2020 & 2033
- Table 8: North America Performing Art Companies Market Revenue million Forecast, by Country 2020 & 2033
- Table 9: United States North America Performing Art Companies Market Revenue (million) Forecast, by Application 2020 & 2033
- Table 10: Canada North America Performing Art Companies Market Revenue (million) Forecast, by Application 2020 & 2033
- Table 11: Mexico North America Performing Art Companies Market Revenue (million) Forecast, by Application 2020 & 2033
Frequently Asked Questions
1. What is the projected Compound Annual Growth Rate (CAGR) of the North America Performing Art Companies Market?
The projected CAGR is approximately 5.67%.
2. Which companies are prominent players in the North America Performing Art Companies Market?
Key companies in the market include The Walt Disney Company, Live Nation Entertainment, Cirque du Soleil, Paramount Global, Comcast Corporation, The Madison Square Garden Company, Broadway Across America, The Shubert Organization, The Second City, The Metropolitan Opera**List Not Exhaustive.
3. What are the main segments of the North America Performing Art Companies Market?
The market segments include Type of Performing Arts, Venue Type, Ticket Pricing.
4. Can you provide details about the market size?
The market size is estimated to be USD 193.38 million as of 2022.
5. What are some drivers contributing to market growth?
N/A
6. What are the notable trends driving market growth?
Rise in the Use of Online Platforms.
7. Are there any restraints impacting market growth?
N/A
8. Can you provide examples of recent developments in the market?
February 2023: Costa Mesa, CA Segerstrom Center for the Arts presents the North American Premiere of Christopher Wheeldon's latest ballet, Like Water for Chocolate, from American Ballet Theatre for six performances from Wednesday, March 29 through Sunday, April 2. Center audiences will be the first in the country to experience this magical Mexican love story, with the stellar dancers of ABT translating this richly layered story.
9. What pricing options are available for accessing the report?
Pricing options include single-user, multi-user, and enterprise licenses priced at USD 3800, USD 4500, and USD 5800 respectively.
10. Is the market size provided in terms of value or volume?
The market size is provided in terms of value, measured in million.
11. Are there any specific market keywords associated with the report?
Yes, the market keyword associated with the report is "North America Performing Art Companies Market," which aids in identifying and referencing the specific market segment covered.
12. How do I determine which pricing option suits my needs best?
The pricing options vary based on user requirements and access needs. Individual users may opt for single-user licenses, while businesses requiring broader access may choose multi-user or enterprise licenses for cost-effective access to the report.
13. Are there any additional resources or data provided in the North America Performing Art Companies Market report?
While the report offers comprehensive insights, it's advisable to review the specific contents or supplementary materials provided to ascertain if additional resources or data are available.
14. How can I stay updated on further developments or reports in the North America Performing Art Companies Market?
To stay informed about further developments, trends, and reports in the North America Performing Art Companies Market, consider subscribing to industry newsletters, following relevant companies and organizations, or regularly checking reputable industry news sources and publications.
Methodology
Step 1 - Identification of Relevant Samples Size from Population Database


Step 2 - Approaches for Defining Global Market Size (Value, Volume* & Price*)

Note*: In applicable scenarios
Step 3 - Data Sources
Primary Research
- Web Analytics
- Survey Reports
- Research Institute
- Latest Research Reports
- Opinion Leaders
Secondary Research
- Annual Reports
- White Paper
- Latest Press Release
- Industry Association
- Paid Database
- Investor Presentations

Step 4 - Data Triangulation
Involves using different sources of information in order to increase the validity of a study
These sources are likely to be stakeholders in a program - participants, other researchers, program staff, other community members, and so on.
Then we put all data in single framework & apply various statistical tools to find out the dynamic on the market.
During the analysis stage, feedback from the stakeholder groups would be compared to determine areas of agreement as well as areas of divergence