

Key Insights
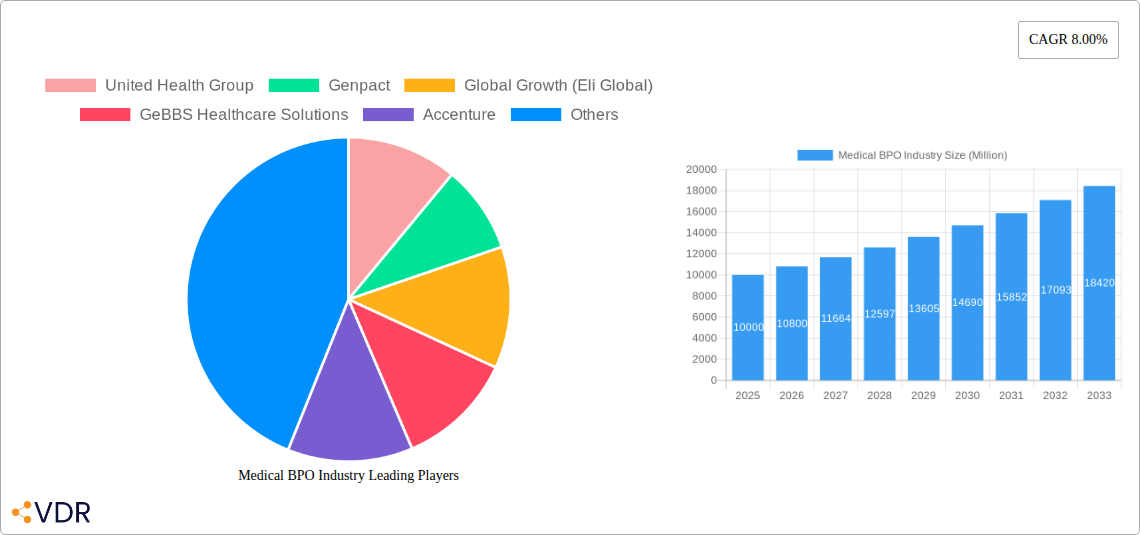
The global Medical Business Process Outsourcing (BPO) market, valued at approximately $XX million in 2025, is projected to experience robust growth, exhibiting a Compound Annual Growth Rate (CAGR) of 8.00% from 2025 to 2033. This expansion is driven by several key factors. The increasing volume and complexity of healthcare data necessitate efficient and cost-effective management solutions, fueling demand for specialized BPO services. Furthermore, the growing adoption of electronic health records (EHRs) and the rising prevalence of chronic diseases are creating opportunities for BPO providers to streamline administrative tasks, improve patient care coordination, and enhance revenue cycle management. Technological advancements, such as artificial intelligence (AI) and machine learning (ML), are also contributing to market growth by enabling automation and improved accuracy in various medical BPO processes. While data privacy regulations and cybersecurity concerns pose potential restraints, the overall market outlook remains positive, driven by a sustained need for improved operational efficiency and cost reduction within the healthcare industry. The market is highly segmented, with significant activity across payer and provider services, including claims management, CRM, revenue cycle management, and pharmaceutical services. Key players like UnitedHealth Group, Genpact, and Accenture are actively shaping the competitive landscape, investing in advanced technologies and expanding their service portfolios to meet evolving market demands. North America currently holds a dominant market share, however, the Asia-Pacific region is projected to experience significant growth due to increasing healthcare expenditure and the adoption of BPO services across developing economies.
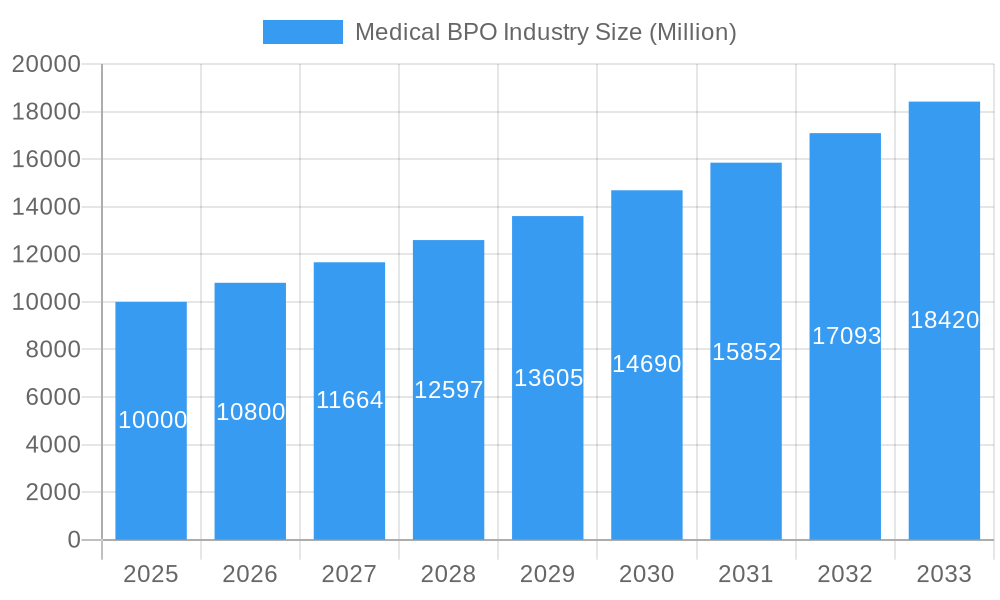
Medical BPO Industry Market Size (In Billion)
The Medical BPO market's segmentation highlights diverse service offerings catering to the healthcare industry's specific needs. Payer services, encompassing areas such as human resource management, claims management, and customer relationship management, represent a significant portion of the market. Provider services, including patient enrollment, patient care, and revenue cycle management, are also key growth areas. Pharmaceutical services, focusing on R&D, manufacturing, and non-clinical support, represent another important segment, driven by the pharmaceutical industry's increasing reliance on outsourcing to optimize operational efficiency. Geographical variations in market penetration reflect factors like healthcare infrastructure, regulatory environments, and technological adoption rates. While North America currently leads in market share, emerging economies in Asia-Pacific and other regions present lucrative growth opportunities for Medical BPO providers. The continued expansion of the market is projected to attract further investment in technological advancements, talent acquisition, and strategic partnerships, further solidifying the importance of Medical BPO in the modern healthcare landscape.
Medical BPO Industry Company Market Share
Medical BPO Industry Market Report: 2019-2033
This comprehensive report provides an in-depth analysis of the Medical Business Process Outsourcing (BPO) industry, encompassing market dynamics, growth trends, regional dominance, product landscape, and key players. The report covers the period 2019-2033, with a focus on the forecast period 2025-2033 and a base year of 2025. The report's detailed insights are invaluable for industry professionals, investors, and strategists seeking to understand and capitalize on opportunities within this rapidly evolving sector. The market is segmented into Payer Services, Provider Services, and Pharmaceutical Services, each with its own distinct sub-segments. This detailed breakdown provides granular insights into market performance across various verticals. The total market size is projected to reach XX Million by 2033.
Medical BPO Industry Market Dynamics & Structure
The Medical BPO market is characterized by moderate concentration, with a few large players holding significant market share, while numerous smaller niche players also compete. Technological innovation, particularly in areas like AI and automation, is a key driver, while regulatory compliance (HIPAA, GDPR) and data security are significant factors shaping market structure. The industry experiences ongoing mergers and acquisitions (M&A) activity, reflecting consolidation and expansion strategies. Substitutes are limited, given the specialized nature of healthcare data management and the stringent regulatory environment. The end-user demographics are broad, encompassing hospitals, clinics, pharmaceutical companies, and insurance providers.
- Market Concentration: The top 5 players hold approximately 40% market share in 2025.
- M&A Activity: An average of 25 deals per year were observed in the historical period (2019-2024).
- Technological Innovation: AI-driven solutions for claims processing and customer service are significant drivers.
- Regulatory Landscape: HIPAA compliance and data security are major cost and complexity factors.
Medical BPO Industry Growth Trends & Insights
The Medical BPO market experienced significant growth during the historical period (2019-2024), driven by increasing healthcare data volumes, rising demand for cost-effective solutions, and technological advancements. The market is projected to maintain a healthy Compound Annual Growth Rate (CAGR) of xx% during the forecast period (2025-2033), reaching an estimated market size of XX Million by 2033. This growth is fueled by increasing adoption of cloud-based solutions, automation in claims processing and patient management, and the expanding use of telehealth services. Consumer behavior shifts towards greater digital engagement further support this growth trajectory. Market penetration remains relatively low in some emerging markets, representing significant potential for future expansion.
Dominant Regions, Countries, or Segments in Medical BPO Industry
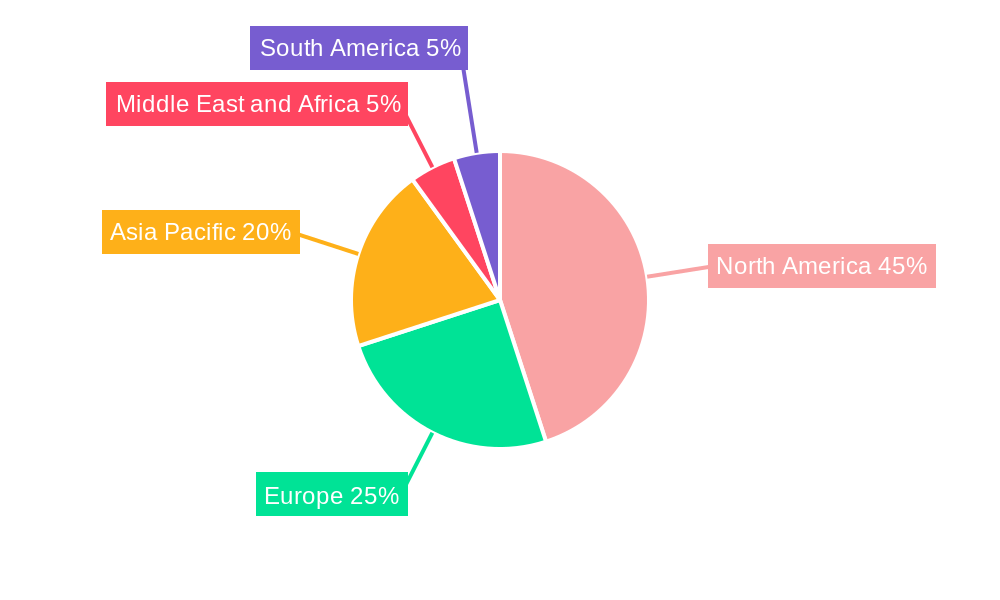
North America currently dominates the Medical BPO market, driven by high healthcare expenditure, robust technological infrastructure, and early adoption of BPO services. Within the segments, Revenue Cycle Management (RCM) in Provider Services shows the highest growth potential due to the increasing complexity of billing and reimbursement processes. Payer services, particularly Claims Management and Customer Relationship Management (CRM), are also significant growth drivers. Europe and Asia-Pacific are experiencing rapid growth, primarily fueled by government initiatives promoting healthcare digitization and increasing investments in healthcare infrastructure.
- Key Drivers for North America: Established healthcare IT infrastructure, high healthcare spending, early adoption of BPO solutions.
- Key Drivers for Europe: Government regulations promoting digital healthcare, increasing healthcare expenditure.
- Key Drivers for Asia-Pacific: Rising healthcare expenditure, growing middle class, government initiatives to improve healthcare infrastructure.
- Dominant Segment: Revenue Cycle Management (RCM) in Provider Services.
Medical BPO Industry Product Landscape
The Medical BPO market offers a diverse range of services, from basic administrative tasks to highly specialized solutions leveraging advanced analytics and AI. Products are differentiated by service offerings, technology platforms, and industry expertise. Unique selling propositions (USPs) include specialized domain expertise, compliance certifications (HIPAA, GDPR), and technological advancements such as robotic process automation (RPA) and AI-powered chatbots for enhanced customer service. Key performance indicators (KPIs) include efficiency gains, cost savings, error reduction, and improved patient satisfaction.
Key Drivers, Barriers & Challenges in Medical BPO Industry
Key Drivers:
- Increasing healthcare data volume and complexity.
- Rising demand for cost-effective healthcare solutions.
- Technological advancements (AI, RPA, cloud computing).
- Government initiatives promoting healthcare digitization.
Key Challenges & Restraints:
- Data security and privacy concerns (e.g., HIPAA compliance).
- Regulatory hurdles and compliance costs.
- Skilled labor shortages and high employee turnover.
- Competition from established players and new entrants.
Emerging Opportunities in Medical BPO Industry
- Expanding into untapped markets (e.g., emerging economies).
- Developing specialized solutions for niche areas (e.g., telehealth, precision medicine).
- Leveraging AI and machine learning for predictive analytics and risk management.
- Focusing on value-added services beyond basic administrative tasks.
Growth Accelerators in the Medical BPO Industry
Technological breakthroughs such as AI and machine learning are driving significant growth. Strategic partnerships between BPO providers and healthcare organizations are creating economies of scale and expanding market reach. Expansion into new geographical markets and the development of innovative service offerings are further accelerating market growth.
Key Players Shaping the Medical BPO Industry Market
- United Health Group
- Genpact
- Global Growth (Eli Global)
- GeBBS Healthcare Solutions
- Accenture
- Infosys Limited
- Wipro
- Tata Consultancy Services Limited
- IQVIA
- Parexel International Corporation
- Sutherland Global Services
- International Business Machines Corporation (IBM)
- Cognizant Technology Solutions
Notable Milestones in Medical BPO Industry Sector
- October 2022: Performant Healthcare Solutions partnered with Priority Health for payment integrity solutions. This signifies increased demand for specialized technology-driven BPO services.
- September 2022: Surgical Solutions secured a group-purchasing agreement with Conductiv, highlighting the growing trend of outsourced surgical services and BPO's role in cost optimization.
In-Depth Medical BPO Industry Market Outlook
The Medical BPO market is poised for continued strong growth, driven by technological advancements, increasing healthcare data volumes, and the ongoing need for cost-effective healthcare solutions. Strategic partnerships, expansion into new markets, and the development of innovative service offerings represent significant opportunities for market players. The focus on data security and regulatory compliance will continue to shape the industry landscape, creating a demand for sophisticated, reliable, and secure solutions.
Medical BPO Industry Segmentation
-
1. Payer Service
- 1.1. Human Resource Management
- 1.2. Claims Management
- 1.3. Customer Relationship Management (CRM)
- 1.4. Operational/Administrative Management
- 1.5. Care Management
- 1.6. Provider Management
- 1.7. Other Payer Services
-
2. Provider Service
- 2.1. Patient Enrollment and Strategic Planning
- 2.2. Patient Care Service
- 2.3. Revenue Cycle Management
-
3. Pharmaceutical Service
- 3.1. Research and Development
- 3.2. Manufacturing
-
3.3. Non-clinical Service
- 3.3.1. Supply Chain Management and Logistics
- 3.3.2. Sales and Marketing Services
- 3.3.3. Other Non-clinical Services
Medical BPO Industry Segmentation By Geography
-
1. North America
- 1.1. United States
- 1.2. Canada
- 1.3. Mexico
-
2. Europe
- 2.1. Germany
- 2.2. United Kingdom
- 2.3. France
- 2.4. Italy
- 2.5. Spain
- 2.6. Rest of Europe
-
3. Asia Pacific
- 3.1. China
- 3.2. Japan
- 3.3. India
- 3.4. Australia
- 3.5. South Korea
- 3.6. Rest of Asia Pacific
-
4. Middle East and Africa
- 4.1. GCC
- 4.2. South Africa
- 4.3. Rest of Middle East and Africa
-
5. South America
- 5.1. Brazil
- 5.2. Argentina
- 5.3. Rest of South America
Medical BPO Industry Regional Market Share
Geographic Coverage of Medical BPO Industry
Medical BPO Industry REPORT HIGHLIGHTS
| Aspects | Details |
|---|---|
| Study Period | 2020-2034 |
| Base Year | 2025 |
| Estimated Year | 2026 |
| Forecast Period | 2026-2034 |
| Historical Period | 2020-2025 |
| Growth Rate | CAGR of 9.8% from 2020-2034 |
| Segmentation |
|
Table of Contents
- 1. Introduction
- 1.1. Research Scope
- 1.2. Market Segmentation
- 1.3. Research Objective
- 1.4. Definitions and Assumptions
- 2. Executive Summary
- 2.1. Market Snapshot
- 3. Market Dynamics
- 3.1. Market Drivers
- 3.2. Market Restrains
- 3.3. Market Trends
- 3.4. Market Opportunities
- 4. Market Factor Analysis
- 4.1. Porters Five Forces
- 4.1.1. Bargaining Power of Suppliers
- 4.1.2. Bargaining Power of Buyers
- 4.1.3. Threat of New Entrants
- 4.1.4. Threat of Substitutes
- 4.1.5. Competitive Rivalry
- 4.2. PESTEL analysis
- 4.3. BCG Analysis
- 4.3.1. Stars (High Growth, High Market Share)
- 4.3.2. Cash Cows (Low Growth, High Market Share)
- 4.3.3. Question Mark (High Growth, Low Market Share)
- 4.3.4. Dogs (Low Growth, Low Market Share)
- 4.4. Ansoff Matrix Analysis
- 4.5. Supply Chain Analysis
- 4.6. Regulatory Landscape
- 4.7. Current Market Potential and Opportunity Assessment (TAM–SAM–SOM Framework)
- 4.8. VDR Analyst Note
- 4.1. Porters Five Forces
- 5. Market Analysis, Insights and Forecast 2021-2033
- 5.1. Market Analysis, Insights and Forecast - by Payer Service
- 5.1.1. Human Resource Management
- 5.1.2. Claims Management
- 5.1.3. Customer Relationship Management (CRM)
- 5.1.4. Operational/Administrative Management
- 5.1.5. Care Management
- 5.1.6. Provider Management
- 5.1.7. Other Payer Services
- 5.2. Market Analysis, Insights and Forecast - by Provider Service
- 5.2.1. Patient Enrollment and Strategic Planning
- 5.2.2. Patient Care Service
- 5.2.3. Revenue Cycle Management
- 5.3. Market Analysis, Insights and Forecast - by Pharmaceutical Service
- 5.3.1. Research and Development
- 5.3.2. Manufacturing
- 5.3.3. Non-clinical Service
- 5.3.3.1. Supply Chain Management and Logistics
- 5.3.3.2. Sales and Marketing Services
- 5.3.3.3. Other Non-clinical Services
- 5.4. Market Analysis, Insights and Forecast - by Region
- 5.4.1. North America
- 5.4.2. Europe
- 5.4.3. Asia Pacific
- 5.4.4. Middle East and Africa
- 5.4.5. South America
- 5.1. Market Analysis, Insights and Forecast - by Payer Service
- 6. Global Medical BPO Industry Analysis, Insights and Forecast, 2021-2033
- 6.1. Market Analysis, Insights and Forecast - by Payer Service
- 6.1.1. Human Resource Management
- 6.1.2. Claims Management
- 6.1.3. Customer Relationship Management (CRM)
- 6.1.4. Operational/Administrative Management
- 6.1.5. Care Management
- 6.1.6. Provider Management
- 6.1.7. Other Payer Services
- 6.2. Market Analysis, Insights and Forecast - by Provider Service
- 6.2.1. Patient Enrollment and Strategic Planning
- 6.2.2. Patient Care Service
- 6.2.3. Revenue Cycle Management
- 6.3. Market Analysis, Insights and Forecast - by Pharmaceutical Service
- 6.3.1. Research and Development
- 6.3.2. Manufacturing
- 6.3.3. Non-clinical Service
- 6.3.3.1. Supply Chain Management and Logistics
- 6.3.3.2. Sales and Marketing Services
- 6.3.3.3. Other Non-clinical Services
- 6.1. Market Analysis, Insights and Forecast - by Payer Service
- 7. North America Medical BPO Industry Analysis, Insights and Forecast, 2021-2033
- 7.1. Market Analysis, Insights and Forecast - by Payer Service
- 7.1.1. Human Resource Management
- 7.1.2. Claims Management
- 7.1.3. Customer Relationship Management (CRM)
- 7.1.4. Operational/Administrative Management
- 7.1.5. Care Management
- 7.1.6. Provider Management
- 7.1.7. Other Payer Services
- 7.2. Market Analysis, Insights and Forecast - by Provider Service
- 7.2.1. Patient Enrollment and Strategic Planning
- 7.2.2. Patient Care Service
- 7.2.3. Revenue Cycle Management
- 7.3. Market Analysis, Insights and Forecast - by Pharmaceutical Service
- 7.3.1. Research and Development
- 7.3.2. Manufacturing
- 7.3.3. Non-clinical Service
- 7.3.3.1. Supply Chain Management and Logistics
- 7.3.3.2. Sales and Marketing Services
- 7.3.3.3. Other Non-clinical Services
- 7.1. Market Analysis, Insights and Forecast - by Payer Service
- 8. Europe Medical BPO Industry Analysis, Insights and Forecast, 2021-2033
- 8.1. Market Analysis, Insights and Forecast - by Payer Service
- 8.1.1. Human Resource Management
- 8.1.2. Claims Management
- 8.1.3. Customer Relationship Management (CRM)
- 8.1.4. Operational/Administrative Management
- 8.1.5. Care Management
- 8.1.6. Provider Management
- 8.1.7. Other Payer Services
- 8.2. Market Analysis, Insights and Forecast - by Provider Service
- 8.2.1. Patient Enrollment and Strategic Planning
- 8.2.2. Patient Care Service
- 8.2.3. Revenue Cycle Management
- 8.3. Market Analysis, Insights and Forecast - by Pharmaceutical Service
- 8.3.1. Research and Development
- 8.3.2. Manufacturing
- 8.3.3. Non-clinical Service
- 8.3.3.1. Supply Chain Management and Logistics
- 8.3.3.2. Sales and Marketing Services
- 8.3.3.3. Other Non-clinical Services
- 8.1. Market Analysis, Insights and Forecast - by Payer Service
- 9. Asia Pacific Medical BPO Industry Analysis, Insights and Forecast, 2021-2033
- 9.1. Market Analysis, Insights and Forecast - by Payer Service
- 9.1.1. Human Resource Management
- 9.1.2. Claims Management
- 9.1.3. Customer Relationship Management (CRM)
- 9.1.4. Operational/Administrative Management
- 9.1.5. Care Management
- 9.1.6. Provider Management
- 9.1.7. Other Payer Services
- 9.2. Market Analysis, Insights and Forecast - by Provider Service
- 9.2.1. Patient Enrollment and Strategic Planning
- 9.2.2. Patient Care Service
- 9.2.3. Revenue Cycle Management
- 9.3. Market Analysis, Insights and Forecast - by Pharmaceutical Service
- 9.3.1. Research and Development
- 9.3.2. Manufacturing
- 9.3.3. Non-clinical Service
- 9.3.3.1. Supply Chain Management and Logistics
- 9.3.3.2. Sales and Marketing Services
- 9.3.3.3. Other Non-clinical Services
- 9.1. Market Analysis, Insights and Forecast - by Payer Service
- 10. Middle East and Africa Medical BPO Industry Analysis, Insights and Forecast, 2021-2033
- 10.1. Market Analysis, Insights and Forecast - by Payer Service
- 10.1.1. Human Resource Management
- 10.1.2. Claims Management
- 10.1.3. Customer Relationship Management (CRM)
- 10.1.4. Operational/Administrative Management
- 10.1.5. Care Management
- 10.1.6. Provider Management
- 10.1.7. Other Payer Services
- 10.2. Market Analysis, Insights and Forecast - by Provider Service
- 10.2.1. Patient Enrollment and Strategic Planning
- 10.2.2. Patient Care Service
- 10.2.3. Revenue Cycle Management
- 10.3. Market Analysis, Insights and Forecast - by Pharmaceutical Service
- 10.3.1. Research and Development
- 10.3.2. Manufacturing
- 10.3.3. Non-clinical Service
- 10.3.3.1. Supply Chain Management and Logistics
- 10.3.3.2. Sales and Marketing Services
- 10.3.3.3. Other Non-clinical Services
- 10.1. Market Analysis, Insights and Forecast - by Payer Service
- 11. South America Medical BPO Industry Analysis, Insights and Forecast, 2021-2033
- 11.1. Market Analysis, Insights and Forecast - by Payer Service
- 11.1.1. Human Resource Management
- 11.1.2. Claims Management
- 11.1.3. Customer Relationship Management (CRM)
- 11.1.4. Operational/Administrative Management
- 11.1.5. Care Management
- 11.1.6. Provider Management
- 11.1.7. Other Payer Services
- 11.2. Market Analysis, Insights and Forecast - by Provider Service
- 11.2.1. Patient Enrollment and Strategic Planning
- 11.2.2. Patient Care Service
- 11.2.3. Revenue Cycle Management
- 11.3. Market Analysis, Insights and Forecast - by Pharmaceutical Service
- 11.3.1. Research and Development
- 11.3.2. Manufacturing
- 11.3.3. Non-clinical Service
- 11.3.3.1. Supply Chain Management and Logistics
- 11.3.3.2. Sales and Marketing Services
- 11.3.3.3. Other Non-clinical Services
- 11.1. Market Analysis, Insights and Forecast - by Payer Service
- 12. Competitive Analysis
- 12.1. Company Profiles
- 12.1.1 United Health Group
- 12.1.1.1. Company Overview
- 12.1.1.2. Products
- 12.1.1.3. Company Financials
- 12.1.1.4. SWOT Analysis
- 12.1.2 Genpact
- 12.1.2.1. Company Overview
- 12.1.2.2. Products
- 12.1.2.3. Company Financials
- 12.1.2.4. SWOT Analysis
- 12.1.3 Global Growth (Eli Global)
- 12.1.3.1. Company Overview
- 12.1.3.2. Products
- 12.1.3.3. Company Financials
- 12.1.3.4. SWOT Analysis
- 12.1.4 GeBBS Healthcare Solutions
- 12.1.4.1. Company Overview
- 12.1.4.2. Products
- 12.1.4.3. Company Financials
- 12.1.4.4. SWOT Analysis
- 12.1.5 Accenture
- 12.1.5.1. Company Overview
- 12.1.5.2. Products
- 12.1.5.3. Company Financials
- 12.1.5.4. SWOT Analysis
- 12.1.6 Infosys Limited*List Not Exhaustive
- 12.1.6.1. Company Overview
- 12.1.6.2. Products
- 12.1.6.3. Company Financials
- 12.1.6.4. SWOT Analysis
- 12.1.7 Wipro
- 12.1.7.1. Company Overview
- 12.1.7.2. Products
- 12.1.7.3. Company Financials
- 12.1.7.4. SWOT Analysis
- 12.1.8 Tata Consultancy Services Limited
- 12.1.8.1. Company Overview
- 12.1.8.2. Products
- 12.1.8.3. Company Financials
- 12.1.8.4. SWOT Analysis
- 12.1.9 IQVIA
- 12.1.9.1. Company Overview
- 12.1.9.2. Products
- 12.1.9.3. Company Financials
- 12.1.9.4. SWOT Analysis
- 12.1.10 Parexel International Corporation
- 12.1.10.1. Company Overview
- 12.1.10.2. Products
- 12.1.10.3. Company Financials
- 12.1.10.4. SWOT Analysis
- 12.1.11 Sutherland Global Services
- 12.1.11.1. Company Overview
- 12.1.11.2. Products
- 12.1.11.3. Company Financials
- 12.1.11.4. SWOT Analysis
- 12.1.12 International Business Machines Corporation (IBM)
- 12.1.12.1. Company Overview
- 12.1.12.2. Products
- 12.1.12.3. Company Financials
- 12.1.12.4. SWOT Analysis
- 12.1.13 Cognizant Technology Solutions
- 12.1.13.1. Company Overview
- 12.1.13.2. Products
- 12.1.13.3. Company Financials
- 12.1.13.4. SWOT Analysis
- 12.1.1 United Health Group
- 12.2. Market Entropy
- 12.2.1 Company's Key Areas Served
- 12.2.2 Recent Developments
- 12.3. Company Market Share Analysis 2025
- 12.3.1 Top 5 Companies Market Share Analysis
- 12.3.2 Top 3 Companies Market Share Analysis
- 12.4. List of Potential Customers
- 13. Research Methodology
List of Figures
- Figure 1: Global Medical BPO Industry Revenue Breakdown (billion, %) by Region 2025 & 2033
- Figure 2: North America Medical BPO Industry Revenue (billion), by Payer Service 2025 & 2033
- Figure 3: North America Medical BPO Industry Revenue Share (%), by Payer Service 2025 & 2033
- Figure 4: North America Medical BPO Industry Revenue (billion), by Provider Service 2025 & 2033
- Figure 5: North America Medical BPO Industry Revenue Share (%), by Provider Service 2025 & 2033
- Figure 6: North America Medical BPO Industry Revenue (billion), by Pharmaceutical Service 2025 & 2033
- Figure 7: North America Medical BPO Industry Revenue Share (%), by Pharmaceutical Service 2025 & 2033
- Figure 8: North America Medical BPO Industry Revenue (billion), by Country 2025 & 2033
- Figure 9: North America Medical BPO Industry Revenue Share (%), by Country 2025 & 2033
- Figure 10: Europe Medical BPO Industry Revenue (billion), by Payer Service 2025 & 2033
- Figure 11: Europe Medical BPO Industry Revenue Share (%), by Payer Service 2025 & 2033
- Figure 12: Europe Medical BPO Industry Revenue (billion), by Provider Service 2025 & 2033
- Figure 13: Europe Medical BPO Industry Revenue Share (%), by Provider Service 2025 & 2033
- Figure 14: Europe Medical BPO Industry Revenue (billion), by Pharmaceutical Service 2025 & 2033
- Figure 15: Europe Medical BPO Industry Revenue Share (%), by Pharmaceutical Service 2025 & 2033
- Figure 16: Europe Medical BPO Industry Revenue (billion), by Country 2025 & 2033
- Figure 17: Europe Medical BPO Industry Revenue Share (%), by Country 2025 & 2033
- Figure 18: Asia Pacific Medical BPO Industry Revenue (billion), by Payer Service 2025 & 2033
- Figure 19: Asia Pacific Medical BPO Industry Revenue Share (%), by Payer Service 2025 & 2033
- Figure 20: Asia Pacific Medical BPO Industry Revenue (billion), by Provider Service 2025 & 2033
- Figure 21: Asia Pacific Medical BPO Industry Revenue Share (%), by Provider Service 2025 & 2033
- Figure 22: Asia Pacific Medical BPO Industry Revenue (billion), by Pharmaceutical Service 2025 & 2033
- Figure 23: Asia Pacific Medical BPO Industry Revenue Share (%), by Pharmaceutical Service 2025 & 2033
- Figure 24: Asia Pacific Medical BPO Industry Revenue (billion), by Country 2025 & 2033
- Figure 25: Asia Pacific Medical BPO Industry Revenue Share (%), by Country 2025 & 2033
- Figure 26: Middle East and Africa Medical BPO Industry Revenue (billion), by Payer Service 2025 & 2033
- Figure 27: Middle East and Africa Medical BPO Industry Revenue Share (%), by Payer Service 2025 & 2033
- Figure 28: Middle East and Africa Medical BPO Industry Revenue (billion), by Provider Service 2025 & 2033
- Figure 29: Middle East and Africa Medical BPO Industry Revenue Share (%), by Provider Service 2025 & 2033
- Figure 30: Middle East and Africa Medical BPO Industry Revenue (billion), by Pharmaceutical Service 2025 & 2033
- Figure 31: Middle East and Africa Medical BPO Industry Revenue Share (%), by Pharmaceutical Service 2025 & 2033
- Figure 32: Middle East and Africa Medical BPO Industry Revenue (billion), by Country 2025 & 2033
- Figure 33: Middle East and Africa Medical BPO Industry Revenue Share (%), by Country 2025 & 2033
- Figure 34: South America Medical BPO Industry Revenue (billion), by Payer Service 2025 & 2033
- Figure 35: South America Medical BPO Industry Revenue Share (%), by Payer Service 2025 & 2033
- Figure 36: South America Medical BPO Industry Revenue (billion), by Provider Service 2025 & 2033
- Figure 37: South America Medical BPO Industry Revenue Share (%), by Provider Service 2025 & 2033
- Figure 38: South America Medical BPO Industry Revenue (billion), by Pharmaceutical Service 2025 & 2033
- Figure 39: South America Medical BPO Industry Revenue Share (%), by Pharmaceutical Service 2025 & 2033
- Figure 40: South America Medical BPO Industry Revenue (billion), by Country 2025 & 2033
- Figure 41: South America Medical BPO Industry Revenue Share (%), by Country 2025 & 2033
List of Tables
- Table 1: Global Medical BPO Industry Revenue billion Forecast, by Payer Service 2020 & 2033
- Table 2: Global Medical BPO Industry Revenue billion Forecast, by Provider Service 2020 & 2033
- Table 3: Global Medical BPO Industry Revenue billion Forecast, by Pharmaceutical Service 2020 & 2033
- Table 4: Global Medical BPO Industry Revenue billion Forecast, by Region 2020 & 2033
- Table 5: Global Medical BPO Industry Revenue billion Forecast, by Payer Service 2020 & 2033
- Table 6: Global Medical BPO Industry Revenue billion Forecast, by Provider Service 2020 & 2033
- Table 7: Global Medical BPO Industry Revenue billion Forecast, by Pharmaceutical Service 2020 & 2033
- Table 8: Global Medical BPO Industry Revenue billion Forecast, by Country 2020 & 2033
- Table 9: United States Medical BPO Industry Revenue (billion) Forecast, by Application 2020 & 2033
- Table 10: Canada Medical BPO Industry Revenue (billion) Forecast, by Application 2020 & 2033
- Table 11: Mexico Medical BPO Industry Revenue (billion) Forecast, by Application 2020 & 2033
- Table 12: Global Medical BPO Industry Revenue billion Forecast, by Payer Service 2020 & 2033
- Table 13: Global Medical BPO Industry Revenue billion Forecast, by Provider Service 2020 & 2033
- Table 14: Global Medical BPO Industry Revenue billion Forecast, by Pharmaceutical Service 2020 & 2033
- Table 15: Global Medical BPO Industry Revenue billion Forecast, by Country 2020 & 2033
- Table 16: Germany Medical BPO Industry Revenue (billion) Forecast, by Application 2020 & 2033
- Table 17: United Kingdom Medical BPO Industry Revenue (billion) Forecast, by Application 2020 & 2033
- Table 18: France Medical BPO Industry Revenue (billion) Forecast, by Application 2020 & 2033
- Table 19: Italy Medical BPO Industry Revenue (billion) Forecast, by Application 2020 & 2033
- Table 20: Spain Medical BPO Industry Revenue (billion) Forecast, by Application 2020 & 2033
- Table 21: Rest of Europe Medical BPO Industry Revenue (billion) Forecast, by Application 2020 & 2033
- Table 22: Global Medical BPO Industry Revenue billion Forecast, by Payer Service 2020 & 2033
- Table 23: Global Medical BPO Industry Revenue billion Forecast, by Provider Service 2020 & 2033
- Table 24: Global Medical BPO Industry Revenue billion Forecast, by Pharmaceutical Service 2020 & 2033
- Table 25: Global Medical BPO Industry Revenue billion Forecast, by Country 2020 & 2033
- Table 26: China Medical BPO Industry Revenue (billion) Forecast, by Application 2020 & 2033
- Table 27: Japan Medical BPO Industry Revenue (billion) Forecast, by Application 2020 & 2033
- Table 28: India Medical BPO Industry Revenue (billion) Forecast, by Application 2020 & 2033
- Table 29: Australia Medical BPO Industry Revenue (billion) Forecast, by Application 2020 & 2033
- Table 30: South Korea Medical BPO Industry Revenue (billion) Forecast, by Application 2020 & 2033
- Table 31: Rest of Asia Pacific Medical BPO Industry Revenue (billion) Forecast, by Application 2020 & 2033
- Table 32: Global Medical BPO Industry Revenue billion Forecast, by Payer Service 2020 & 2033
- Table 33: Global Medical BPO Industry Revenue billion Forecast, by Provider Service 2020 & 2033
- Table 34: Global Medical BPO Industry Revenue billion Forecast, by Pharmaceutical Service 2020 & 2033
- Table 35: Global Medical BPO Industry Revenue billion Forecast, by Country 2020 & 2033
- Table 36: GCC Medical BPO Industry Revenue (billion) Forecast, by Application 2020 & 2033
- Table 37: South Africa Medical BPO Industry Revenue (billion) Forecast, by Application 2020 & 2033
- Table 38: Rest of Middle East and Africa Medical BPO Industry Revenue (billion) Forecast, by Application 2020 & 2033
- Table 39: Global Medical BPO Industry Revenue billion Forecast, by Payer Service 2020 & 2033
- Table 40: Global Medical BPO Industry Revenue billion Forecast, by Provider Service 2020 & 2033
- Table 41: Global Medical BPO Industry Revenue billion Forecast, by Pharmaceutical Service 2020 & 2033
- Table 42: Global Medical BPO Industry Revenue billion Forecast, by Country 2020 & 2033
- Table 43: Brazil Medical BPO Industry Revenue (billion) Forecast, by Application 2020 & 2033
- Table 44: Argentina Medical BPO Industry Revenue (billion) Forecast, by Application 2020 & 2033
- Table 45: Rest of South America Medical BPO Industry Revenue (billion) Forecast, by Application 2020 & 2033
Frequently Asked Questions
1. What is the projected Compound Annual Growth Rate (CAGR) of the Medical BPO Industry?
The projected CAGR is approximately 9.8%.
2. Which companies are prominent players in the Medical BPO Industry?
Key companies in the market include United Health Group, Genpact, Global Growth (Eli Global), GeBBS Healthcare Solutions, Accenture, Infosys Limited*List Not Exhaustive, Wipro, Tata Consultancy Services Limited, IQVIA, Parexel International Corporation, Sutherland Global Services, International Business Machines Corporation (IBM), Cognizant Technology Solutions.
3. What are the main segments of the Medical BPO Industry?
The market segments include Payer Service, Provider Service, Pharmaceutical Service.
4. Can you provide details about the market size?
The market size is estimated to be USD 327.86 billion as of 2022.
5. What are some drivers contributing to market growth?
Rise of Nearshore Outsourcing Destinations and Access to Technology; Rapid Increase in Clinical Process Outsourcing (CPO); Implementation of PPACA Compelled Healthcare Player to Move toward Outsourcing; Fewer Errors in Several Non-critical Functions. like Finance and Accounting. Customer Care Services. etc..
6. What are the notable trends driving market growth?
Revenue Cycle Management Segment is Anticipated to Witness Growth Over the Forecast Period.
7. Are there any restraints impacting market growth?
Complex Regulations; Hidden Costs of Outsourcing.
8. Can you provide examples of recent developments in the market?
October 2022 : Performant Healthcare Solutions a leading provider of technology-enabled payment integrity, eligibility, and related analytics services, entered a new strategic engagement with Priority Health to provide a customized, end-to-end solution focused on all aspects of payment integrity.
9. What pricing options are available for accessing the report?
Pricing options include single-user, multi-user, and enterprise licenses priced at USD 4750, USD 5250, and USD 8750 respectively.
10. Is the market size provided in terms of value or volume?
The market size is provided in terms of value, measured in billion.
11. Are there any specific market keywords associated with the report?
Yes, the market keyword associated with the report is "Medical BPO Industry," which aids in identifying and referencing the specific market segment covered.
12. How do I determine which pricing option suits my needs best?
The pricing options vary based on user requirements and access needs. Individual users may opt for single-user licenses, while businesses requiring broader access may choose multi-user or enterprise licenses for cost-effective access to the report.
13. Are there any additional resources or data provided in the Medical BPO Industry report?
While the report offers comprehensive insights, it's advisable to review the specific contents or supplementary materials provided to ascertain if additional resources or data are available.
14. How can I stay updated on further developments or reports in the Medical BPO Industry?
To stay informed about further developments, trends, and reports in the Medical BPO Industry, consider subscribing to industry newsletters, following relevant companies and organizations, or regularly checking reputable industry news sources and publications.
Methodology
Step 1 - Identification of Relevant Samples Size from Population Database


Step 2 - Approaches for Defining Global Market Size (Value, Volume* & Price*)

Note*: In applicable scenarios
Step 3 - Data Sources
Primary Research
- Web Analytics
- Survey Reports
- Research Institute
- Latest Research Reports
- Opinion Leaders
Secondary Research
- Annual Reports
- White Paper
- Latest Press Release
- Industry Association
- Paid Database
- Investor Presentations

Step 4 - Data Triangulation
Involves using different sources of information in order to increase the validity of a study
These sources are likely to be stakeholders in a program - participants, other researchers, program staff, other community members, and so on.
Then we put all data in single framework & apply various statistical tools to find out the dynamic on the market.
During the analysis stage, feedback from the stakeholder groups would be compared to determine areas of agreement as well as areas of divergence