

Key Insights
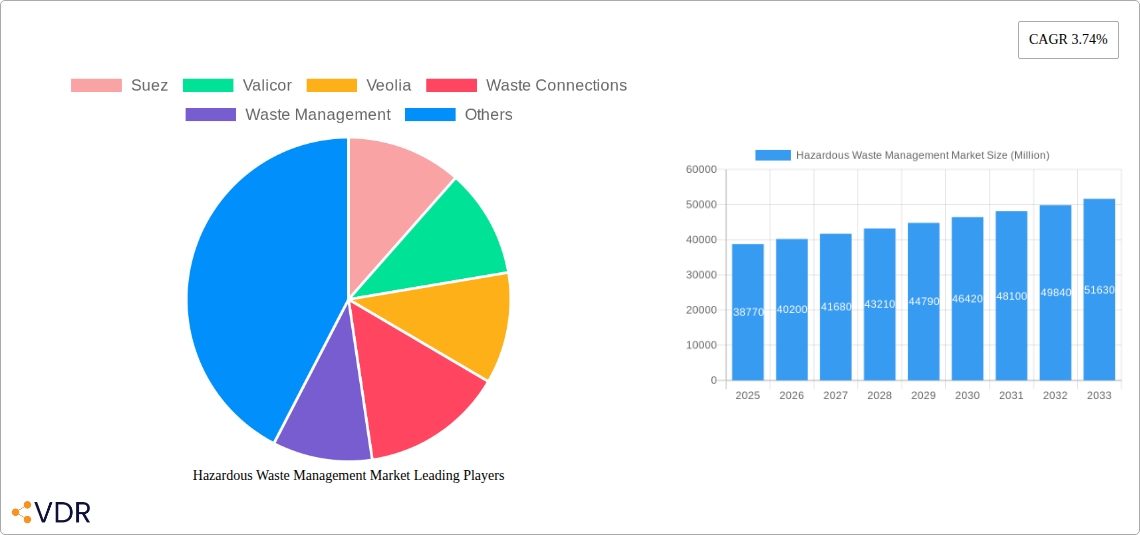
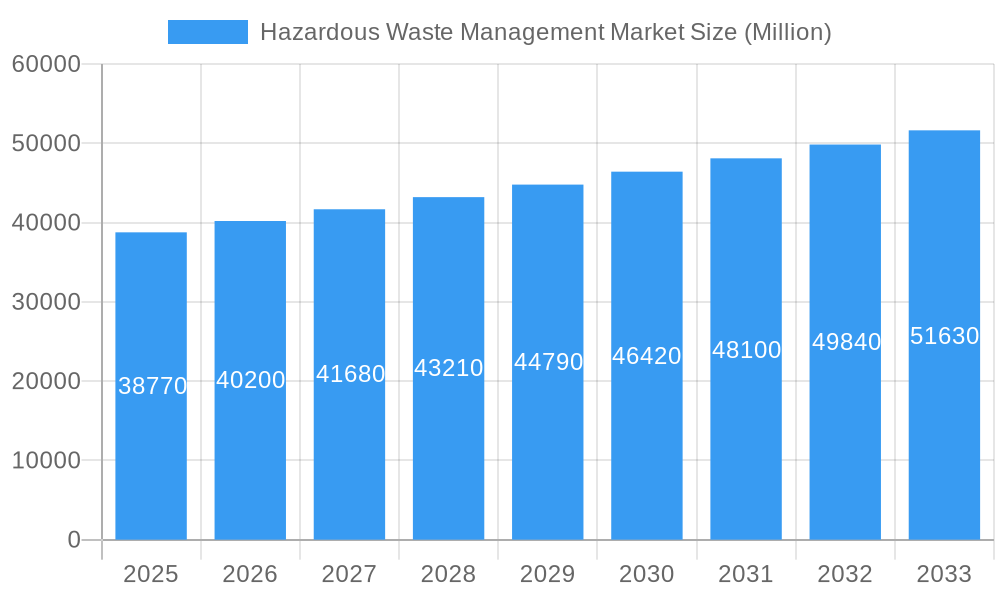
The hazardous waste management market, valued at $38.77 billion in 2025, is projected to experience steady growth, driven by increasing industrialization, stringent environmental regulations, and growing awareness of the risks associated with improper waste disposal. The compound annual growth rate (CAGR) of 3.74% from 2025 to 2033 indicates a consistent market expansion, although this rate may fluctuate slightly year to year depending on economic conditions and policy changes. Key drivers include the rising volume of hazardous waste generated from diverse sectors such as healthcare, manufacturing, and energy, alongside increasing government mandates for responsible waste management practices. This necessitates investment in advanced waste treatment technologies and sophisticated disposal methods, creating lucrative opportunities for market players. Emerging trends like the circular economy and the push for sustainable waste management solutions are further shaping the market landscape, encouraging innovation in waste-to-energy conversion and recycling processes. While challenges remain, such as high operational costs and the complexities of managing diverse waste streams, the overall market outlook remains positive, fueled by the long-term need for environmentally responsible and efficient hazardous waste solutions.
Hazardous Waste Management Market Market Size (In Billion)
The market is highly competitive, with prominent players including Suez, Veolia, Waste Management, and Republic Services actively engaged in mergers, acquisitions, and technological advancements to gain a competitive edge. Regional variations exist, with developed economies exhibiting higher market penetration due to stricter regulations and higher awareness. However, emerging economies are experiencing rapid growth as industrialization progresses and environmental concerns escalate. The continued focus on improving waste management infrastructure, particularly in developing nations, presents significant opportunities for expansion. The market's segmentation is likely diversified, encompassing various waste types (e.g., chemical, biological, radioactive) and services (e.g., collection, treatment, disposal). Companies are increasingly adopting sustainable practices and investing in research and development to offer eco-friendly and cost-effective solutions, further driving market growth in the long term.
Hazardous Waste Management Market Company Market Share
Hazardous Waste Management Market: A Comprehensive Report (2019-2033)
This in-depth report provides a comprehensive analysis of the Hazardous Waste Management Market, encompassing market dynamics, growth trends, regional insights, and key players. The study period covers 2019-2033, with 2025 as the base year and a forecast period of 2025-2033. The report analyzes both the parent market (Waste Management) and the child market (Hazardous Waste Management), offering granular insights into this critical industry sector. The market size is projected to reach xx Million by 2033.
Hazardous Waste Management Market Dynamics & Structure
This section analyzes the competitive landscape, technological advancements, regulatory influences, and market trends within the hazardous waste management sector. The market is characterized by a moderate level of concentration, with several large multinational corporations holding significant market share. However, smaller, specialized firms also play a crucial role, particularly in niche segments.
- Market Concentration: The top 10 players account for approximately xx% of the global market share in 2025, indicating a moderately consolidated market.
- Technological Innovation: Advancements in waste-to-energy technologies, improved hazardous waste treatment methods, and digitalization of waste management processes are key drivers of innovation. However, high initial investment costs and regulatory complexities can hinder wider adoption.
- Regulatory Framework: Stringent environmental regulations across various geographies are significantly shaping market growth. Compliance costs and evolving standards present both opportunities and challenges for market participants.
- Competitive Substitutes: While limited direct substitutes exist, the market faces indirect competition from alternative waste disposal methods, such as landfilling (though increasingly restricted), and emerging technologies.
- End-User Demographics: The primary end-users span diverse industries including manufacturing, healthcare, and construction, with varying needs and waste generation profiles.
- M&A Trends: The sector has witnessed a considerable number of mergers and acquisitions (M&A) in recent years, totaling approximately xx deals between 2019 and 2024, driven by consolidation efforts and expansion strategies. This trend is expected to continue, particularly among medium-sized companies aiming for greater market presence.
Hazardous Waste Management Market Growth Trends & Insights
The global Hazardous Waste Management market has experienced significant and sustained growth over the historical period (2019-2024). This upward trajectory is primarily attributed to the escalating pace of industrial activities worldwide, the implementation of increasingly stringent environmental regulations by governments, and a growing societal consciousness towards environmental sustainability and corporate responsibility. Projections indicate that the market will continue its robust expansion, maintaining a healthy Compound Annual Growth Rate (CAGR) of approximately XX% throughout the forecast period (2025-2033). By 2033, the market is anticipated to reach an estimated value of XX Million.
Several pivotal factors are underpinning this sustained growth:
- Industrialization & Urbanization: Accelerated industrial development and rapid urbanization globally are directly contributing to higher volumes of hazardous waste generation across various sectors, including manufacturing, healthcare, and agriculture.
- Regulatory Frameworks: The imposition of more rigorous environmental protection laws and compliance mandates by national and international bodies is compelling industries to adopt compliant and advanced hazardous waste management practices.
- Sustainability Initiatives: A widespread shift towards sustainable business models and the adoption of circular economy principles are driving demand for specialized waste management services that minimize environmental impact and maximize resource recovery.
- Technological Advancements: Ongoing innovations, particularly in waste-to-energy conversion, advanced recycling techniques, and secure containment technologies, are making hazardous waste management more efficient, cost-effective, and environmentally sound.
- Public Awareness & Demand: Heightened public awareness regarding the detrimental effects of improper waste disposal on ecosystems and human health is fueling consumer demand for transparent and environmentally responsible waste management solutions.
The market is further being revolutionized by technological disruptions. The integration of automation, AI-powered systems for precise waste identification and sorting, and sophisticated data analytics for optimizing logistics and treatment processes are expected to significantly accelerate market growth and enhance operational efficiencies. Simultaneously, evolving consumer behaviors, emphasizing eco-friendly choices and demanding accountability from businesses, are providing a powerful impetus for the expansion of sophisticated and ethical hazardous waste management services.
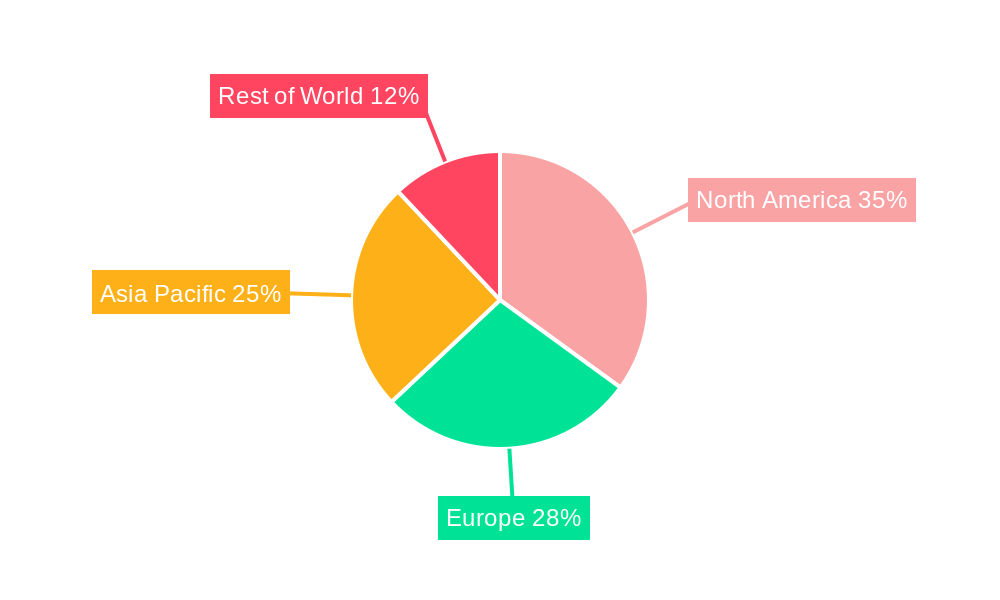
Dominant Regions, Countries, or Segments in Hazardous Waste Management Market
Currently, North America and Europe stand as the leading regions in the Hazardous Waste Management market. This dominance is a consequence of their well-established industrial infrastructures, robust regulatory environments characterized by stringent environmental protection standards, and a higher propensity for adopting advanced waste management technologies driven by significant per capita income. However, the Asia-Pacific region is poised for remarkable growth in the upcoming years. This surge is fueled by its rapid industrialization, burgeoning urban populations, and substantial government investments aimed at developing and upgrading waste management infrastructure to meet growing demands.
Key regional dynamics include:
- North America: Characterized by a highly developed industrial sector, a proactive regulatory framework, and a deeply ingrained culture of environmental awareness, this region leads in sophisticated hazardous waste management solutions and services.
- Europe: Similar to North America, Europe's market leadership is propelled by its stringent environmental legislation, a strong commitment to sustainability, and a consistent drive for innovation in waste treatment and resource recovery.
- Asia-Pacific: This region presents a compelling growth narrative driven by rapid economic expansion, escalating urbanization, and proactive government initiatives focused on enhancing waste management capabilities and infrastructure. China and India are particularly influential in driving this regional expansion due to their massive industrial outputs and growing populations.
A granular, country-level analysis reveals leading markets based on a confluence of critical factors:
- Economic development and the intensity of industrial activity.
- The stringency and enforcement effectiveness of environmental regulations.
- The level of investment in state-of-the-art waste management infrastructure.
- The extent of public awareness and acceptance of sustainable waste management practices.
Hazardous Waste Management Market Product Landscape
The Hazardous Waste Management market encompasses a comprehensive array of products and services designed to manage hazardous materials safely and effectively. This includes specialized collection and transportation logistics, advanced treatment methodologies, secure disposal solutions, and innovative recycling processes. Product development is intensely focused on enhancing operational efficiency, minimizing environmental footprints, and ensuring the highest safety standards. Recent breakthroughs include the deployment of next-generation incineration technologies capable of maximizing energy recovery, sophisticated biological treatment methods tailored for specific hazardous waste streams, and novel recycling techniques that enable the recovery of valuable resources from materials previously considered unrecyclable. These innovations offer significant competitive advantages, such as substantial reductions in greenhouse gas emissions, lower overall disposal costs for industries, and the successful reclamation of valuable commodities from waste streams, thereby supporting a more circular economy.
Key Drivers, Barriers & Challenges in Hazardous Waste Management Market
Key Drivers:
- Stringent environmental regulations globally are pushing for improved waste management practices.
- Increasing industrial activity and urbanization are leading to higher waste generation.
- Growing awareness of environmental sustainability and its impact on public health.
- Technological advancements are improving efficiency and reducing environmental impact.
Key Challenges & Restraints:
- High capital investment costs for advanced technologies can hinder adoption, especially in developing economies. The initial investment for a new waste-to-energy plant can be in excess of xx Million.
- Regulatory complexities and varying standards across different jurisdictions create operational hurdles.
- Supply chain disruptions, particularly in the transportation and logistics of hazardous waste, can impact operations and cost efficiency.
- Competition from existing and emerging waste management technologies, particularly in specific treatment processes, can impact market share.
Emerging Opportunities in Hazardous Waste Management Market
- Untapped markets in developing economies offer substantial growth potential.
- Innovations in waste-to-energy and resource recovery technologies present new opportunities.
- Growing demand for sustainable and eco-friendly waste management solutions.
- Increased focus on circular economy principles promotes the development of innovative recycling and resource recovery technologies.
Growth Accelerators in the Hazardous Waste Management Market Industry
Technological breakthroughs in waste treatment, particularly in the development of cleaner and more efficient technologies, are driving long-term growth. Strategic partnerships between waste management companies and technology providers are accelerating innovation and market adoption. Expansion into new geographical markets, especially in developing economies with growing industrial sectors, is another key growth driver. Furthermore, the increasing focus on circular economy principles and resource recovery is creating new market opportunities and boosting industry growth.
Key Players Shaping the Hazardous Waste Management Market Market
- Suez
- Valicor
- Veolia
- Waste Connections
- Waste Management
- Republic Services
- Biffa
- Clean Harbors
- Covanta Holding
- Daiseki
- Hitachi Zosen
- Remondis SE & Co Kg
- Urbaser
- Biomedical Solutions
- 63 Other Companies
Notable Milestones in Hazardous Waste Management Market Sector
- February 2024: WM announced plans to expand its footprint by establishing three new recycling facilities across North America and enhance automation at 10 existing sites, boosting recycling capacity by 1 million metric tons annually by 2026.
- April 2024: China Everbright Environment Group Limited (Everbright Environment) completed its Hue Waste-to-Energy Project in Vietnam, attended by the Vietnamese Prime Minister.
In-Depth Hazardous Waste Management Market Market Outlook
The Hazardous Waste Management market is poised for continued growth, driven by technological advancements, stricter regulations, and increasing environmental awareness. Strategic investments in innovative technologies, expansion into emerging markets, and strategic partnerships will be crucial for companies to capitalize on future market opportunities. The focus on sustainable waste management practices and circular economy principles will further shape industry dynamics and present new avenues for growth and innovation in the coming years.
Hazardous Waste Management Market Segmentation
-
1. Type
- 1.1. Solid
- 1.2. Liquid
- 1.3. Sludge
-
2. Waste
- 2.1. Chemicals
- 2.2. Biomedical
- 2.3. Radioactive
- 2.4. Other Waste (Corrosive, Flammable, etc.)
Hazardous Waste Management Market Segmentation By Geography
-
1. North America
- 1.1. United States
- 1.2. Canada
-
2. Europe
- 2.1. Germany
- 2.2. United Kingdom
- 2.3. France
- 2.4. Russia
- 2.5. Spain
- 2.6. Rest of Europe
-
3. Asia Pacific
- 3.1. India
- 3.2. China
- 3.3. Japan
- 3.4. Rest of Asia Pacific
-
4. Middle East and Africa
- 4.1. United Arab Emirates
- 4.2. Saudi Arabia
- 4.3. Rest of Middle East
-
5. South America
- 5.1. Brazil
- 5.2. Argentina
- 5.3. Rest of South America
Hazardous Waste Management Market Regional Market Share
Geographic Coverage of Hazardous Waste Management Market
Hazardous Waste Management Market REPORT HIGHLIGHTS
| Aspects | Details |
|---|---|
| Study Period | 2020-2034 |
| Base Year | 2025 |
| Estimated Year | 2026 |
| Forecast Period | 2026-2034 |
| Historical Period | 2020-2025 |
| Growth Rate | CAGR of 3.74% from 2020-2034 |
| Segmentation |
|
Table of Contents
- 1. Introduction
- 1.1. Research Scope
- 1.2. Market Segmentation
- 1.3. Research Objective
- 1.4. Definitions and Assumptions
- 2. Executive Summary
- 2.1. Market Snapshot
- 3. Market Dynamics
- 3.1. Market Drivers
- 3.2. Market Restrains
- 3.3. Market Trends
- 3.4. Market Opportunities
- 4. Market Factor Analysis
- 4.1. Porters Five Forces
- 4.1.1. Bargaining Power of Suppliers
- 4.1.2. Bargaining Power of Buyers
- 4.1.3. Threat of New Entrants
- 4.1.4. Threat of Substitutes
- 4.1.5. Competitive Rivalry
- 4.2. PESTEL analysis
- 4.3. BCG Analysis
- 4.3.1. Stars (High Growth, High Market Share)
- 4.3.2. Cash Cows (Low Growth, High Market Share)
- 4.3.3. Question Mark (High Growth, Low Market Share)
- 4.3.4. Dogs (Low Growth, Low Market Share)
- 4.4. Ansoff Matrix Analysis
- 4.5. Supply Chain Analysis
- 4.6. Regulatory Landscape
- 4.7. Current Market Potential and Opportunity Assessment (TAM–SAM–SOM Framework)
- 4.8. VDR Analyst Note
- 4.1. Porters Five Forces
- 5. Market Analysis, Insights and Forecast 2021-2033
- 5.1. Market Analysis, Insights and Forecast - by Type
- 5.1.1. Solid
- 5.1.2. Liquid
- 5.1.3. Sludge
- 5.2. Market Analysis, Insights and Forecast - by Waste
- 5.2.1. Chemicals
- 5.2.2. Biomedical
- 5.2.3. Radioactive
- 5.2.4. Other Waste (Corrosive, Flammable, etc.)
- 5.3. Market Analysis, Insights and Forecast - by Region
- 5.3.1. North America
- 5.3.2. Europe
- 5.3.3. Asia Pacific
- 5.3.4. Middle East and Africa
- 5.3.5. South America
- 5.1. Market Analysis, Insights and Forecast - by Type
- 6. Global Hazardous Waste Management Market Analysis, Insights and Forecast, 2021-2033
- 6.1. Market Analysis, Insights and Forecast - by Type
- 6.1.1. Solid
- 6.1.2. Liquid
- 6.1.3. Sludge
- 6.2. Market Analysis, Insights and Forecast - by Waste
- 6.2.1. Chemicals
- 6.2.2. Biomedical
- 6.2.3. Radioactive
- 6.2.4. Other Waste (Corrosive, Flammable, etc.)
- 6.1. Market Analysis, Insights and Forecast - by Type
- 7. North America Hazardous Waste Management Market Analysis, Insights and Forecast, 2021-2033
- 7.1. Market Analysis, Insights and Forecast - by Type
- 7.1.1. Solid
- 7.1.2. Liquid
- 7.1.3. Sludge
- 7.2. Market Analysis, Insights and Forecast - by Waste
- 7.2.1. Chemicals
- 7.2.2. Biomedical
- 7.2.3. Radioactive
- 7.2.4. Other Waste (Corrosive, Flammable, etc.)
- 7.1. Market Analysis, Insights and Forecast - by Type
- 8. Europe Hazardous Waste Management Market Analysis, Insights and Forecast, 2021-2033
- 8.1. Market Analysis, Insights and Forecast - by Type
- 8.1.1. Solid
- 8.1.2. Liquid
- 8.1.3. Sludge
- 8.2. Market Analysis, Insights and Forecast - by Waste
- 8.2.1. Chemicals
- 8.2.2. Biomedical
- 8.2.3. Radioactive
- 8.2.4. Other Waste (Corrosive, Flammable, etc.)
- 8.1. Market Analysis, Insights and Forecast - by Type
- 9. Asia Pacific Hazardous Waste Management Market Analysis, Insights and Forecast, 2021-2033
- 9.1. Market Analysis, Insights and Forecast - by Type
- 9.1.1. Solid
- 9.1.2. Liquid
- 9.1.3. Sludge
- 9.2. Market Analysis, Insights and Forecast - by Waste
- 9.2.1. Chemicals
- 9.2.2. Biomedical
- 9.2.3. Radioactive
- 9.2.4. Other Waste (Corrosive, Flammable, etc.)
- 9.1. Market Analysis, Insights and Forecast - by Type
- 10. Middle East and Africa Hazardous Waste Management Market Analysis, Insights and Forecast, 2021-2033
- 10.1. Market Analysis, Insights and Forecast - by Type
- 10.1.1. Solid
- 10.1.2. Liquid
- 10.1.3. Sludge
- 10.2. Market Analysis, Insights and Forecast - by Waste
- 10.2.1. Chemicals
- 10.2.2. Biomedical
- 10.2.3. Radioactive
- 10.2.4. Other Waste (Corrosive, Flammable, etc.)
- 10.1. Market Analysis, Insights and Forecast - by Type
- 11. South America Hazardous Waste Management Market Analysis, Insights and Forecast, 2021-2033
- 11.1. Market Analysis, Insights and Forecast - by Type
- 11.1.1. Solid
- 11.1.2. Liquid
- 11.1.3. Sludge
- 11.2. Market Analysis, Insights and Forecast - by Waste
- 11.2.1. Chemicals
- 11.2.2. Biomedical
- 11.2.3. Radioactive
- 11.2.4. Other Waste (Corrosive, Flammable, etc.)
- 11.1. Market Analysis, Insights and Forecast - by Type
- 12. Competitive Analysis
- 12.1. Company Profiles
- 12.1.1 Suez
- 12.1.1.1. Company Overview
- 12.1.1.2. Products
- 12.1.1.3. Company Financials
- 12.1.1.4. SWOT Analysis
- 12.1.2 Valicor
- 12.1.2.1. Company Overview
- 12.1.2.2. Products
- 12.1.2.3. Company Financials
- 12.1.2.4. SWOT Analysis
- 12.1.3 Veolia
- 12.1.3.1. Company Overview
- 12.1.3.2. Products
- 12.1.3.3. Company Financials
- 12.1.3.4. SWOT Analysis
- 12.1.4 Waste Connections
- 12.1.4.1. Company Overview
- 12.1.4.2. Products
- 12.1.4.3. Company Financials
- 12.1.4.4. SWOT Analysis
- 12.1.5 Waste Management
- 12.1.5.1. Company Overview
- 12.1.5.2. Products
- 12.1.5.3. Company Financials
- 12.1.5.4. SWOT Analysis
- 12.1.6 Republic Services
- 12.1.6.1. Company Overview
- 12.1.6.2. Products
- 12.1.6.3. Company Financials
- 12.1.6.4. SWOT Analysis
- 12.1.7 Biffa
- 12.1.7.1. Company Overview
- 12.1.7.2. Products
- 12.1.7.3. Company Financials
- 12.1.7.4. SWOT Analysis
- 12.1.8 Clean Harbors
- 12.1.8.1. Company Overview
- 12.1.8.2. Products
- 12.1.8.3. Company Financials
- 12.1.8.4. SWOT Analysis
- 12.1.9 Covanta Holding
- 12.1.9.1. Company Overview
- 12.1.9.2. Products
- 12.1.9.3. Company Financials
- 12.1.9.4. SWOT Analysis
- 12.1.10 Daiseki
- 12.1.10.1. Company Overview
- 12.1.10.2. Products
- 12.1.10.3. Company Financials
- 12.1.10.4. SWOT Analysis
- 12.1.11 Hitachi Zosen
- 12.1.11.1. Company Overview
- 12.1.11.2. Products
- 12.1.11.3. Company Financials
- 12.1.11.4. SWOT Analysis
- 12.1.12 Remondis SE & Co Kg
- 12.1.12.1. Company Overview
- 12.1.12.2. Products
- 12.1.12.3. Company Financials
- 12.1.12.4. SWOT Analysis
- 12.1.13 Urbaser
- 12.1.13.1. Company Overview
- 12.1.13.2. Products
- 12.1.13.3. Company Financials
- 12.1.13.4. SWOT Analysis
- 12.1.14 Biomedical Solutions*List Not Exhaustive 6 3 Other Companie
- 12.1.14.1. Company Overview
- 12.1.14.2. Products
- 12.1.14.3. Company Financials
- 12.1.14.4. SWOT Analysis
- 12.1.1 Suez
- 12.2. Market Entropy
- 12.2.1 Company's Key Areas Served
- 12.2.2 Recent Developments
- 12.3. Company Market Share Analysis 2025
- 12.3.1 Top 5 Companies Market Share Analysis
- 12.3.2 Top 3 Companies Market Share Analysis
- 12.4. List of Potential Customers
- 13. Research Methodology
List of Figures
- Figure 1: Global Hazardous Waste Management Market Revenue Breakdown (Million, %) by Region 2025 & 2033
- Figure 2: Global Hazardous Waste Management Market Volume Breakdown (Billion, %) by Region 2025 & 2033
- Figure 3: North America Hazardous Waste Management Market Revenue (Million), by Type 2025 & 2033
- Figure 4: North America Hazardous Waste Management Market Volume (Billion), by Type 2025 & 2033
- Figure 5: North America Hazardous Waste Management Market Revenue Share (%), by Type 2025 & 2033
- Figure 6: North America Hazardous Waste Management Market Volume Share (%), by Type 2025 & 2033
- Figure 7: North America Hazardous Waste Management Market Revenue (Million), by Waste 2025 & 2033
- Figure 8: North America Hazardous Waste Management Market Volume (Billion), by Waste 2025 & 2033
- Figure 9: North America Hazardous Waste Management Market Revenue Share (%), by Waste 2025 & 2033
- Figure 10: North America Hazardous Waste Management Market Volume Share (%), by Waste 2025 & 2033
- Figure 11: North America Hazardous Waste Management Market Revenue (Million), by Country 2025 & 2033
- Figure 12: North America Hazardous Waste Management Market Volume (Billion), by Country 2025 & 2033
- Figure 13: North America Hazardous Waste Management Market Revenue Share (%), by Country 2025 & 2033
- Figure 14: North America Hazardous Waste Management Market Volume Share (%), by Country 2025 & 2033
- Figure 15: Europe Hazardous Waste Management Market Revenue (Million), by Type 2025 & 2033
- Figure 16: Europe Hazardous Waste Management Market Volume (Billion), by Type 2025 & 2033
- Figure 17: Europe Hazardous Waste Management Market Revenue Share (%), by Type 2025 & 2033
- Figure 18: Europe Hazardous Waste Management Market Volume Share (%), by Type 2025 & 2033
- Figure 19: Europe Hazardous Waste Management Market Revenue (Million), by Waste 2025 & 2033
- Figure 20: Europe Hazardous Waste Management Market Volume (Billion), by Waste 2025 & 2033
- Figure 21: Europe Hazardous Waste Management Market Revenue Share (%), by Waste 2025 & 2033
- Figure 22: Europe Hazardous Waste Management Market Volume Share (%), by Waste 2025 & 2033
- Figure 23: Europe Hazardous Waste Management Market Revenue (Million), by Country 2025 & 2033
- Figure 24: Europe Hazardous Waste Management Market Volume (Billion), by Country 2025 & 2033
- Figure 25: Europe Hazardous Waste Management Market Revenue Share (%), by Country 2025 & 2033
- Figure 26: Europe Hazardous Waste Management Market Volume Share (%), by Country 2025 & 2033
- Figure 27: Asia Pacific Hazardous Waste Management Market Revenue (Million), by Type 2025 & 2033
- Figure 28: Asia Pacific Hazardous Waste Management Market Volume (Billion), by Type 2025 & 2033
- Figure 29: Asia Pacific Hazardous Waste Management Market Revenue Share (%), by Type 2025 & 2033
- Figure 30: Asia Pacific Hazardous Waste Management Market Volume Share (%), by Type 2025 & 2033
- Figure 31: Asia Pacific Hazardous Waste Management Market Revenue (Million), by Waste 2025 & 2033
- Figure 32: Asia Pacific Hazardous Waste Management Market Volume (Billion), by Waste 2025 & 2033
- Figure 33: Asia Pacific Hazardous Waste Management Market Revenue Share (%), by Waste 2025 & 2033
- Figure 34: Asia Pacific Hazardous Waste Management Market Volume Share (%), by Waste 2025 & 2033
- Figure 35: Asia Pacific Hazardous Waste Management Market Revenue (Million), by Country 2025 & 2033
- Figure 36: Asia Pacific Hazardous Waste Management Market Volume (Billion), by Country 2025 & 2033
- Figure 37: Asia Pacific Hazardous Waste Management Market Revenue Share (%), by Country 2025 & 2033
- Figure 38: Asia Pacific Hazardous Waste Management Market Volume Share (%), by Country 2025 & 2033
- Figure 39: Middle East and Africa Hazardous Waste Management Market Revenue (Million), by Type 2025 & 2033
- Figure 40: Middle East and Africa Hazardous Waste Management Market Volume (Billion), by Type 2025 & 2033
- Figure 41: Middle East and Africa Hazardous Waste Management Market Revenue Share (%), by Type 2025 & 2033
- Figure 42: Middle East and Africa Hazardous Waste Management Market Volume Share (%), by Type 2025 & 2033
- Figure 43: Middle East and Africa Hazardous Waste Management Market Revenue (Million), by Waste 2025 & 2033
- Figure 44: Middle East and Africa Hazardous Waste Management Market Volume (Billion), by Waste 2025 & 2033
- Figure 45: Middle East and Africa Hazardous Waste Management Market Revenue Share (%), by Waste 2025 & 2033
- Figure 46: Middle East and Africa Hazardous Waste Management Market Volume Share (%), by Waste 2025 & 2033
- Figure 47: Middle East and Africa Hazardous Waste Management Market Revenue (Million), by Country 2025 & 2033
- Figure 48: Middle East and Africa Hazardous Waste Management Market Volume (Billion), by Country 2025 & 2033
- Figure 49: Middle East and Africa Hazardous Waste Management Market Revenue Share (%), by Country 2025 & 2033
- Figure 50: Middle East and Africa Hazardous Waste Management Market Volume Share (%), by Country 2025 & 2033
- Figure 51: South America Hazardous Waste Management Market Revenue (Million), by Type 2025 & 2033
- Figure 52: South America Hazardous Waste Management Market Volume (Billion), by Type 2025 & 2033
- Figure 53: South America Hazardous Waste Management Market Revenue Share (%), by Type 2025 & 2033
- Figure 54: South America Hazardous Waste Management Market Volume Share (%), by Type 2025 & 2033
- Figure 55: South America Hazardous Waste Management Market Revenue (Million), by Waste 2025 & 2033
- Figure 56: South America Hazardous Waste Management Market Volume (Billion), by Waste 2025 & 2033
- Figure 57: South America Hazardous Waste Management Market Revenue Share (%), by Waste 2025 & 2033
- Figure 58: South America Hazardous Waste Management Market Volume Share (%), by Waste 2025 & 2033
- Figure 59: South America Hazardous Waste Management Market Revenue (Million), by Country 2025 & 2033
- Figure 60: South America Hazardous Waste Management Market Volume (Billion), by Country 2025 & 2033
- Figure 61: South America Hazardous Waste Management Market Revenue Share (%), by Country 2025 & 2033
- Figure 62: South America Hazardous Waste Management Market Volume Share (%), by Country 2025 & 2033
List of Tables
- Table 1: Global Hazardous Waste Management Market Revenue Million Forecast, by Type 2020 & 2033
- Table 2: Global Hazardous Waste Management Market Volume Billion Forecast, by Type 2020 & 2033
- Table 3: Global Hazardous Waste Management Market Revenue Million Forecast, by Waste 2020 & 2033
- Table 4: Global Hazardous Waste Management Market Volume Billion Forecast, by Waste 2020 & 2033
- Table 5: Global Hazardous Waste Management Market Revenue Million Forecast, by Region 2020 & 2033
- Table 6: Global Hazardous Waste Management Market Volume Billion Forecast, by Region 2020 & 2033
- Table 7: Global Hazardous Waste Management Market Revenue Million Forecast, by Type 2020 & 2033
- Table 8: Global Hazardous Waste Management Market Volume Billion Forecast, by Type 2020 & 2033
- Table 9: Global Hazardous Waste Management Market Revenue Million Forecast, by Waste 2020 & 2033
- Table 10: Global Hazardous Waste Management Market Volume Billion Forecast, by Waste 2020 & 2033
- Table 11: Global Hazardous Waste Management Market Revenue Million Forecast, by Country 2020 & 2033
- Table 12: Global Hazardous Waste Management Market Volume Billion Forecast, by Country 2020 & 2033
- Table 13: United States Hazardous Waste Management Market Revenue (Million) Forecast, by Application 2020 & 2033
- Table 14: United States Hazardous Waste Management Market Volume (Billion) Forecast, by Application 2020 & 2033
- Table 15: Canada Hazardous Waste Management Market Revenue (Million) Forecast, by Application 2020 & 2033
- Table 16: Canada Hazardous Waste Management Market Volume (Billion) Forecast, by Application 2020 & 2033
- Table 17: Global Hazardous Waste Management Market Revenue Million Forecast, by Type 2020 & 2033
- Table 18: Global Hazardous Waste Management Market Volume Billion Forecast, by Type 2020 & 2033
- Table 19: Global Hazardous Waste Management Market Revenue Million Forecast, by Waste 2020 & 2033
- Table 20: Global Hazardous Waste Management Market Volume Billion Forecast, by Waste 2020 & 2033
- Table 21: Global Hazardous Waste Management Market Revenue Million Forecast, by Country 2020 & 2033
- Table 22: Global Hazardous Waste Management Market Volume Billion Forecast, by Country 2020 & 2033
- Table 23: Germany Hazardous Waste Management Market Revenue (Million) Forecast, by Application 2020 & 2033
- Table 24: Germany Hazardous Waste Management Market Volume (Billion) Forecast, by Application 2020 & 2033
- Table 25: United Kingdom Hazardous Waste Management Market Revenue (Million) Forecast, by Application 2020 & 2033
- Table 26: United Kingdom Hazardous Waste Management Market Volume (Billion) Forecast, by Application 2020 & 2033
- Table 27: France Hazardous Waste Management Market Revenue (Million) Forecast, by Application 2020 & 2033
- Table 28: France Hazardous Waste Management Market Volume (Billion) Forecast, by Application 2020 & 2033
- Table 29: Russia Hazardous Waste Management Market Revenue (Million) Forecast, by Application 2020 & 2033
- Table 30: Russia Hazardous Waste Management Market Volume (Billion) Forecast, by Application 2020 & 2033
- Table 31: Spain Hazardous Waste Management Market Revenue (Million) Forecast, by Application 2020 & 2033
- Table 32: Spain Hazardous Waste Management Market Volume (Billion) Forecast, by Application 2020 & 2033
- Table 33: Rest of Europe Hazardous Waste Management Market Revenue (Million) Forecast, by Application 2020 & 2033
- Table 34: Rest of Europe Hazardous Waste Management Market Volume (Billion) Forecast, by Application 2020 & 2033
- Table 35: Global Hazardous Waste Management Market Revenue Million Forecast, by Type 2020 & 2033
- Table 36: Global Hazardous Waste Management Market Volume Billion Forecast, by Type 2020 & 2033
- Table 37: Global Hazardous Waste Management Market Revenue Million Forecast, by Waste 2020 & 2033
- Table 38: Global Hazardous Waste Management Market Volume Billion Forecast, by Waste 2020 & 2033
- Table 39: Global Hazardous Waste Management Market Revenue Million Forecast, by Country 2020 & 2033
- Table 40: Global Hazardous Waste Management Market Volume Billion Forecast, by Country 2020 & 2033
- Table 41: India Hazardous Waste Management Market Revenue (Million) Forecast, by Application 2020 & 2033
- Table 42: India Hazardous Waste Management Market Volume (Billion) Forecast, by Application 2020 & 2033
- Table 43: China Hazardous Waste Management Market Revenue (Million) Forecast, by Application 2020 & 2033
- Table 44: China Hazardous Waste Management Market Volume (Billion) Forecast, by Application 2020 & 2033
- Table 45: Japan Hazardous Waste Management Market Revenue (Million) Forecast, by Application 2020 & 2033
- Table 46: Japan Hazardous Waste Management Market Volume (Billion) Forecast, by Application 2020 & 2033
- Table 47: Rest of Asia Pacific Hazardous Waste Management Market Revenue (Million) Forecast, by Application 2020 & 2033
- Table 48: Rest of Asia Pacific Hazardous Waste Management Market Volume (Billion) Forecast, by Application 2020 & 2033
- Table 49: Global Hazardous Waste Management Market Revenue Million Forecast, by Type 2020 & 2033
- Table 50: Global Hazardous Waste Management Market Volume Billion Forecast, by Type 2020 & 2033
- Table 51: Global Hazardous Waste Management Market Revenue Million Forecast, by Waste 2020 & 2033
- Table 52: Global Hazardous Waste Management Market Volume Billion Forecast, by Waste 2020 & 2033
- Table 53: Global Hazardous Waste Management Market Revenue Million Forecast, by Country 2020 & 2033
- Table 54: Global Hazardous Waste Management Market Volume Billion Forecast, by Country 2020 & 2033
- Table 55: United Arab Emirates Hazardous Waste Management Market Revenue (Million) Forecast, by Application 2020 & 2033
- Table 56: United Arab Emirates Hazardous Waste Management Market Volume (Billion) Forecast, by Application 2020 & 2033
- Table 57: Saudi Arabia Hazardous Waste Management Market Revenue (Million) Forecast, by Application 2020 & 2033
- Table 58: Saudi Arabia Hazardous Waste Management Market Volume (Billion) Forecast, by Application 2020 & 2033
- Table 59: Rest of Middle East Hazardous Waste Management Market Revenue (Million) Forecast, by Application 2020 & 2033
- Table 60: Rest of Middle East Hazardous Waste Management Market Volume (Billion) Forecast, by Application 2020 & 2033
- Table 61: Global Hazardous Waste Management Market Revenue Million Forecast, by Type 2020 & 2033
- Table 62: Global Hazardous Waste Management Market Volume Billion Forecast, by Type 2020 & 2033
- Table 63: Global Hazardous Waste Management Market Revenue Million Forecast, by Waste 2020 & 2033
- Table 64: Global Hazardous Waste Management Market Volume Billion Forecast, by Waste 2020 & 2033
- Table 65: Global Hazardous Waste Management Market Revenue Million Forecast, by Country 2020 & 2033
- Table 66: Global Hazardous Waste Management Market Volume Billion Forecast, by Country 2020 & 2033
- Table 67: Brazil Hazardous Waste Management Market Revenue (Million) Forecast, by Application 2020 & 2033
- Table 68: Brazil Hazardous Waste Management Market Volume (Billion) Forecast, by Application 2020 & 2033
- Table 69: Argentina Hazardous Waste Management Market Revenue (Million) Forecast, by Application 2020 & 2033
- Table 70: Argentina Hazardous Waste Management Market Volume (Billion) Forecast, by Application 2020 & 2033
- Table 71: Rest of South America Hazardous Waste Management Market Revenue (Million) Forecast, by Application 2020 & 2033
- Table 72: Rest of South America Hazardous Waste Management Market Volume (Billion) Forecast, by Application 2020 & 2033
Frequently Asked Questions
1. What is the projected Compound Annual Growth Rate (CAGR) of the Hazardous Waste Management Market?
The projected CAGR is approximately 3.74%.
2. Which companies are prominent players in the Hazardous Waste Management Market?
Key companies in the market include Suez, Valicor, Veolia, Waste Connections, Waste Management, Republic Services, Biffa, Clean Harbors, Covanta Holding, Daiseki, Hitachi Zosen, Remondis SE & Co Kg, Urbaser, Biomedical Solutions*List Not Exhaustive 6 3 Other Companie.
3. What are the main segments of the Hazardous Waste Management Market?
The market segments include Type, Waste.
4. Can you provide details about the market size?
The market size is estimated to be USD 38.77 Million as of 2022.
5. What are some drivers contributing to market growth?
Stringent Global Environmental Regulations Drive Demand for Compliant Hazardous Waste Management and Disposal Solutions; Increased Industrial Activities and Urbanization Driving up Hazardous Waste Production. Fueling Demand for Waste Management Services; Innovations in Waste Treatment Technologies. such as Advanced Recycling and Waste-to-Energy Processes. Enhance Efficiency and Reduce Environmental Impact.
6. What are the notable trends driving market growth?
Asia-Pacific Expected to Dominate the Market Over the Coming Years.
7. Are there any restraints impacting market growth?
Stringent Global Environmental Regulations Drive Demand for Compliant Hazardous Waste Management and Disposal Solutions; Increased Industrial Activities and Urbanization Driving up Hazardous Waste Production. Fueling Demand for Waste Management Services; Innovations in Waste Treatment Technologies. such as Advanced Recycling and Waste-to-Energy Processes. Enhance Efficiency and Reduce Environmental Impact.
8. Can you provide examples of recent developments in the market?
April 2024: China Everbright Environment Group Limited, known as Everbright Environment, celebrated the successful construction of its Hue Waste-to-Energy Project in Thua Thien Hue Province, Vietnam. The event was graced by the presence of Vietnamese Prime Minister Pham Minh Chinh.
9. What pricing options are available for accessing the report?
Pricing options include single-user, multi-user, and enterprise licenses priced at USD 4750, USD 5250, and USD 8750 respectively.
10. Is the market size provided in terms of value or volume?
The market size is provided in terms of value, measured in Million and volume, measured in Billion.
11. Are there any specific market keywords associated with the report?
Yes, the market keyword associated with the report is "Hazardous Waste Management Market," which aids in identifying and referencing the specific market segment covered.
12. How do I determine which pricing option suits my needs best?
The pricing options vary based on user requirements and access needs. Individual users may opt for single-user licenses, while businesses requiring broader access may choose multi-user or enterprise licenses for cost-effective access to the report.
13. Are there any additional resources or data provided in the Hazardous Waste Management Market report?
While the report offers comprehensive insights, it's advisable to review the specific contents or supplementary materials provided to ascertain if additional resources or data are available.
14. How can I stay updated on further developments or reports in the Hazardous Waste Management Market?
To stay informed about further developments, trends, and reports in the Hazardous Waste Management Market, consider subscribing to industry newsletters, following relevant companies and organizations, or regularly checking reputable industry news sources and publications.
Methodology
Step 1 - Identification of Relevant Samples Size from Population Database


Step 2 - Approaches for Defining Global Market Size (Value, Volume* & Price*)

Note*: In applicable scenarios
Step 3 - Data Sources
Primary Research
- Web Analytics
- Survey Reports
- Research Institute
- Latest Research Reports
- Opinion Leaders
Secondary Research
- Annual Reports
- White Paper
- Latest Press Release
- Industry Association
- Paid Database
- Investor Presentations

Step 4 - Data Triangulation
Involves using different sources of information in order to increase the validity of a study
These sources are likely to be stakeholders in a program - participants, other researchers, program staff, other community members, and so on.
Then we put all data in single framework & apply various statistical tools to find out the dynamic on the market.
During the analysis stage, feedback from the stakeholder groups would be compared to determine areas of agreement as well as areas of divergence