
Key Insights
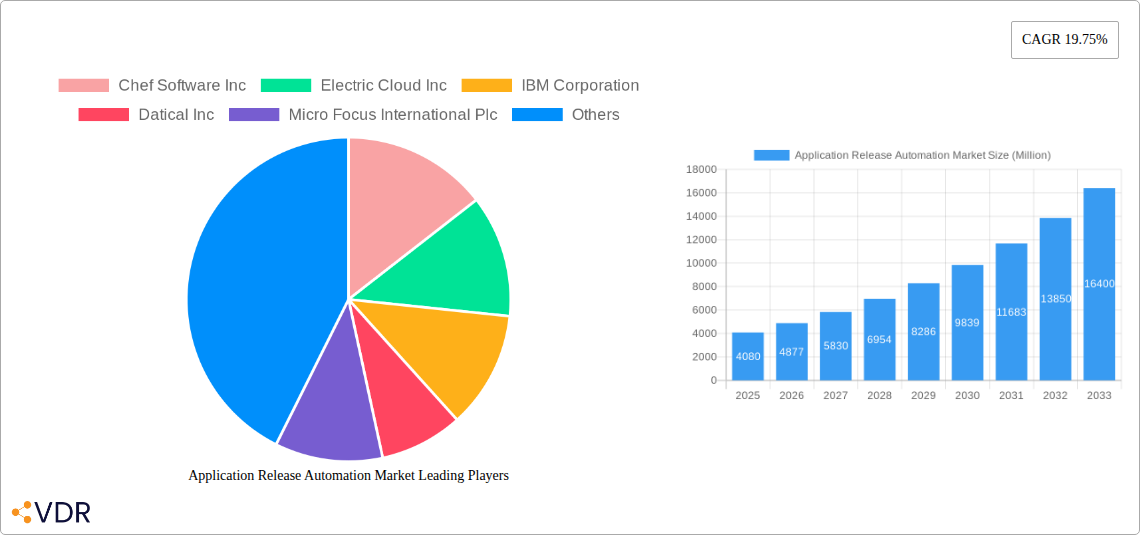
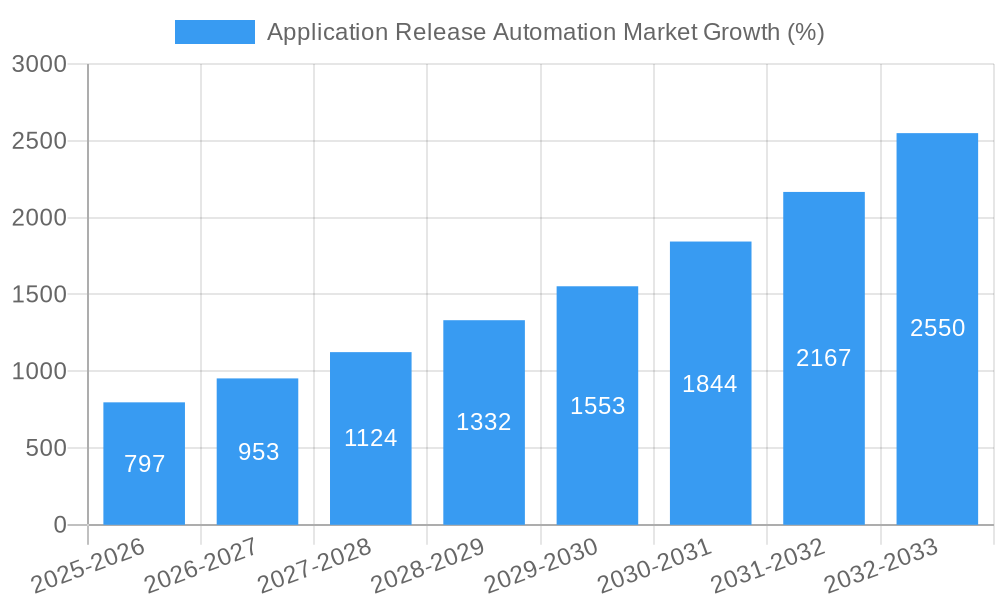
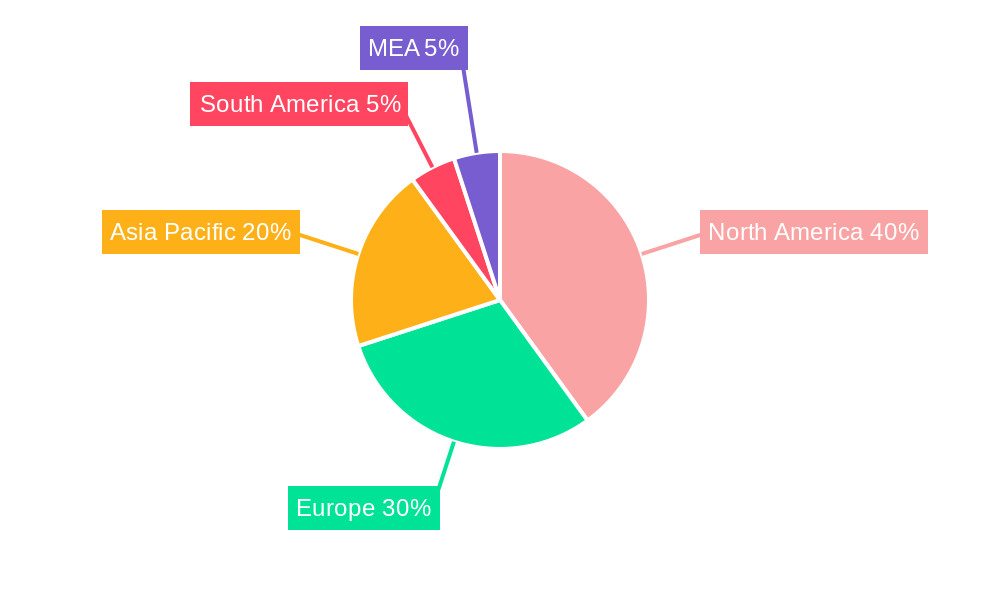
The Application Release Automation (ARA) market is experiencing robust growth, projected to reach $4.08 billion in 2025 and maintain a Compound Annual Growth Rate (CAGR) of 19.75% from 2025 to 2033. This expansion is driven by several key factors. Firstly, the increasing complexity of software applications and the rising frequency of releases necessitate efficient and automated deployment processes. Secondly, the shift towards cloud-based deployments and DevOps practices further fuels demand for ARA solutions. Organizations are adopting these solutions to reduce deployment time, minimize errors, and enhance overall efficiency. The BFSI, IT & Telecommunications, and Retail & E-commerce sectors are leading adopters, driven by the need for rapid innovation and improved customer experience. The market is segmented by component (tool and services) and deployment (cloud and on-premises), with the cloud segment expected to dominate due to its scalability and cost-effectiveness. Competition is fierce, with established players like IBM, Microsoft, and Broadcom alongside specialized vendors such as Chef Software and Electric Cloud vying for market share. Geographical growth will be seen across regions, with North America and Europe initially holding larger market shares due to higher adoption rates and technological advancement, while the Asia-Pacific region is anticipated to demonstrate significant growth potential in the coming years due to rising digitalization and investment in technology infrastructure.
The sustained high CAGR reflects several trends, including the increasing adoption of agile and DevOps methodologies, the growing need for continuous integration and continuous delivery (CI/CD) pipelines, and a heightened focus on enhancing security throughout the release process. However, the market faces certain restraints, such as the initial investment costs associated with implementing ARA solutions and the need for skilled professionals to manage and maintain these systems. Despite these challenges, the long-term outlook for the ARA market remains exceptionally positive, driven by the ongoing digital transformation initiatives and the imperative for organizations to accelerate their software delivery cycles to maintain a competitive edge in the rapidly evolving technological landscape. The market is expected to continue its strong growth trajectory fueled by the expanding adoption of cloud-native applications and microservices architectures, which further amplify the need for robust and efficient ARA solutions.
This in-depth report provides a comprehensive analysis of the Application Release Automation (ARA) market, encompassing market dynamics, growth trends, regional insights, competitive landscape, and future outlook. With a study period spanning 2019-2033, a base year of 2025, and a forecast period of 2025-2033, this report is an essential resource for industry professionals, investors, and strategic decision-makers. The parent market is IT automation and the child market is Application Release Automation. The market size is predicted to reach xx Million by 2033.
Application Release Automation Market Dynamics & Structure
The Application Release Automation market is characterized by a moderately concentrated landscape with key players such as Chef Software Inc, Electric Cloud Inc, IBM Corporation, Datical Inc, Micro Focus International Plc, CollabNet Inc, CloudBees Inc, Broadcom Inc, Microsoft Corporation, BMC Software Inc, Flexagon LLC, ARCAD Software, and Attunity Ltd vying for market share. Market concentration is influenced by factors like technological innovation, M&A activity, and regulatory frameworks.
- Market Concentration: The market exhibits a moderate level of concentration, with the top 5 players holding approximately xx% of the market share in 2024. This is expected to slightly decrease to xx% by 2033 due to the entry of new players and increased competition.
- Technological Innovation: Continuous advancements in DevOps practices, cloud computing, and AI/ML are driving innovation in ARA tools and services. The adoption of containerization and serverless technologies is further fueling market growth. However, integrating these new technologies within existing legacy systems presents a significant barrier to innovation.
- Regulatory Frameworks: Data privacy regulations (GDPR, CCPA) influence the development and adoption of secure ARA solutions, increasing demand for tools with robust security features. Compliance requirements drive the adoption of ARA solutions.
- Competitive Product Substitutes: While ARA solutions offer comprehensive automation, some organizations might opt for manual processes or custom-built scripts, posing a competitive challenge. The cost-effectiveness and ease of implementation of these substitutes are key factors to consider.
- End-User Demographics: The primary end-users are IT departments and DevOps teams across various industries. The growing adoption of agile and DevOps methodologies is driving demand across organizations of all sizes. The BFSI and IT & Telecommunications sectors represent the largest end-user segments.
- M&A Trends: The market has witnessed a moderate number of mergers and acquisitions in recent years, primarily focused on consolidating market share and expanding product portfolios. An estimated xx M&A deals occurred between 2019 and 2024.
Application Release Automation Market Growth Trends & Insights
The Application Release Automation market is experiencing robust growth, driven by the increasing adoption of DevOps methodologies, the shift towards cloud-native applications, and the need for faster and more reliable software releases. The market size, estimated at xx Million in 2025, is projected to reach xx Million by 2033, exhibiting a CAGR of xx% during the forecast period. This growth is fueled by several factors, including:
- Increased Adoption of DevOps: Organizations are increasingly embracing DevOps principles to accelerate software delivery cycles and improve collaboration between development and operations teams. ARA plays a crucial role in enabling DevOps practices.
- Cloud Adoption: The widespread migration to cloud-based infrastructure has significantly impacted the ARA market. Cloud-based ARA solutions are gaining popularity due to their scalability, flexibility, and cost-effectiveness.
- Microservices Architecture: The adoption of microservices architecture necessitates efficient ARA solutions to manage the deployment and updates of numerous independent services.
- Digital Transformation: Organizations across various industries are undergoing digital transformation initiatives, leading to an increased demand for efficient and reliable software deployment processes.
- Market Penetration: The market penetration of ARA solutions is steadily increasing, particularly within large enterprises. However, there remains significant untapped potential in small and medium-sized enterprises (SMEs).
Dominant Regions, Countries, or Segments in Application Release Automation Market
North America currently holds the largest market share in the Application Release Automation market, followed by Europe. Within the segmented view:
By Component: The "Tool" segment dominates the market, holding xx% of the market share in 2025, driven by the increasing demand for sophisticated ARA tools that integrate with various development and deployment platforms. The "Services" segment is experiencing strong growth, with a projected CAGR of xx% during the forecast period, due to the rising need for expert assistance in implementing and managing ARA solutions.
By Deployment: The "Cloud" deployment model is rapidly gaining traction, surpassing the "On-Premises" model in 2025 and holding xx% market share, due to its scalability, flexibility, and cost-effectiveness.
By End-User Industries: The BFSI and IT & Telecommunications sectors are the major contributors to market growth. BFSI's stringent regulatory requirements and need for high availability drive ARA adoption. The IT & Telecommunications sector's focus on continuous innovation and rapid deployment further fuels demand. The Retail & E-commerce sector is also showing significant growth, owing to the increasing reliance on online platforms and personalized customer experiences.
Key Drivers:
- Strong government support for digital transformation initiatives.
- Favorable economic conditions in developed regions.
- Well-developed IT infrastructure supporting the adoption of cloud-based ARA solutions.
Dominance Factors:
- Early adoption of DevOps and cloud computing technologies.
- Higher concentration of technology companies and significant IT spending.
- Strong regulatory frameworks driving the adoption of secure ARA solutions.
Application Release Automation Market Product Landscape
The ARA market offers a diverse range of products, from standalone tools to comprehensive platforms incorporating AI/ML capabilities for enhanced automation, predictive analytics, and improved decision-making. Key product innovations include AI-powered release orchestration, improved integration with CI/CD pipelines, and enhanced security features. These advancements offer unique selling propositions such as faster deployment cycles, reduced error rates, and improved collaboration.
Key Drivers, Barriers & Challenges in Application Release Automation Market
Key Drivers: The increasing adoption of DevOps and Agile methodologies, the growing complexity of software applications, and the need for faster and more reliable software releases are the primary drivers of growth. Furthermore, the shift towards cloud-based infrastructure and the increasing demand for seamless integration with various development tools further accelerate market growth.
Key Challenges and Restraints: The high initial investment cost associated with implementing ARA solutions can be a deterrent for some organizations, especially SMEs. Integration complexities with existing legacy systems and the shortage of skilled professionals with expertise in ARA tools and technologies pose significant challenges. The risk of security breaches and the potential for disruptions during the release process are also significant concerns. These challenges collectively might limit market growth, impacting the predicted CAGR by xx%.
Emerging Opportunities in Application Release Automation Market
Emerging opportunities lie in extending ARA capabilities to support serverless architectures, edge computing deployments, and AI/ML-powered automation. The increasing demand for secure and compliant ARA solutions presents an opportunity for vendors to develop tools with enhanced security and compliance features. Untapped markets in developing economies, coupled with growing digital transformation initiatives within SMEs, offer significant potential for market expansion.
Growth Accelerators in the Application Release Automation Market Industry
The continued evolution of DevOps methodologies, the expansion of cloud adoption across industries, and technological advancements such as AI/ML integration will serve as significant growth catalysts. Strategic partnerships between ARA vendors and cloud providers, along with the development of innovative solutions catering to specific industry needs, will further drive market expansion and penetration.
Key Players Shaping the Application Release Automation Market Market
- Chef Software Inc
- Electric Cloud Inc
- IBM Corporation
- Datical Inc
- Micro Focus International Plc
- CollabNet Inc
- CloudBees Inc
- Broadcom Inc
- Microsoft Corporation
- BMC Software Inc
- Flexagon LLC
- ARCAD Software
- Attunity Ltd
Notable Milestones in Application Release Automation Market Sector
- December 2022: Salesforce announced the general availability of its DevOps Center, streamlining the release of custom solutions and accelerating development cycles. This significantly impacted market dynamics by enhancing collaboration and improving release speeds within the Salesforce ecosystem.
- February 2023: Red Hat, Inc. launched the Red Hat Ansible Automation Platform on Google Cloud, expanding the platform's reach and simplifying IT automation across diverse environments. This broadened the applicability of ARA solutions and stimulated growth by offering a flexible and scalable solution.
In-Depth Application Release Automation Market Market Outlook
The future of the Application Release Automation market appears promising, with continued growth driven by technological advancements, increasing adoption of DevOps, and expansion into new markets. Strategic partnerships and innovative product development will play a key role in shaping the future landscape. The market is poised to witness significant growth, driven by the increasing demand for faster and more reliable software releases across diverse industries. This growth trajectory is expected to be sustained by ongoing innovations in ARA tools and services and the wider adoption of cloud-based solutions.
Application Release Automation Market Segmentation
-
1. Component
- 1.1. Tool
- 1.2. Services
-
2. Deployment
- 2.1. Cloud
- 2.2. On-Premises
-
3. End-User Industries
- 3.1. BFSI
- 3.2. IT & Telecommunications
- 3.3. Retail & E-commerce
- 3.4. Media & Entertainment
- 3.5. Others End-User Industries
Application Release Automation Market Segmentation By Geography
- 1. North America
- 2. Europe
- 3. Asia Pacific
- 4. Rest of the World
Application Release Automation Market REPORT HIGHLIGHTS
| Aspects | Details |
|---|---|
| Study Period | 2019-2033 |
| Base Year | 2024 |
| Estimated Year | 2025 |
| Forecast Period | 2025-2033 |
| Historical Period | 2019-2024 |
| Growth Rate | CAGR of 19.75% from 2019-2033 |
| Segmentation |
|
Table of Contents
- 1. Introduction
- 1.1. Research Scope
- 1.2. Market Segmentation
- 1.3. Research Methodology
- 1.4. Definitions and Assumptions
- 2. Executive Summary
- 2.1. Introduction
- 3. Market Dynamics
- 3.1. Introduction
- 3.2. Market Drivers
- 3.2.1. On Increasing Demand of Faster Delivery of Software with Reduced Operational Risk; Rapid Adoption by Enterprise to Deliver Differentiated Customer Experiences and to Retain
- 3.3. Market Restrains
- 3.3.1. High Cost of Product and Failed Deployment of Software or Applications and Complexity in Configurations
- 3.4. Market Trends
- 3.4.1. Cloud is Expected to Hold Significant Market Share
- 4. Market Factor Analysis
- 4.1. Porters Five Forces
- 4.2. Supply/Value Chain
- 4.3. PESTEL analysis
- 4.4. Market Entropy
- 4.5. Patent/Trademark Analysis
- 5. Global Application Release Automation Market Analysis, Insights and Forecast, 2019-2031
- 5.1. Market Analysis, Insights and Forecast - by Component
- 5.1.1. Tool
- 5.1.2. Services
- 5.2. Market Analysis, Insights and Forecast - by Deployment
- 5.2.1. Cloud
- 5.2.2. On-Premises
- 5.3. Market Analysis, Insights and Forecast - by End-User Industries
- 5.3.1. BFSI
- 5.3.2. IT & Telecommunications
- 5.3.3. Retail & E-commerce
- 5.3.4. Media & Entertainment
- 5.3.5. Others End-User Industries
- 5.4. Market Analysis, Insights and Forecast - by Region
- 5.4.1. North America
- 5.4.2. Europe
- 5.4.3. Asia Pacific
- 5.4.4. Rest of the World
- 5.1. Market Analysis, Insights and Forecast - by Component
- 6. North America Application Release Automation Market Analysis, Insights and Forecast, 2019-2031
- 6.1. Market Analysis, Insights and Forecast - by Component
- 6.1.1. Tool
- 6.1.2. Services
- 6.2. Market Analysis, Insights and Forecast - by Deployment
- 6.2.1. Cloud
- 6.2.2. On-Premises
- 6.3. Market Analysis, Insights and Forecast - by End-User Industries
- 6.3.1. BFSI
- 6.3.2. IT & Telecommunications
- 6.3.3. Retail & E-commerce
- 6.3.4. Media & Entertainment
- 6.3.5. Others End-User Industries
- 6.1. Market Analysis, Insights and Forecast - by Component
- 7. Europe Application Release Automation Market Analysis, Insights and Forecast, 2019-2031
- 7.1. Market Analysis, Insights and Forecast - by Component
- 7.1.1. Tool
- 7.1.2. Services
- 7.2. Market Analysis, Insights and Forecast - by Deployment
- 7.2.1. Cloud
- 7.2.2. On-Premises
- 7.3. Market Analysis, Insights and Forecast - by End-User Industries
- 7.3.1. BFSI
- 7.3.2. IT & Telecommunications
- 7.3.3. Retail & E-commerce
- 7.3.4. Media & Entertainment
- 7.3.5. Others End-User Industries
- 7.1. Market Analysis, Insights and Forecast - by Component
- 8. Asia Pacific Application Release Automation Market Analysis, Insights and Forecast, 2019-2031
- 8.1. Market Analysis, Insights and Forecast - by Component
- 8.1.1. Tool
- 8.1.2. Services
- 8.2. Market Analysis, Insights and Forecast - by Deployment
- 8.2.1. Cloud
- 8.2.2. On-Premises
- 8.3. Market Analysis, Insights and Forecast - by End-User Industries
- 8.3.1. BFSI
- 8.3.2. IT & Telecommunications
- 8.3.3. Retail & E-commerce
- 8.3.4. Media & Entertainment
- 8.3.5. Others End-User Industries
- 8.1. Market Analysis, Insights and Forecast - by Component
- 9. Rest of the World Application Release Automation Market Analysis, Insights and Forecast, 2019-2031
- 9.1. Market Analysis, Insights and Forecast - by Component
- 9.1.1. Tool
- 9.1.2. Services
- 9.2. Market Analysis, Insights and Forecast - by Deployment
- 9.2.1. Cloud
- 9.2.2. On-Premises
- 9.3. Market Analysis, Insights and Forecast - by End-User Industries
- 9.3.1. BFSI
- 9.3.2. IT & Telecommunications
- 9.3.3. Retail & E-commerce
- 9.3.4. Media & Entertainment
- 9.3.5. Others End-User Industries
- 9.1. Market Analysis, Insights and Forecast - by Component
- 10. North America Application Release Automation Market Analysis, Insights and Forecast, 2019-2031
- 10.1. Market Analysis, Insights and Forecast - By Country/Sub-region
- 10.1.1 United States
- 10.1.2 Canada
- 10.1.3 Mexico
- 11. Europe Application Release Automation Market Analysis, Insights and Forecast, 2019-2031
- 11.1. Market Analysis, Insights and Forecast - By Country/Sub-region
- 11.1.1 Germany
- 11.1.2 United Kingdom
- 11.1.3 France
- 11.1.4 Spain
- 11.1.5 Italy
- 11.1.6 Spain
- 11.1.7 Belgium
- 11.1.8 Netherland
- 11.1.9 Nordics
- 11.1.10 Rest of Europe
- 12. Asia Pacific Application Release Automation Market Analysis, Insights and Forecast, 2019-2031
- 12.1. Market Analysis, Insights and Forecast - By Country/Sub-region
- 12.1.1 China
- 12.1.2 Japan
- 12.1.3 India
- 12.1.4 South Korea
- 12.1.5 Southeast Asia
- 12.1.6 Australia
- 12.1.7 Indonesia
- 12.1.8 Phillipes
- 12.1.9 Singapore
- 12.1.10 Thailandc
- 12.1.11 Rest of Asia Pacific
- 13. South America Application Release Automation Market Analysis, Insights and Forecast, 2019-2031
- 13.1. Market Analysis, Insights and Forecast - By Country/Sub-region
- 13.1.1 Brazil
- 13.1.2 Argentina
- 13.1.3 Peru
- 13.1.4 Chile
- 13.1.5 Colombia
- 13.1.6 Ecuador
- 13.1.7 Venezuela
- 13.1.8 Rest of South America
- 14. North America Application Release Automation Market Analysis, Insights and Forecast, 2019-2031
- 14.1. Market Analysis, Insights and Forecast - By Country/Sub-region
- 14.1.1 United States
- 14.1.2 Canada
- 14.1.3 Mexico
- 15. MEA Application Release Automation Market Analysis, Insights and Forecast, 2019-2031
- 15.1. Market Analysis, Insights and Forecast - By Country/Sub-region
- 15.1.1 United Arab Emirates
- 15.1.2 Saudi Arabia
- 15.1.3 South Africa
- 15.1.4 Rest of Middle East and Africa
- 16. Competitive Analysis
- 16.1. Global Market Share Analysis 2024
- 16.2. Company Profiles
- 16.2.1 Chef Software Inc
- 16.2.1.1. Overview
- 16.2.1.2. Products
- 16.2.1.3. SWOT Analysis
- 16.2.1.4. Recent Developments
- 16.2.1.5. Financials (Based on Availability)
- 16.2.2 Electric Cloud Inc
- 16.2.2.1. Overview
- 16.2.2.2. Products
- 16.2.2.3. SWOT Analysis
- 16.2.2.4. Recent Developments
- 16.2.2.5. Financials (Based on Availability)
- 16.2.3 IBM Corporation
- 16.2.3.1. Overview
- 16.2.3.2. Products
- 16.2.3.3. SWOT Analysis
- 16.2.3.4. Recent Developments
- 16.2.3.5. Financials (Based on Availability)
- 16.2.4 Datical Inc
- 16.2.4.1. Overview
- 16.2.4.2. Products
- 16.2.4.3. SWOT Analysis
- 16.2.4.4. Recent Developments
- 16.2.4.5. Financials (Based on Availability)
- 16.2.5 Micro Focus International Plc
- 16.2.5.1. Overview
- 16.2.5.2. Products
- 16.2.5.3. SWOT Analysis
- 16.2.5.4. Recent Developments
- 16.2.5.5. Financials (Based on Availability)
- 16.2.6 CollabNet Inc
- 16.2.6.1. Overview
- 16.2.6.2. Products
- 16.2.6.3. SWOT Analysis
- 16.2.6.4. Recent Developments
- 16.2.6.5. Financials (Based on Availability)
- 16.2.7 CloudBees Inc
- 16.2.7.1. Overview
- 16.2.7.2. Products
- 16.2.7.3. SWOT Analysis
- 16.2.7.4. Recent Developments
- 16.2.7.5. Financials (Based on Availability)
- 16.2.8 Broadcom Inc
- 16.2.8.1. Overview
- 16.2.8.2. Products
- 16.2.8.3. SWOT Analysis
- 16.2.8.4. Recent Developments
- 16.2.8.5. Financials (Based on Availability)
- 16.2.9 Microsoft Corporation
- 16.2.9.1. Overview
- 16.2.9.2. Products
- 16.2.9.3. SWOT Analysis
- 16.2.9.4. Recent Developments
- 16.2.9.5. Financials (Based on Availability)
- 16.2.10 BMC Software Inc
- 16.2.10.1. Overview
- 16.2.10.2. Products
- 16.2.10.3. SWOT Analysis
- 16.2.10.4. Recent Developments
- 16.2.10.5. Financials (Based on Availability)
- 16.2.11 Flexagon LLC
- 16.2.11.1. Overview
- 16.2.11.2. Products
- 16.2.11.3. SWOT Analysis
- 16.2.11.4. Recent Developments
- 16.2.11.5. Financials (Based on Availability)
- 16.2.12 ARCAD Software
- 16.2.12.1. Overview
- 16.2.12.2. Products
- 16.2.12.3. SWOT Analysis
- 16.2.12.4. Recent Developments
- 16.2.12.5. Financials (Based on Availability)
- 16.2.13 Attunity Ltd
- 16.2.13.1. Overview
- 16.2.13.2. Products
- 16.2.13.3. SWOT Analysis
- 16.2.13.4. Recent Developments
- 16.2.13.5. Financials (Based on Availability)
- 16.2.1 Chef Software Inc
List of Figures
- Figure 1: Global Application Release Automation Market Revenue Breakdown (Million, %) by Region 2024 & 2032
- Figure 2: North America Application Release Automation Market Revenue (Million), by Country 2024 & 2032
- Figure 3: North America Application Release Automation Market Revenue Share (%), by Country 2024 & 2032
- Figure 4: Europe Application Release Automation Market Revenue (Million), by Country 2024 & 2032
- Figure 5: Europe Application Release Automation Market Revenue Share (%), by Country 2024 & 2032
- Figure 6: Asia Pacific Application Release Automation Market Revenue (Million), by Country 2024 & 2032
- Figure 7: Asia Pacific Application Release Automation Market Revenue Share (%), by Country 2024 & 2032
- Figure 8: South America Application Release Automation Market Revenue (Million), by Country 2024 & 2032
- Figure 9: South America Application Release Automation Market Revenue Share (%), by Country 2024 & 2032
- Figure 10: North America Application Release Automation Market Revenue (Million), by Country 2024 & 2032
- Figure 11: North America Application Release Automation Market Revenue Share (%), by Country 2024 & 2032
- Figure 12: MEA Application Release Automation Market Revenue (Million), by Country 2024 & 2032
- Figure 13: MEA Application Release Automation Market Revenue Share (%), by Country 2024 & 2032
- Figure 14: North America Application Release Automation Market Revenue (Million), by Component 2024 & 2032
- Figure 15: North America Application Release Automation Market Revenue Share (%), by Component 2024 & 2032
- Figure 16: North America Application Release Automation Market Revenue (Million), by Deployment 2024 & 2032
- Figure 17: North America Application Release Automation Market Revenue Share (%), by Deployment 2024 & 2032
- Figure 18: North America Application Release Automation Market Revenue (Million), by End-User Industries 2024 & 2032
- Figure 19: North America Application Release Automation Market Revenue Share (%), by End-User Industries 2024 & 2032
- Figure 20: North America Application Release Automation Market Revenue (Million), by Country 2024 & 2032
- Figure 21: North America Application Release Automation Market Revenue Share (%), by Country 2024 & 2032
- Figure 22: Europe Application Release Automation Market Revenue (Million), by Component 2024 & 2032
- Figure 23: Europe Application Release Automation Market Revenue Share (%), by Component 2024 & 2032
- Figure 24: Europe Application Release Automation Market Revenue (Million), by Deployment 2024 & 2032
- Figure 25: Europe Application Release Automation Market Revenue Share (%), by Deployment 2024 & 2032
- Figure 26: Europe Application Release Automation Market Revenue (Million), by End-User Industries 2024 & 2032
- Figure 27: Europe Application Release Automation Market Revenue Share (%), by End-User Industries 2024 & 2032
- Figure 28: Europe Application Release Automation Market Revenue (Million), by Country 2024 & 2032
- Figure 29: Europe Application Release Automation Market Revenue Share (%), by Country 2024 & 2032
- Figure 30: Asia Pacific Application Release Automation Market Revenue (Million), by Component 2024 & 2032
- Figure 31: Asia Pacific Application Release Automation Market Revenue Share (%), by Component 2024 & 2032
- Figure 32: Asia Pacific Application Release Automation Market Revenue (Million), by Deployment 2024 & 2032
- Figure 33: Asia Pacific Application Release Automation Market Revenue Share (%), by Deployment 2024 & 2032
- Figure 34: Asia Pacific Application Release Automation Market Revenue (Million), by End-User Industries 2024 & 2032
- Figure 35: Asia Pacific Application Release Automation Market Revenue Share (%), by End-User Industries 2024 & 2032
- Figure 36: Asia Pacific Application Release Automation Market Revenue (Million), by Country 2024 & 2032
- Figure 37: Asia Pacific Application Release Automation Market Revenue Share (%), by Country 2024 & 2032
- Figure 38: Rest of the World Application Release Automation Market Revenue (Million), by Component 2024 & 2032
- Figure 39: Rest of the World Application Release Automation Market Revenue Share (%), by Component 2024 & 2032
- Figure 40: Rest of the World Application Release Automation Market Revenue (Million), by Deployment 2024 & 2032
- Figure 41: Rest of the World Application Release Automation Market Revenue Share (%), by Deployment 2024 & 2032
- Figure 42: Rest of the World Application Release Automation Market Revenue (Million), by End-User Industries 2024 & 2032
- Figure 43: Rest of the World Application Release Automation Market Revenue Share (%), by End-User Industries 2024 & 2032
- Figure 44: Rest of the World Application Release Automation Market Revenue (Million), by Country 2024 & 2032
- Figure 45: Rest of the World Application Release Automation Market Revenue Share (%), by Country 2024 & 2032
List of Tables
- Table 1: Global Application Release Automation Market Revenue Million Forecast, by Region 2019 & 2032
- Table 2: Global Application Release Automation Market Revenue Million Forecast, by Component 2019 & 2032
- Table 3: Global Application Release Automation Market Revenue Million Forecast, by Deployment 2019 & 2032
- Table 4: Global Application Release Automation Market Revenue Million Forecast, by End-User Industries 2019 & 2032
- Table 5: Global Application Release Automation Market Revenue Million Forecast, by Region 2019 & 2032
- Table 6: Global Application Release Automation Market Revenue Million Forecast, by Country 2019 & 2032
- Table 7: United States Application Release Automation Market Revenue (Million) Forecast, by Application 2019 & 2032
- Table 8: Canada Application Release Automation Market Revenue (Million) Forecast, by Application 2019 & 2032
- Table 9: Mexico Application Release Automation Market Revenue (Million) Forecast, by Application 2019 & 2032
- Table 10: Global Application Release Automation Market Revenue Million Forecast, by Country 2019 & 2032
- Table 11: Germany Application Release Automation Market Revenue (Million) Forecast, by Application 2019 & 2032
- Table 12: United Kingdom Application Release Automation Market Revenue (Million) Forecast, by Application 2019 & 2032
- Table 13: France Application Release Automation Market Revenue (Million) Forecast, by Application 2019 & 2032
- Table 14: Spain Application Release Automation Market Revenue (Million) Forecast, by Application 2019 & 2032
- Table 15: Italy Application Release Automation Market Revenue (Million) Forecast, by Application 2019 & 2032
- Table 16: Spain Application Release Automation Market Revenue (Million) Forecast, by Application 2019 & 2032
- Table 17: Belgium Application Release Automation Market Revenue (Million) Forecast, by Application 2019 & 2032
- Table 18: Netherland Application Release Automation Market Revenue (Million) Forecast, by Application 2019 & 2032
- Table 19: Nordics Application Release Automation Market Revenue (Million) Forecast, by Application 2019 & 2032
- Table 20: Rest of Europe Application Release Automation Market Revenue (Million) Forecast, by Application 2019 & 2032
- Table 21: Global Application Release Automation Market Revenue Million Forecast, by Country 2019 & 2032
- Table 22: China Application Release Automation Market Revenue (Million) Forecast, by Application 2019 & 2032
- Table 23: Japan Application Release Automation Market Revenue (Million) Forecast, by Application 2019 & 2032
- Table 24: India Application Release Automation Market Revenue (Million) Forecast, by Application 2019 & 2032
- Table 25: South Korea Application Release Automation Market Revenue (Million) Forecast, by Application 2019 & 2032
- Table 26: Southeast Asia Application Release Automation Market Revenue (Million) Forecast, by Application 2019 & 2032
- Table 27: Australia Application Release Automation Market Revenue (Million) Forecast, by Application 2019 & 2032
- Table 28: Indonesia Application Release Automation Market Revenue (Million) Forecast, by Application 2019 & 2032
- Table 29: Phillipes Application Release Automation Market Revenue (Million) Forecast, by Application 2019 & 2032
- Table 30: Singapore Application Release Automation Market Revenue (Million) Forecast, by Application 2019 & 2032
- Table 31: Thailandc Application Release Automation Market Revenue (Million) Forecast, by Application 2019 & 2032
- Table 32: Rest of Asia Pacific Application Release Automation Market Revenue (Million) Forecast, by Application 2019 & 2032
- Table 33: Global Application Release Automation Market Revenue Million Forecast, by Country 2019 & 2032
- Table 34: Brazil Application Release Automation Market Revenue (Million) Forecast, by Application 2019 & 2032
- Table 35: Argentina Application Release Automation Market Revenue (Million) Forecast, by Application 2019 & 2032
- Table 36: Peru Application Release Automation Market Revenue (Million) Forecast, by Application 2019 & 2032
- Table 37: Chile Application Release Automation Market Revenue (Million) Forecast, by Application 2019 & 2032
- Table 38: Colombia Application Release Automation Market Revenue (Million) Forecast, by Application 2019 & 2032
- Table 39: Ecuador Application Release Automation Market Revenue (Million) Forecast, by Application 2019 & 2032
- Table 40: Venezuela Application Release Automation Market Revenue (Million) Forecast, by Application 2019 & 2032
- Table 41: Rest of South America Application Release Automation Market Revenue (Million) Forecast, by Application 2019 & 2032
- Table 42: Global Application Release Automation Market Revenue Million Forecast, by Country 2019 & 2032
- Table 43: United States Application Release Automation Market Revenue (Million) Forecast, by Application 2019 & 2032
- Table 44: Canada Application Release Automation Market Revenue (Million) Forecast, by Application 2019 & 2032
- Table 45: Mexico Application Release Automation Market Revenue (Million) Forecast, by Application 2019 & 2032
- Table 46: Global Application Release Automation Market Revenue Million Forecast, by Country 2019 & 2032
- Table 47: United Arab Emirates Application Release Automation Market Revenue (Million) Forecast, by Application 2019 & 2032
- Table 48: Saudi Arabia Application Release Automation Market Revenue (Million) Forecast, by Application 2019 & 2032
- Table 49: South Africa Application Release Automation Market Revenue (Million) Forecast, by Application 2019 & 2032
- Table 50: Rest of Middle East and Africa Application Release Automation Market Revenue (Million) Forecast, by Application 2019 & 2032
- Table 51: Global Application Release Automation Market Revenue Million Forecast, by Component 2019 & 2032
- Table 52: Global Application Release Automation Market Revenue Million Forecast, by Deployment 2019 & 2032
- Table 53: Global Application Release Automation Market Revenue Million Forecast, by End-User Industries 2019 & 2032
- Table 54: Global Application Release Automation Market Revenue Million Forecast, by Country 2019 & 2032
- Table 55: Global Application Release Automation Market Revenue Million Forecast, by Component 2019 & 2032
- Table 56: Global Application Release Automation Market Revenue Million Forecast, by Deployment 2019 & 2032
- Table 57: Global Application Release Automation Market Revenue Million Forecast, by End-User Industries 2019 & 2032
- Table 58: Global Application Release Automation Market Revenue Million Forecast, by Country 2019 & 2032
- Table 59: Global Application Release Automation Market Revenue Million Forecast, by Component 2019 & 2032
- Table 60: Global Application Release Automation Market Revenue Million Forecast, by Deployment 2019 & 2032
- Table 61: Global Application Release Automation Market Revenue Million Forecast, by End-User Industries 2019 & 2032
- Table 62: Global Application Release Automation Market Revenue Million Forecast, by Country 2019 & 2032
- Table 63: Global Application Release Automation Market Revenue Million Forecast, by Component 2019 & 2032
- Table 64: Global Application Release Automation Market Revenue Million Forecast, by Deployment 2019 & 2032
- Table 65: Global Application Release Automation Market Revenue Million Forecast, by End-User Industries 2019 & 2032
- Table 66: Global Application Release Automation Market Revenue Million Forecast, by Country 2019 & 2032
Frequently Asked Questions
1. What is the projected Compound Annual Growth Rate (CAGR) of the Application Release Automation Market?
The projected CAGR is approximately 19.75%.
2. Which companies are prominent players in the Application Release Automation Market?
Key companies in the market include Chef Software Inc, Electric Cloud Inc, IBM Corporation, Datical Inc, Micro Focus International Plc, CollabNet Inc , CloudBees Inc, Broadcom Inc, Microsoft Corporation, BMC Software Inc, Flexagon LLC, ARCAD Software, Attunity Ltd.
3. What are the main segments of the Application Release Automation Market?
The market segments include Component, Deployment, End-User Industries.
4. Can you provide details about the market size?
The market size is estimated to be USD 4.08 Million as of 2022.
5. What are some drivers contributing to market growth?
On Increasing Demand of Faster Delivery of Software with Reduced Operational Risk; Rapid Adoption by Enterprise to Deliver Differentiated Customer Experiences and to Retain.
6. What are the notable trends driving market growth?
Cloud is Expected to Hold Significant Market Share.
7. Are there any restraints impacting market growth?
High Cost of Product and Failed Deployment of Software or Applications and Complexity in Configurations.
8. Can you provide examples of recent developments in the market?
February 2023 - Red Hat, Inc., announced the availability of the Red Hat Ansible Automation Platform on Google Cloud, providing a common and flexible IT automation solution that extends from the cloud to the data center and out to the edge without additional complexity or required skills.
9. What pricing options are available for accessing the report?
Pricing options include single-user, multi-user, and enterprise licenses priced at USD 4750, USD 5250, and USD 8750 respectively.
10. Is the market size provided in terms of value or volume?
The market size is provided in terms of value, measured in Million.
11. Are there any specific market keywords associated with the report?
Yes, the market keyword associated with the report is "Application Release Automation Market," which aids in identifying and referencing the specific market segment covered.
12. How do I determine which pricing option suits my needs best?
The pricing options vary based on user requirements and access needs. Individual users may opt for single-user licenses, while businesses requiring broader access may choose multi-user or enterprise licenses for cost-effective access to the report.
13. Are there any additional resources or data provided in the Application Release Automation Market report?
While the report offers comprehensive insights, it's advisable to review the specific contents or supplementary materials provided to ascertain if additional resources or data are available.
14. How can I stay updated on further developments or reports in the Application Release Automation Market?
To stay informed about further developments, trends, and reports in the Application Release Automation Market, consider subscribing to industry newsletters, following relevant companies and organizations, or regularly checking reputable industry news sources and publications.
Methodology
Step 1 - Identification of Relevant Samples Size from Population Database


Step 2 - Approaches for Defining Global Market Size (Value, Volume* & Price*)

Note*: In applicable scenarios
Step 3 - Data Sources
Primary Research
- Web Analytics
- Survey Reports
- Research Institute
- Latest Research Reports
- Opinion Leaders
Secondary Research
- Annual Reports
- White Paper
- Latest Press Release
- Industry Association
- Paid Database
- Investor Presentations

Step 4 - Data Triangulation
Involves using different sources of information in order to increase the validity of a study
These sources are likely to be stakeholders in a program - participants, other researchers, program staff, other community members, and so on.
Then we put all data in single framework & apply various statistical tools to find out the dynamic on the market.
During the analysis stage, feedback from the stakeholder groups would be compared to determine areas of agreement as well as areas of divergence


