
Key Insights
The Application Delivery Controller (ADC) market is experiencing robust growth, driven by the increasing adoption of cloud computing, the surge in mobile and internet traffic, and the rising demand for enhanced application security and performance. The market's Compound Annual Growth Rate (CAGR) of 9.63% from 2019 to 2024 indicates a significant expansion, projected to continue through 2033. Several factors contribute to this growth. The shift towards cloud-based deployments offers scalability and cost-effectiveness, fueling market expansion. Simultaneously, the proliferation of mobile devices and the rise of e-commerce necessitate robust ADCs to manage increasing traffic loads and ensure optimal application performance. Furthermore, the growing concern over application security vulnerabilities is driving demand for sophisticated ADC solutions equipped with advanced security features such as DDoS mitigation and web application firewalls. The market is segmented by deployment (cloud and on-premise), enterprise size (SMEs and large enterprises), and end-user vertical (BFSI, retail, IT and telecom, healthcare, and others). Cloud deployment is expected to dominate due to its inherent flexibility and scalability. Large enterprises are the primary consumers of ADCs owing to their complex application landscapes and higher security requirements. The BFSI and retail sectors are significant contributors due to their reliance on high-availability and secure applications.
Competition in the ADC market is intense, with established players like Radware, F5 Networks, and Citrix alongside emerging vendors vying for market share. The competitive landscape is characterized by ongoing innovation in areas such as AI-powered application optimization, automation, and advanced security capabilities. While the market faces some restraints, such as the complexity of ADC implementation and the need for skilled professionals, the overall growth trajectory remains positive. Future growth will likely be driven by advancements in 5G technology, the expanding adoption of microservices architecture, and the continued growth of data-intensive applications. This positive outlook positions the ADC market for continued expansion and substantial market value creation in the coming years. Analyzing regional trends shows a strong presence in North America and Europe, with Asia-Pacific poised for significant future growth due to rapid digital transformation and increasing internet penetration.
Application Delivery Controllers Market: A Comprehensive Report (2019-2033)
This comprehensive report provides a detailed analysis of the Application Delivery Controllers (ADC) market, encompassing market dynamics, growth trends, regional dominance, product landscape, key players, and future outlook. The study period covers 2019-2033, with 2025 as the base and estimated year. The report segments the market by deployment (Cloud, On-premise), enterprise size (SMEs, Large Enterprises), and end-user vertical (BFSI, Retail, IT & Telecom, Healthcare, Other). The total market size is projected to reach xx Million by 2033.
Application Delivery Controllers Market Market Dynamics & Structure
The Application Delivery Controllers market is characterized by moderate concentration, with key players like F5 Networks, Citrix, and Radware holding significant market share. However, the market is witnessing increasing competition from emerging vendors offering innovative solutions. Technological innovation, particularly in areas like AI-powered optimization and automation, is a major driver. Regulatory frameworks concerning data security and compliance influence market dynamics. The market faces competition from alternative technologies like software-defined networking (SDN) and cloud-based load balancing services.
- Market Concentration: Moderately concentrated, with top 5 players holding approximately xx% market share in 2024.
- Technological Innovation: AI, machine learning, and automation are driving advancements in ADC capabilities.
- Regulatory Frameworks: GDPR, CCPA, and other data privacy regulations impact ADC adoption and feature development.
- Competitive Substitutes: SDN and cloud-based load balancers pose a competitive threat.
- M&A Trends: Consolidation is expected to continue, with larger players acquiring smaller, specialized ADC providers. xx M&A deals were recorded between 2019 and 2024.
- End-User Demographics: Large enterprises currently dominate the market, but increasing cloud adoption amongst SMEs is fueling growth in this segment.
Application Delivery Controllers Market Growth Trends & Insights
The Application Delivery Controllers market experienced significant growth during the historical period (2019-2024), driven by the rising adoption of cloud computing, increasing demand for enhanced application performance, and the growing need for robust security measures. The market is expected to maintain a healthy CAGR of xx% during the forecast period (2025-2033). Increased adoption of digital transformation strategies across various industries, coupled with the escalating demand for secure and reliable application delivery, is anticipated to propel market expansion. Technological advancements, such as the integration of AI and machine learning into ADC solutions, are expected to further enhance efficiency and automation, supporting sustained market growth. A shift in consumer behavior towards seamless, high-performance applications also fuels the market's expansion. Market penetration in the cloud segment is anticipated to reach xx% by 2033.
Dominant Regions, Countries, or Segments in Application Delivery Controllers Market
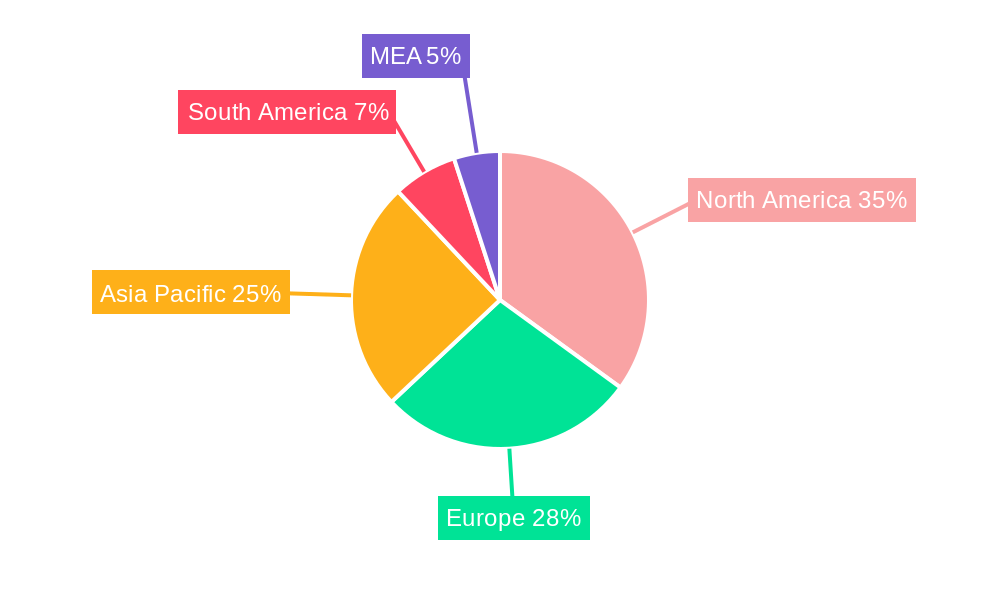
North America currently holds the largest market share due to early adoption of cloud technologies and the presence of major technology companies. However, the Asia-Pacific region is expected to witness the fastest growth rate owing to rapid digitalization and increasing investments in IT infrastructure.
By Deployment:
- Cloud: The cloud segment is the fastest-growing, driven by scalability, cost-effectiveness, and ease of management. It is projected to capture xx% of the market by 2033.
- On-premise: The on-premise segment remains significant due to security and control concerns among certain organizations.
By Enterprise Size:
- Large Enterprises: Large enterprises represent a dominant segment due to higher IT budgets and complex application deployments.
- SMEs: The SME segment is experiencing rapid growth, driven by increasing cloud adoption and the availability of cost-effective ADC solutions.
By End-user Vertical:
- BFSI: High security requirements and stringent regulatory compliance drive adoption in the BFSI sector.
- IT & Telecom: The IT & Telecom sector is a significant adopter due to the critical role of application delivery in their operations.
- Retail: The retail sector's focus on enhancing customer experience drives ADC adoption.
Application Delivery Controllers Market Product Landscape
ADC solutions are evolving beyond basic load balancing, integrating advanced features like application security, web application firewalls (WAFs), and intelligent traffic management. These advancements enhance application performance, security, and scalability. Key differentiators include AI-powered optimization, automated provisioning, and seamless integration with cloud platforms.
Key Drivers, Barriers & Challenges in Application Delivery Controllers Market
Key Drivers:
- Increasing cloud adoption
- Growing demand for enhanced application performance and security
- Rising adoption of mobile and web applications
- Need for improved application availability and scalability
Challenges and Restraints:
- High initial investment costs for enterprise-grade solutions
- Complexity of implementation and management
- Competition from alternative technologies like SDN
- Security concerns and potential vulnerabilities in ADC solutions. This impacts approximately xx% of organizations considering ADC deployment based on recent surveys.
Emerging Opportunities in Application Delivery Controllers Market
- Expansion into emerging markets with increasing internet penetration
- Integration of ADC with edge computing technologies
- Development of specialized ADC solutions for specific industry verticals (e.g., IoT, 5G)
- Rise of serverless computing and its impact on ADC requirements.
Growth Accelerators in the Application Delivery Controllers Market Industry
Strategic partnerships between ADC vendors and cloud providers, along with technological advancements in areas such as AI-driven automation and security, are poised to fuel long-term growth. The expansion of 5G networks and the growth of IoT applications are further creating compelling opportunities.
Key Players Shaping the Application Delivery Controllers Market Market
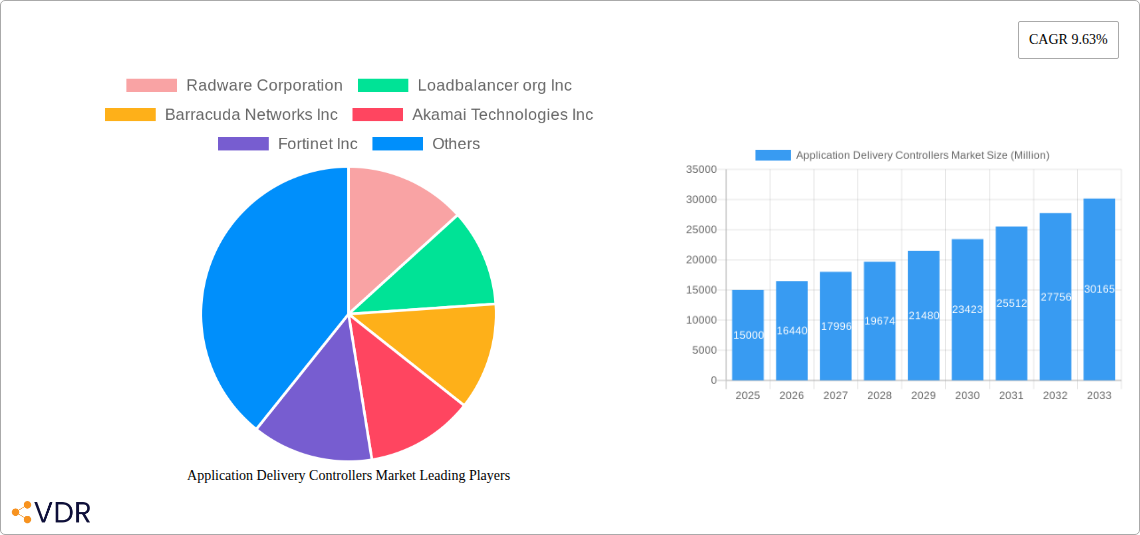
- Radware Corporation
- Loadbalancer.org Inc
- Barracuda Networks Inc
- Akamai Technologies Inc
- Fortinet Inc
- F5 Networks Inc
- Piolink Inc
- Juniper Networks Inc
- Kemp Technologies Inc
- A10 Networks Inc
- Array Networks Inc
- Sangfor Technologies Inc
- Citrix Systems Inc
- HAProxy Technologies LLC
Notable Milestones in Application Delivery Controllers Market Sector
- June 2023: Fortinet announces 11 new MSSPs adopting Fortinet Secure SD-WAN, expanding its market reach and reinforcing its security-focused ADC offerings.
- February 2023: Juniper Networks expands collaboration with IBM to integrate network automation capabilities with its RAN optimization and O-RAN technology, enhancing its ADC solutions for CSPs.
In-Depth Application Delivery Controllers Market Market Outlook
The Application Delivery Controllers market is poised for continued growth, driven by the increasing adoption of cloud-native architectures, the proliferation of IoT devices, and the rising demand for secure and high-performing applications. Strategic partnerships, technological advancements, and expansion into untapped markets will further contribute to the market's potential. The integration of AI and machine learning will continue to improve ADC efficiency and effectiveness, creating new opportunities for vendors.
Application Delivery Controllers Market Segmentation
-
1. Deployment
- 1.1. Cloud
- 1.2. On-premise
-
2. Enterprise Size
- 2.1. Small and Medium Enterprises (SMEs)
- 2.2. Large Enterprises
-
3. End-user Vertical
- 3.1. BFSI
- 3.2. Retail
- 3.3. IT and Telecom
- 3.4. Healthcare
- 3.5. Other End-user Verticals
Application Delivery Controllers Market Segmentation By Geography
- 1. North America
- 2. Europe
- 3. Asia Pacific
- 4. Rest of the World
Application Delivery Controllers Market REPORT HIGHLIGHTS
| Aspects | Details |
|---|---|
| Study Period | 2019-2033 |
| Base Year | 2024 |
| Estimated Year | 2025 |
| Forecast Period | 2025-2033 |
| Historical Period | 2019-2024 |
| Growth Rate | CAGR of 9.63% from 2019-2033 |
| Segmentation |
|
Table of Contents
- 1. Introduction
- 1.1. Research Scope
- 1.2. Market Segmentation
- 1.3. Research Methodology
- 1.4. Definitions and Assumptions
- 2. Executive Summary
- 2.1. Introduction
- 3. Market Dynamics
- 3.1. Introduction
- 3.2. Market Drivers
- 3.2.1. Rising Demand for Reliable Application Performance; Increasing Cyberattacks
- 3.3. Market Restrains
- 3.3.1. Increasing Network Complexity; Management Challenges and Higher Costs of ADCs
- 3.4. Market Trends
- 3.4.1. BFSI By End-user Vertical Segment is Expected to Hold Significant Market Share
- 4. Market Factor Analysis
- 4.1. Porters Five Forces
- 4.2. Supply/Value Chain
- 4.3. PESTEL analysis
- 4.4. Market Entropy
- 4.5. Patent/Trademark Analysis
- 5. Global Application Delivery Controllers Market Analysis, Insights and Forecast, 2019-2031
- 5.1. Market Analysis, Insights and Forecast - by Deployment
- 5.1.1. Cloud
- 5.1.2. On-premise
- 5.2. Market Analysis, Insights and Forecast - by Enterprise Size
- 5.2.1. Small and Medium Enterprises (SMEs)
- 5.2.2. Large Enterprises
- 5.3. Market Analysis, Insights and Forecast - by End-user Vertical
- 5.3.1. BFSI
- 5.3.2. Retail
- 5.3.3. IT and Telecom
- 5.3.4. Healthcare
- 5.3.5. Other End-user Verticals
- 5.4. Market Analysis, Insights and Forecast - by Region
- 5.4.1. North America
- 5.4.2. Europe
- 5.4.3. Asia Pacific
- 5.4.4. Rest of the World
- 5.1. Market Analysis, Insights and Forecast - by Deployment
- 6. North America Application Delivery Controllers Market Analysis, Insights and Forecast, 2019-2031
- 6.1. Market Analysis, Insights and Forecast - by Deployment
- 6.1.1. Cloud
- 6.1.2. On-premise
- 6.2. Market Analysis, Insights and Forecast - by Enterprise Size
- 6.2.1. Small and Medium Enterprises (SMEs)
- 6.2.2. Large Enterprises
- 6.3. Market Analysis, Insights and Forecast - by End-user Vertical
- 6.3.1. BFSI
- 6.3.2. Retail
- 6.3.3. IT and Telecom
- 6.3.4. Healthcare
- 6.3.5. Other End-user Verticals
- 6.1. Market Analysis, Insights and Forecast - by Deployment
- 7. Europe Application Delivery Controllers Market Analysis, Insights and Forecast, 2019-2031
- 7.1. Market Analysis, Insights and Forecast - by Deployment
- 7.1.1. Cloud
- 7.1.2. On-premise
- 7.2. Market Analysis, Insights and Forecast - by Enterprise Size
- 7.2.1. Small and Medium Enterprises (SMEs)
- 7.2.2. Large Enterprises
- 7.3. Market Analysis, Insights and Forecast - by End-user Vertical
- 7.3.1. BFSI
- 7.3.2. Retail
- 7.3.3. IT and Telecom
- 7.3.4. Healthcare
- 7.3.5. Other End-user Verticals
- 7.1. Market Analysis, Insights and Forecast - by Deployment
- 8. Asia Pacific Application Delivery Controllers Market Analysis, Insights and Forecast, 2019-2031
- 8.1. Market Analysis, Insights and Forecast - by Deployment
- 8.1.1. Cloud
- 8.1.2. On-premise
- 8.2. Market Analysis, Insights and Forecast - by Enterprise Size
- 8.2.1. Small and Medium Enterprises (SMEs)
- 8.2.2. Large Enterprises
- 8.3. Market Analysis, Insights and Forecast - by End-user Vertical
- 8.3.1. BFSI
- 8.3.2. Retail
- 8.3.3. IT and Telecom
- 8.3.4. Healthcare
- 8.3.5. Other End-user Verticals
- 8.1. Market Analysis, Insights and Forecast - by Deployment
- 9. Rest of the World Application Delivery Controllers Market Analysis, Insights and Forecast, 2019-2031
- 9.1. Market Analysis, Insights and Forecast - by Deployment
- 9.1.1. Cloud
- 9.1.2. On-premise
- 9.2. Market Analysis, Insights and Forecast - by Enterprise Size
- 9.2.1. Small and Medium Enterprises (SMEs)
- 9.2.2. Large Enterprises
- 9.3. Market Analysis, Insights and Forecast - by End-user Vertical
- 9.3.1. BFSI
- 9.3.2. Retail
- 9.3.3. IT and Telecom
- 9.3.4. Healthcare
- 9.3.5. Other End-user Verticals
- 9.1. Market Analysis, Insights and Forecast - by Deployment
- 10. North America Application Delivery Controllers Market Analysis, Insights and Forecast, 2019-2031
- 10.1. Market Analysis, Insights and Forecast - By Country/Sub-region
- 10.1.1 United States
- 10.1.2 Canada
- 10.1.3 Mexico
- 11. Europe Application Delivery Controllers Market Analysis, Insights and Forecast, 2019-2031
- 11.1. Market Analysis, Insights and Forecast - By Country/Sub-region
- 11.1.1 Germany
- 11.1.2 United Kingdom
- 11.1.3 France
- 11.1.4 Spain
- 11.1.5 Italy
- 11.1.6 Spain
- 11.1.7 Belgium
- 11.1.8 Netherland
- 11.1.9 Nordics
- 11.1.10 Rest of Europe
- 12. Asia Pacific Application Delivery Controllers Market Analysis, Insights and Forecast, 2019-2031
- 12.1. Market Analysis, Insights and Forecast - By Country/Sub-region
- 12.1.1 China
- 12.1.2 Japan
- 12.1.3 India
- 12.1.4 South Korea
- 12.1.5 Southeast Asia
- 12.1.6 Australia
- 12.1.7 Indonesia
- 12.1.8 Phillipes
- 12.1.9 Singapore
- 12.1.10 Thailandc
- 12.1.11 Rest of Asia Pacific
- 13. South America Application Delivery Controllers Market Analysis, Insights and Forecast, 2019-2031
- 13.1. Market Analysis, Insights and Forecast - By Country/Sub-region
- 13.1.1 Brazil
- 13.1.2 Argentina
- 13.1.3 Peru
- 13.1.4 Chile
- 13.1.5 Colombia
- 13.1.6 Ecuador
- 13.1.7 Venezuela
- 13.1.8 Rest of South America
- 14. North America Application Delivery Controllers Market Analysis, Insights and Forecast, 2019-2031
- 14.1. Market Analysis, Insights and Forecast - By Country/Sub-region
- 14.1.1 United States
- 14.1.2 Canada
- 14.1.3 Mexico
- 15. MEA Application Delivery Controllers Market Analysis, Insights and Forecast, 2019-2031
- 15.1. Market Analysis, Insights and Forecast - By Country/Sub-region
- 15.1.1 United Arab Emirates
- 15.1.2 Saudi Arabia
- 15.1.3 South Africa
- 15.1.4 Rest of Middle East and Africa
- 16. Competitive Analysis
- 16.1. Global Market Share Analysis 2024
- 16.2. Company Profiles
- 16.2.1 Radware Corporation
- 16.2.1.1. Overview
- 16.2.1.2. Products
- 16.2.1.3. SWOT Analysis
- 16.2.1.4. Recent Developments
- 16.2.1.5. Financials (Based on Availability)
- 16.2.2 Loadbalancer org Inc
- 16.2.2.1. Overview
- 16.2.2.2. Products
- 16.2.2.3. SWOT Analysis
- 16.2.2.4. Recent Developments
- 16.2.2.5. Financials (Based on Availability)
- 16.2.3 Barracuda Networks Inc
- 16.2.3.1. Overview
- 16.2.3.2. Products
- 16.2.3.3. SWOT Analysis
- 16.2.3.4. Recent Developments
- 16.2.3.5. Financials (Based on Availability)
- 16.2.4 Akamai Technologies Inc
- 16.2.4.1. Overview
- 16.2.4.2. Products
- 16.2.4.3. SWOT Analysis
- 16.2.4.4. Recent Developments
- 16.2.4.5. Financials (Based on Availability)
- 16.2.5 Fortinet Inc
- 16.2.5.1. Overview
- 16.2.5.2. Products
- 16.2.5.3. SWOT Analysis
- 16.2.5.4. Recent Developments
- 16.2.5.5. Financials (Based on Availability)
- 16.2.6 F5 Networks Inc
- 16.2.6.1. Overview
- 16.2.6.2. Products
- 16.2.6.3. SWOT Analysis
- 16.2.6.4. Recent Developments
- 16.2.6.5. Financials (Based on Availability)
- 16.2.7 Piolink Inc
- 16.2.7.1. Overview
- 16.2.7.2. Products
- 16.2.7.3. SWOT Analysis
- 16.2.7.4. Recent Developments
- 16.2.7.5. Financials (Based on Availability)
- 16.2.8 Juniper Networks Inc
- 16.2.8.1. Overview
- 16.2.8.2. Products
- 16.2.8.3. SWOT Analysis
- 16.2.8.4. Recent Developments
- 16.2.8.5. Financials (Based on Availability)
- 16.2.9 Kemp Technologies Inc
- 16.2.9.1. Overview
- 16.2.9.2. Products
- 16.2.9.3. SWOT Analysis
- 16.2.9.4. Recent Developments
- 16.2.9.5. Financials (Based on Availability)
- 16.2.10 A10 Networks Inc
- 16.2.10.1. Overview
- 16.2.10.2. Products
- 16.2.10.3. SWOT Analysis
- 16.2.10.4. Recent Developments
- 16.2.10.5. Financials (Based on Availability)
- 16.2.11 Array Networks Inc
- 16.2.11.1. Overview
- 16.2.11.2. Products
- 16.2.11.3. SWOT Analysis
- 16.2.11.4. Recent Developments
- 16.2.11.5. Financials (Based on Availability)
- 16.2.12 Sangfor Technologies Inc
- 16.2.12.1. Overview
- 16.2.12.2. Products
- 16.2.12.3. SWOT Analysis
- 16.2.12.4. Recent Developments
- 16.2.12.5. Financials (Based on Availability)
- 16.2.13 Citrix Systems Inc
- 16.2.13.1. Overview
- 16.2.13.2. Products
- 16.2.13.3. SWOT Analysis
- 16.2.13.4. Recent Developments
- 16.2.13.5. Financials (Based on Availability)
- 16.2.14 HAProxy Technologies LLC
- 16.2.14.1. Overview
- 16.2.14.2. Products
- 16.2.14.3. SWOT Analysis
- 16.2.14.4. Recent Developments
- 16.2.14.5. Financials (Based on Availability)
- 16.2.1 Radware Corporation
List of Figures
- Figure 1: Global Application Delivery Controllers Market Revenue Breakdown (Million, %) by Region 2024 & 2032
- Figure 2: North America Application Delivery Controllers Market Revenue (Million), by Country 2024 & 2032
- Figure 3: North America Application Delivery Controllers Market Revenue Share (%), by Country 2024 & 2032
- Figure 4: Europe Application Delivery Controllers Market Revenue (Million), by Country 2024 & 2032
- Figure 5: Europe Application Delivery Controllers Market Revenue Share (%), by Country 2024 & 2032
- Figure 6: Asia Pacific Application Delivery Controllers Market Revenue (Million), by Country 2024 & 2032
- Figure 7: Asia Pacific Application Delivery Controllers Market Revenue Share (%), by Country 2024 & 2032
- Figure 8: South America Application Delivery Controllers Market Revenue (Million), by Country 2024 & 2032
- Figure 9: South America Application Delivery Controllers Market Revenue Share (%), by Country 2024 & 2032
- Figure 10: North America Application Delivery Controllers Market Revenue (Million), by Country 2024 & 2032
- Figure 11: North America Application Delivery Controllers Market Revenue Share (%), by Country 2024 & 2032
- Figure 12: MEA Application Delivery Controllers Market Revenue (Million), by Country 2024 & 2032
- Figure 13: MEA Application Delivery Controllers Market Revenue Share (%), by Country 2024 & 2032
- Figure 14: North America Application Delivery Controllers Market Revenue (Million), by Deployment 2024 & 2032
- Figure 15: North America Application Delivery Controllers Market Revenue Share (%), by Deployment 2024 & 2032
- Figure 16: North America Application Delivery Controllers Market Revenue (Million), by Enterprise Size 2024 & 2032
- Figure 17: North America Application Delivery Controllers Market Revenue Share (%), by Enterprise Size 2024 & 2032
- Figure 18: North America Application Delivery Controllers Market Revenue (Million), by End-user Vertical 2024 & 2032
- Figure 19: North America Application Delivery Controllers Market Revenue Share (%), by End-user Vertical 2024 & 2032
- Figure 20: North America Application Delivery Controllers Market Revenue (Million), by Country 2024 & 2032
- Figure 21: North America Application Delivery Controllers Market Revenue Share (%), by Country 2024 & 2032
- Figure 22: Europe Application Delivery Controllers Market Revenue (Million), by Deployment 2024 & 2032
- Figure 23: Europe Application Delivery Controllers Market Revenue Share (%), by Deployment 2024 & 2032
- Figure 24: Europe Application Delivery Controllers Market Revenue (Million), by Enterprise Size 2024 & 2032
- Figure 25: Europe Application Delivery Controllers Market Revenue Share (%), by Enterprise Size 2024 & 2032
- Figure 26: Europe Application Delivery Controllers Market Revenue (Million), by End-user Vertical 2024 & 2032
- Figure 27: Europe Application Delivery Controllers Market Revenue Share (%), by End-user Vertical 2024 & 2032
- Figure 28: Europe Application Delivery Controllers Market Revenue (Million), by Country 2024 & 2032
- Figure 29: Europe Application Delivery Controllers Market Revenue Share (%), by Country 2024 & 2032
- Figure 30: Asia Pacific Application Delivery Controllers Market Revenue (Million), by Deployment 2024 & 2032
- Figure 31: Asia Pacific Application Delivery Controllers Market Revenue Share (%), by Deployment 2024 & 2032
- Figure 32: Asia Pacific Application Delivery Controllers Market Revenue (Million), by Enterprise Size 2024 & 2032
- Figure 33: Asia Pacific Application Delivery Controllers Market Revenue Share (%), by Enterprise Size 2024 & 2032
- Figure 34: Asia Pacific Application Delivery Controllers Market Revenue (Million), by End-user Vertical 2024 & 2032
- Figure 35: Asia Pacific Application Delivery Controllers Market Revenue Share (%), by End-user Vertical 2024 & 2032
- Figure 36: Asia Pacific Application Delivery Controllers Market Revenue (Million), by Country 2024 & 2032
- Figure 37: Asia Pacific Application Delivery Controllers Market Revenue Share (%), by Country 2024 & 2032
- Figure 38: Rest of the World Application Delivery Controllers Market Revenue (Million), by Deployment 2024 & 2032
- Figure 39: Rest of the World Application Delivery Controllers Market Revenue Share (%), by Deployment 2024 & 2032
- Figure 40: Rest of the World Application Delivery Controllers Market Revenue (Million), by Enterprise Size 2024 & 2032
- Figure 41: Rest of the World Application Delivery Controllers Market Revenue Share (%), by Enterprise Size 2024 & 2032
- Figure 42: Rest of the World Application Delivery Controllers Market Revenue (Million), by End-user Vertical 2024 & 2032
- Figure 43: Rest of the World Application Delivery Controllers Market Revenue Share (%), by End-user Vertical 2024 & 2032
- Figure 44: Rest of the World Application Delivery Controllers Market Revenue (Million), by Country 2024 & 2032
- Figure 45: Rest of the World Application Delivery Controllers Market Revenue Share (%), by Country 2024 & 2032
List of Tables
- Table 1: Global Application Delivery Controllers Market Revenue Million Forecast, by Region 2019 & 2032
- Table 2: Global Application Delivery Controllers Market Revenue Million Forecast, by Deployment 2019 & 2032
- Table 3: Global Application Delivery Controllers Market Revenue Million Forecast, by Enterprise Size 2019 & 2032
- Table 4: Global Application Delivery Controllers Market Revenue Million Forecast, by End-user Vertical 2019 & 2032
- Table 5: Global Application Delivery Controllers Market Revenue Million Forecast, by Region 2019 & 2032
- Table 6: Global Application Delivery Controllers Market Revenue Million Forecast, by Country 2019 & 2032
- Table 7: United States Application Delivery Controllers Market Revenue (Million) Forecast, by Application 2019 & 2032
- Table 8: Canada Application Delivery Controllers Market Revenue (Million) Forecast, by Application 2019 & 2032
- Table 9: Mexico Application Delivery Controllers Market Revenue (Million) Forecast, by Application 2019 & 2032
- Table 10: Global Application Delivery Controllers Market Revenue Million Forecast, by Country 2019 & 2032
- Table 11: Germany Application Delivery Controllers Market Revenue (Million) Forecast, by Application 2019 & 2032
- Table 12: United Kingdom Application Delivery Controllers Market Revenue (Million) Forecast, by Application 2019 & 2032
- Table 13: France Application Delivery Controllers Market Revenue (Million) Forecast, by Application 2019 & 2032
- Table 14: Spain Application Delivery Controllers Market Revenue (Million) Forecast, by Application 2019 & 2032
- Table 15: Italy Application Delivery Controllers Market Revenue (Million) Forecast, by Application 2019 & 2032
- Table 16: Spain Application Delivery Controllers Market Revenue (Million) Forecast, by Application 2019 & 2032
- Table 17: Belgium Application Delivery Controllers Market Revenue (Million) Forecast, by Application 2019 & 2032
- Table 18: Netherland Application Delivery Controllers Market Revenue (Million) Forecast, by Application 2019 & 2032
- Table 19: Nordics Application Delivery Controllers Market Revenue (Million) Forecast, by Application 2019 & 2032
- Table 20: Rest of Europe Application Delivery Controllers Market Revenue (Million) Forecast, by Application 2019 & 2032
- Table 21: Global Application Delivery Controllers Market Revenue Million Forecast, by Country 2019 & 2032
- Table 22: China Application Delivery Controllers Market Revenue (Million) Forecast, by Application 2019 & 2032
- Table 23: Japan Application Delivery Controllers Market Revenue (Million) Forecast, by Application 2019 & 2032
- Table 24: India Application Delivery Controllers Market Revenue (Million) Forecast, by Application 2019 & 2032
- Table 25: South Korea Application Delivery Controllers Market Revenue (Million) Forecast, by Application 2019 & 2032
- Table 26: Southeast Asia Application Delivery Controllers Market Revenue (Million) Forecast, by Application 2019 & 2032
- Table 27: Australia Application Delivery Controllers Market Revenue (Million) Forecast, by Application 2019 & 2032
- Table 28: Indonesia Application Delivery Controllers Market Revenue (Million) Forecast, by Application 2019 & 2032
- Table 29: Phillipes Application Delivery Controllers Market Revenue (Million) Forecast, by Application 2019 & 2032
- Table 30: Singapore Application Delivery Controllers Market Revenue (Million) Forecast, by Application 2019 & 2032
- Table 31: Thailandc Application Delivery Controllers Market Revenue (Million) Forecast, by Application 2019 & 2032
- Table 32: Rest of Asia Pacific Application Delivery Controllers Market Revenue (Million) Forecast, by Application 2019 & 2032
- Table 33: Global Application Delivery Controllers Market Revenue Million Forecast, by Country 2019 & 2032
- Table 34: Brazil Application Delivery Controllers Market Revenue (Million) Forecast, by Application 2019 & 2032
- Table 35: Argentina Application Delivery Controllers Market Revenue (Million) Forecast, by Application 2019 & 2032
- Table 36: Peru Application Delivery Controllers Market Revenue (Million) Forecast, by Application 2019 & 2032
- Table 37: Chile Application Delivery Controllers Market Revenue (Million) Forecast, by Application 2019 & 2032
- Table 38: Colombia Application Delivery Controllers Market Revenue (Million) Forecast, by Application 2019 & 2032
- Table 39: Ecuador Application Delivery Controllers Market Revenue (Million) Forecast, by Application 2019 & 2032
- Table 40: Venezuela Application Delivery Controllers Market Revenue (Million) Forecast, by Application 2019 & 2032
- Table 41: Rest of South America Application Delivery Controllers Market Revenue (Million) Forecast, by Application 2019 & 2032
- Table 42: Global Application Delivery Controllers Market Revenue Million Forecast, by Country 2019 & 2032
- Table 43: United States Application Delivery Controllers Market Revenue (Million) Forecast, by Application 2019 & 2032
- Table 44: Canada Application Delivery Controllers Market Revenue (Million) Forecast, by Application 2019 & 2032
- Table 45: Mexico Application Delivery Controllers Market Revenue (Million) Forecast, by Application 2019 & 2032
- Table 46: Global Application Delivery Controllers Market Revenue Million Forecast, by Country 2019 & 2032
- Table 47: United Arab Emirates Application Delivery Controllers Market Revenue (Million) Forecast, by Application 2019 & 2032
- Table 48: Saudi Arabia Application Delivery Controllers Market Revenue (Million) Forecast, by Application 2019 & 2032
- Table 49: South Africa Application Delivery Controllers Market Revenue (Million) Forecast, by Application 2019 & 2032
- Table 50: Rest of Middle East and Africa Application Delivery Controllers Market Revenue (Million) Forecast, by Application 2019 & 2032
- Table 51: Global Application Delivery Controllers Market Revenue Million Forecast, by Deployment 2019 & 2032
- Table 52: Global Application Delivery Controllers Market Revenue Million Forecast, by Enterprise Size 2019 & 2032
- Table 53: Global Application Delivery Controllers Market Revenue Million Forecast, by End-user Vertical 2019 & 2032
- Table 54: Global Application Delivery Controllers Market Revenue Million Forecast, by Country 2019 & 2032
- Table 55: Global Application Delivery Controllers Market Revenue Million Forecast, by Deployment 2019 & 2032
- Table 56: Global Application Delivery Controllers Market Revenue Million Forecast, by Enterprise Size 2019 & 2032
- Table 57: Global Application Delivery Controllers Market Revenue Million Forecast, by End-user Vertical 2019 & 2032
- Table 58: Global Application Delivery Controllers Market Revenue Million Forecast, by Country 2019 & 2032
- Table 59: Global Application Delivery Controllers Market Revenue Million Forecast, by Deployment 2019 & 2032
- Table 60: Global Application Delivery Controllers Market Revenue Million Forecast, by Enterprise Size 2019 & 2032
- Table 61: Global Application Delivery Controllers Market Revenue Million Forecast, by End-user Vertical 2019 & 2032
- Table 62: Global Application Delivery Controllers Market Revenue Million Forecast, by Country 2019 & 2032
- Table 63: Global Application Delivery Controllers Market Revenue Million Forecast, by Deployment 2019 & 2032
- Table 64: Global Application Delivery Controllers Market Revenue Million Forecast, by Enterprise Size 2019 & 2032
- Table 65: Global Application Delivery Controllers Market Revenue Million Forecast, by End-user Vertical 2019 & 2032
- Table 66: Global Application Delivery Controllers Market Revenue Million Forecast, by Country 2019 & 2032
Frequently Asked Questions
1. What is the projected Compound Annual Growth Rate (CAGR) of the Application Delivery Controllers Market?
The projected CAGR is approximately 9.63%.
2. Which companies are prominent players in the Application Delivery Controllers Market?
Key companies in the market include Radware Corporation, Loadbalancer org Inc, Barracuda Networks Inc, Akamai Technologies Inc, Fortinet Inc, F5 Networks Inc, Piolink Inc, Juniper Networks Inc, Kemp Technologies Inc, A10 Networks Inc, Array Networks Inc, Sangfor Technologies Inc, Citrix Systems Inc, HAProxy Technologies LLC.
3. What are the main segments of the Application Delivery Controllers Market?
The market segments include Deployment, Enterprise Size, End-user Vertical.
4. Can you provide details about the market size?
The market size is estimated to be USD XX Million as of 2022.
5. What are some drivers contributing to market growth?
Rising Demand for Reliable Application Performance; Increasing Cyberattacks.
6. What are the notable trends driving market growth?
BFSI By End-user Vertical Segment is Expected to Hold Significant Market Share.
7. Are there any restraints impacting market growth?
Increasing Network Complexity; Management Challenges and Higher Costs of ADCs.
8. Can you provide examples of recent developments in the market?
June 2023: Fortinet, one of the global cybersecurity leaders driving the convergence of networking and security, announced that 11 new managed security service providers (MSSPs) have adopted Fortinet Secure SD-WAN to assist business outcomes and customer experiences. Kyndryl; 11:11 Systems; Claro Empresas; Globe Business; InfiniVAN, Inc.; KT Corporation; Neurosoft S.A.; Sify Technologies; SPTel; solutions by STC; and Tata Teleservices join a growing list of service providers across the globe utilizing Fortinet Secure SD-WAN as the foundation for new and differentiated connectivity services without compromising on security.
9. What pricing options are available for accessing the report?
Pricing options include single-user, multi-user, and enterprise licenses priced at USD 4750, USD 5250, and USD 8750 respectively.
10. Is the market size provided in terms of value or volume?
The market size is provided in terms of value, measured in Million.
11. Are there any specific market keywords associated with the report?
Yes, the market keyword associated with the report is "Application Delivery Controllers Market," which aids in identifying and referencing the specific market segment covered.
12. How do I determine which pricing option suits my needs best?
The pricing options vary based on user requirements and access needs. Individual users may opt for single-user licenses, while businesses requiring broader access may choose multi-user or enterprise licenses for cost-effective access to the report.
13. Are there any additional resources or data provided in the Application Delivery Controllers Market report?
While the report offers comprehensive insights, it's advisable to review the specific contents or supplementary materials provided to ascertain if additional resources or data are available.
14. How can I stay updated on further developments or reports in the Application Delivery Controllers Market?
To stay informed about further developments, trends, and reports in the Application Delivery Controllers Market, consider subscribing to industry newsletters, following relevant companies and organizations, or regularly checking reputable industry news sources and publications.
Methodology
Step 1 - Identification of Relevant Samples Size from Population Database


Step 2 - Approaches for Defining Global Market Size (Value, Volume* & Price*)

Note*: In applicable scenarios
Step 3 - Data Sources
Primary Research
- Web Analytics
- Survey Reports
- Research Institute
- Latest Research Reports
- Opinion Leaders
Secondary Research
- Annual Reports
- White Paper
- Latest Press Release
- Industry Association
- Paid Database
- Investor Presentations

Step 4 - Data Triangulation
Involves using different sources of information in order to increase the validity of a study
These sources are likely to be stakeholders in a program - participants, other researchers, program staff, other community members, and so on.
Then we put all data in single framework & apply various statistical tools to find out the dynamic on the market.
During the analysis stage, feedback from the stakeholder groups would be compared to determine areas of agreement as well as areas of divergence


