
Key Insights
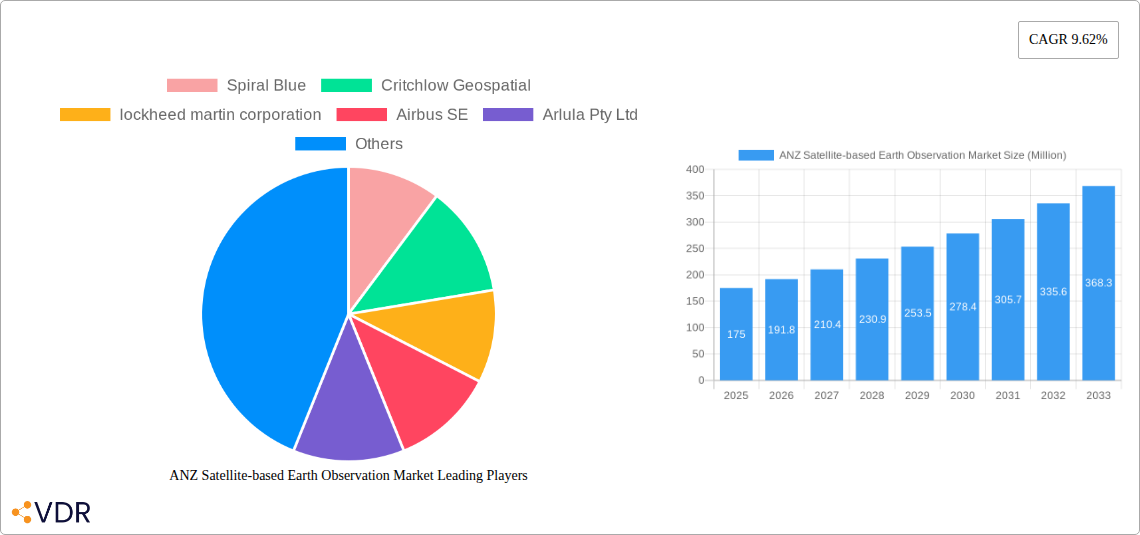
The Australian and New Zealand (ANZ) satellite-based Earth observation market is experiencing robust growth, driven by increasing demand across diverse sectors. The market's Compound Annual Growth Rate (CAGR) of 9.62% from 2019 to 2024 indicates a significant upward trajectory. This expansion is fueled by several key factors. Firstly, the rising adoption of precision agriculture techniques necessitates high-resolution satellite imagery for optimized crop management, yield prediction, and resource allocation. Secondly, the growing importance of infrastructure development and urban planning is stimulating the demand for geospatial data for effective project management and risk assessment. Furthermore, the escalating need for climate change monitoring and mitigation efforts drives the utilization of satellite data for environmental analysis and disaster preparedness. The market is segmented by data type (Earth observation data and value-added services), satellite orbit (Low Earth Orbit, Medium Earth Orbit, Geostationary Orbit), and end-use (urban development, agriculture, climate services, energy, infrastructure, and others). While specific market size figures for ANZ are not provided, based on global trends and the region's strong economic growth and technological adoption, a reasonable estimation for the ANZ market size in 2025 would be in the range of $150-200 million. This is a conservative estimate considering the high growth rate and the increasing investment in space technology within the region.
The ANZ market’s growth is further propelled by the presence of established players like Geoscience Australia, along with innovative startups such as Spiral Blue and Arlula Pty Ltd, fostering competition and innovation. Government initiatives promoting technological advancements in the space sector further enhance the market's potential. However, factors such as high initial investment costs associated with satellite technology and the need for specialized expertise can act as restraints. The future prospects for the ANZ satellite-based Earth observation market remain exceptionally positive, with continued growth expected throughout the forecast period (2025-2033), primarily driven by the increasing adoption of advanced analytics and AI-powered solutions for interpreting satellite data, leading to more efficient decision-making across various sectors. The market will likely see further consolidation and collaborations between established companies and emerging technology providers, creating a dynamic and competitive landscape.
ANZ Satellite-based Earth Observation Market: A Comprehensive Report (2019-2033)
This comprehensive report provides a detailed analysis of the Australia and New Zealand (ANZ) satellite-based Earth observation market, encompassing market dynamics, growth trends, key players, and future outlook. The study period covers 2019-2033, with 2025 as the base and estimated year. This report is crucial for businesses, investors, and policymakers seeking to understand and capitalize on opportunities within this rapidly evolving sector. The market is segmented by Type (Earth Observation Data, Value Added Services), Satellite Orbit (Low Earth Orbit, Medium Earth Orbit, Geostationary Orbit), and End-use (Urban Development and Cultural Heritage, Agriculture, Climate Services, Energy and Raw Materials, Infrastructure, Others). The total market size is projected to reach xx Million by 2033.
ANZ Satellite-based Earth Observation Market Market Dynamics & Structure
This section analyzes the ANZ satellite-based Earth observation market's structure, encompassing market concentration, technological innovation, regulatory frameworks, competitive substitutes, end-user demographics, and M&A activities. The market exhibits a moderately concentrated structure with a few major players and numerous smaller niche operators.
- Market Concentration: The top 5 players hold approximately xx% of the market share in 2025, with a projected increase to xx% by 2033.
- Technological Innovation: Advancements in sensor technology, high-resolution imagery, and AI-driven analytics are driving market growth. However, high initial investment costs and data processing complexities present innovation barriers.
- Regulatory Framework: Government initiatives supporting the space industry and open data policies are fostering market expansion. However, regulatory complexities surrounding data ownership and security remain a challenge.
- Competitive Substitutes: Aerial photography and traditional surveying methods compete with satellite-based solutions, but satellite-based solutions offer advantages in terms of coverage, efficiency, and data availability.
- End-user Demographics: Key end-users include government agencies, research institutions, agricultural businesses, and infrastructure companies. The market is witnessing increasing adoption by small and medium enterprises (SMEs) due to improving data accessibility and affordability.
- M&A Trends: The past five years have seen xx M&A deals in the ANZ satellite-based Earth observation market, primarily focused on consolidating data providers and technology companies. This trend is expected to continue, driven by a need for enhanced data processing capabilities and wider market reach.
ANZ Satellite-based Earth Observation Market Growth Trends & Insights
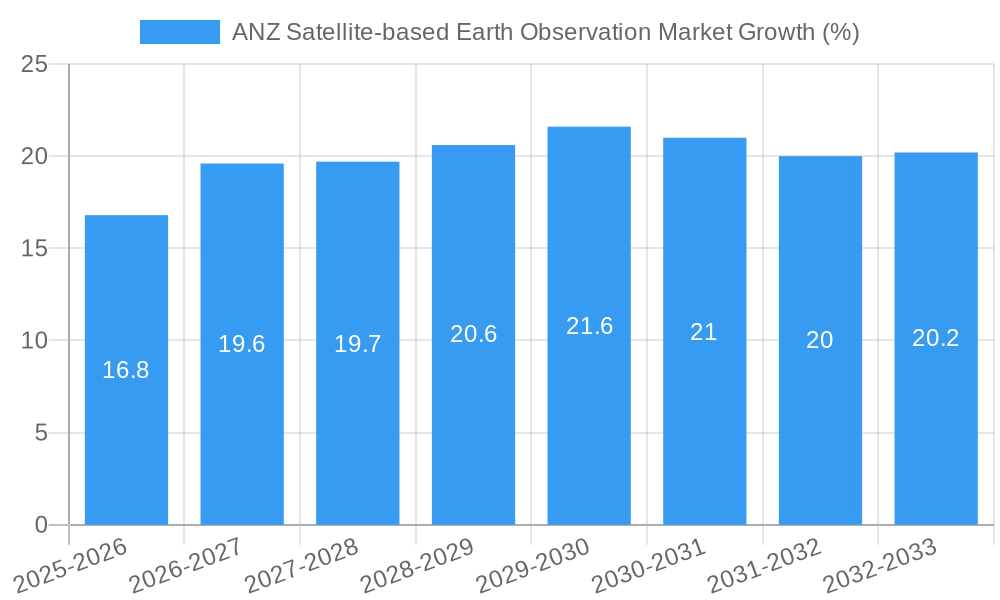
The ANZ satellite-based Earth observation market is experiencing robust growth, driven by increasing demand for high-resolution imagery and advanced analytics across various sectors. The market size, valued at xx Million in 2025, is projected to reach xx Million by 2033, exhibiting a CAGR of xx% during the forecast period (2025-2033). This growth is fueled by several factors, including rising government investments in space infrastructure, increased adoption of cloud-based platforms for data processing and analysis, and the growing need for precise and timely data across various industries. Market penetration is increasing rapidly, especially in sectors such as agriculture, urban planning, and environmental monitoring. Technological advancements, such as the deployment of constellations of small satellites and the development of AI-powered analytics tools, are significantly contributing to this growth. Furthermore, consumer behavior is shifting towards data-driven decision-making, which further boosts the demand for Earth observation data.
Dominant Regions, Countries, or Segments in ANZ Satellite-based Earth Observation Market
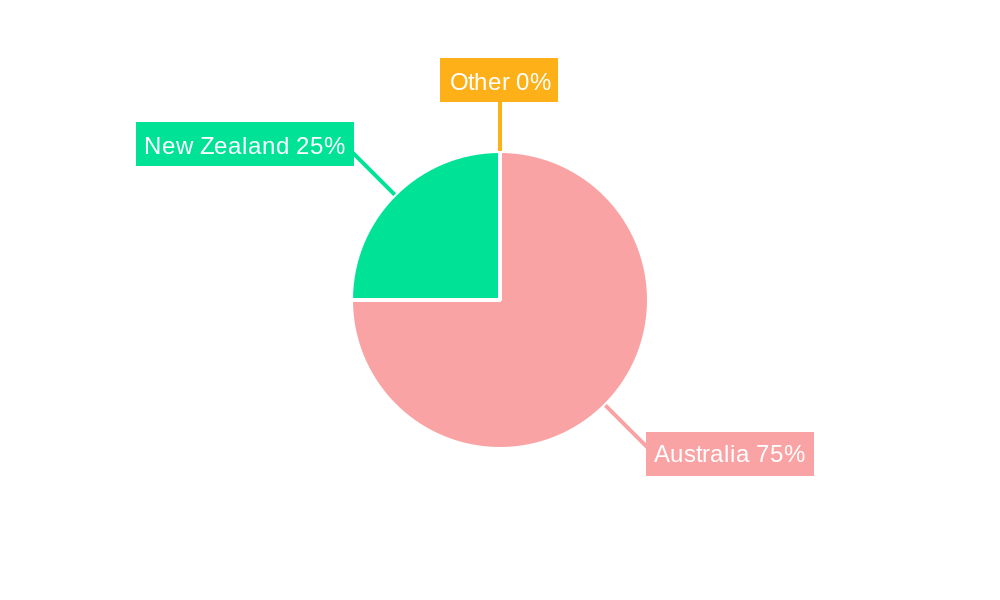
The Australian market currently dominates the ANZ region, accounting for approximately xx% of the total market value in 2025. This dominance stems from significant government investments in space technology, a thriving research and development ecosystem, and a relatively well-developed infrastructure for data processing and distribution. New Zealand also demonstrates substantial growth potential with increasing demand for satellite-based services across key sectors.
Dominant Segments:
- By Type: The Earth Observation Data segment holds the largest market share due to the foundational role of data in the industry. Value-added services are exhibiting faster growth as demand for advanced analytical tools rises.
- By Satellite Orbit: The Low Earth Orbit (LEO) segment leads due to its superior image resolution and improved revisit time. However, Medium Earth Orbit (MEO) and Geostationary Orbit (GEO) segments are growing due to their specific advantages in providing wide area coverage for various applications.
- By End-use: The Agriculture and Infrastructure segments are major growth drivers, fueled by their reliance on precise geo-spatial data for improved resource management, infrastructure planning, and disaster response. Urban development and climate services also show strong growth.
ANZ Satellite-based Earth Observation Market Product Landscape
The ANZ satellite-based Earth observation market offers a range of products and services, including high-resolution satellite imagery, value-added services such as data processing and analytics, and consulting services for data integration. Recent innovations include the use of AI and machine learning for automated data analysis, the deployment of smaller, more cost-effective satellites, and the increasing integration of Earth observation data with other data sources like IoT sensors to provide comprehensive insights. Unique selling propositions often revolve around the speed of data delivery, the precision of the imagery, and the specialized analytical tools offered.
Key Drivers, Barriers & Challenges in ANZ Satellite-based Earth Observation Market
Key Drivers:
- Government initiatives and funding.
- Growing demand for high-resolution imagery and data analytics across various sectors.
- Technological advancements leading to cost reduction and improved data quality.
- Increasing awareness of the environmental benefits of satellite-based Earth observation.
Key Challenges:
- High initial investment costs in satellite technology and data processing infrastructure.
- Data security and privacy concerns.
- Competition from traditional surveying methods and aerial photography.
- Limited skilled workforce. The industry faces a shortage of data scientists and specialists to manage and interpret the vast amounts of data generated.
Emerging Opportunities in ANZ Satellite-based Earth Observation Market
Significant opportunities exist in the expansion of the market to previously underserved sectors such as the mining industry. Increased focus on environmental monitoring and climate change mitigation presents significant prospects. Emerging applications of AI and machine learning for automating data analysis will contribute to unlocking significant value from satellite imagery. Furthermore, the integration of satellite data with other data sources holds immense potential for creating innovative applications and improved decision-making across diverse sectors.
Growth Accelerators in the ANZ Satellite-based Earth Observation Market Industry
Long-term growth in the ANZ satellite-based Earth observation market will be driven by advancements in sensor technology, the expansion of high-throughput satellite constellations providing increased data availability, and the development of sophisticated data analytics tools. Strategic partnerships between satellite operators, data processors, and end-users will also accelerate growth. Furthermore, government policies that promote the use of space technology and foster innovation are likely to catalyze continued market expansion.
Key Players Shaping the ANZ Satellite-based Earth Observation Market Market
- Spiral Blue
- Critchlow Geospatial
- Lockheed Martin Corporation
- Airbus SE
- Arlula Pty Ltd
- Geoscience Australia
- NEC Corporation
- maitec
- Go2Q Pty Ltd
- LatConnect60 Pty Ltd
- Geoimage Australia
Notable Milestones in ANZ Satellite-based Earth Observation Market Sector
- March 2023: Rocket Lab USA, Inc. establishes Rocket Lab Australia, signaling increased investment in Australian space capabilities and market growth potential.
- May 2023: Arlula Pty Ltd secures USD 1.5 million in funding to expand access to Earth observation data, indicating growing market demand and investment interest.
In-Depth ANZ Satellite-based Earth Observation Market Market Outlook
The future of the ANZ satellite-based Earth observation market is bright, driven by increasing demand for high-quality data and analytics. Opportunities abound for companies to develop innovative applications, enhance data processing capabilities, and expand into new market segments. The continued support from government initiatives and private investment will be essential for realizing the full potential of this sector. The market is poised for significant growth, with the potential to become a major contributor to economic development and technological advancement in the ANZ region.
ANZ Satellite-based Earth Observation Market Segmentation
-
1. Type
- 1.1. Earth Observation Data
- 1.2. Value Added Services
-
2. Satellite Orbit
- 2.1. Low Earth Orbit
- 2.2. Medium Earth Orbit
- 2.3. Geostationary Orbit
-
3. End-use
- 3.1. Urban Development and Cultural Heritage
- 3.2. Agriculture
- 3.3. Climate Services
- 3.4. Energy and Raw Materials
- 3.5. Infrastructure
- 3.6. Others
ANZ Satellite-based Earth Observation Market Segmentation By Geography
-
1. North America
- 1.1. United States
- 1.2. Canada
- 1.3. Mexico
-
2. South America
- 2.1. Brazil
- 2.2. Argentina
- 2.3. Rest of South America
-
3. Europe
- 3.1. United Kingdom
- 3.2. Germany
- 3.3. France
- 3.4. Italy
- 3.5. Spain
- 3.6. Russia
- 3.7. Benelux
- 3.8. Nordics
- 3.9. Rest of Europe
-
4. Middle East & Africa
- 4.1. Turkey
- 4.2. Israel
- 4.3. GCC
- 4.4. North Africa
- 4.5. South Africa
- 4.6. Rest of Middle East & Africa
-
5. Asia Pacific
- 5.1. China
- 5.2. India
- 5.3. Japan
- 5.4. South Korea
- 5.5. ASEAN
- 5.6. Oceania
- 5.7. Rest of Asia Pacific
ANZ Satellite-based Earth Observation Market REPORT HIGHLIGHTS
| Aspects | Details |
|---|---|
| Study Period | 2019-2033 |
| Base Year | 2024 |
| Estimated Year | 2025 |
| Forecast Period | 2025-2033 |
| Historical Period | 2019-2024 |
| Growth Rate | CAGR of 9.62% from 2019-2033 |
| Segmentation |
|
Table of Contents
- 1. Introduction
- 1.1. Research Scope
- 1.2. Market Segmentation
- 1.3. Research Methodology
- 1.4. Definitions and Assumptions
- 2. Executive Summary
- 2.1. Introduction
- 3. Market Dynamics
- 3.1. Introduction
- 3.2. Market Drivers
- 3.2.1. Government Initiatives and Investments; Technological Advancements
- 3.3. Market Restrains
- 3.3.1. Budget Constraints and Technological Limitations; Regulatory and Legal Challenges
- 3.4. Market Trends
- 3.4.1. Government Initiatives and Investments is Driving the Market
- 4. Market Factor Analysis
- 4.1. Porters Five Forces
- 4.2. Supply/Value Chain
- 4.3. PESTEL analysis
- 4.4. Market Entropy
- 4.5. Patent/Trademark Analysis
- 5. Global ANZ Satellite-based Earth Observation Market Analysis, Insights and Forecast, 2019-2031
- 5.1. Market Analysis, Insights and Forecast - by Type
- 5.1.1. Earth Observation Data
- 5.1.2. Value Added Services
- 5.2. Market Analysis, Insights and Forecast - by Satellite Orbit
- 5.2.1. Low Earth Orbit
- 5.2.2. Medium Earth Orbit
- 5.2.3. Geostationary Orbit
- 5.3. Market Analysis, Insights and Forecast - by End-use
- 5.3.1. Urban Development and Cultural Heritage
- 5.3.2. Agriculture
- 5.3.3. Climate Services
- 5.3.4. Energy and Raw Materials
- 5.3.5. Infrastructure
- 5.3.6. Others
- 5.4. Market Analysis, Insights and Forecast - by Region
- 5.4.1. North America
- 5.4.2. South America
- 5.4.3. Europe
- 5.4.4. Middle East & Africa
- 5.4.5. Asia Pacific
- 5.1. Market Analysis, Insights and Forecast - by Type
- 6. North America ANZ Satellite-based Earth Observation Market Analysis, Insights and Forecast, 2019-2031
- 6.1. Market Analysis, Insights and Forecast - by Type
- 6.1.1. Earth Observation Data
- 6.1.2. Value Added Services
- 6.2. Market Analysis, Insights and Forecast - by Satellite Orbit
- 6.2.1. Low Earth Orbit
- 6.2.2. Medium Earth Orbit
- 6.2.3. Geostationary Orbit
- 6.3. Market Analysis, Insights and Forecast - by End-use
- 6.3.1. Urban Development and Cultural Heritage
- 6.3.2. Agriculture
- 6.3.3. Climate Services
- 6.3.4. Energy and Raw Materials
- 6.3.5. Infrastructure
- 6.3.6. Others
- 6.1. Market Analysis, Insights and Forecast - by Type
- 7. South America ANZ Satellite-based Earth Observation Market Analysis, Insights and Forecast, 2019-2031
- 7.1. Market Analysis, Insights and Forecast - by Type
- 7.1.1. Earth Observation Data
- 7.1.2. Value Added Services
- 7.2. Market Analysis, Insights and Forecast - by Satellite Orbit
- 7.2.1. Low Earth Orbit
- 7.2.2. Medium Earth Orbit
- 7.2.3. Geostationary Orbit
- 7.3. Market Analysis, Insights and Forecast - by End-use
- 7.3.1. Urban Development and Cultural Heritage
- 7.3.2. Agriculture
- 7.3.3. Climate Services
- 7.3.4. Energy and Raw Materials
- 7.3.5. Infrastructure
- 7.3.6. Others
- 7.1. Market Analysis, Insights and Forecast - by Type
- 8. Europe ANZ Satellite-based Earth Observation Market Analysis, Insights and Forecast, 2019-2031
- 8.1. Market Analysis, Insights and Forecast - by Type
- 8.1.1. Earth Observation Data
- 8.1.2. Value Added Services
- 8.2. Market Analysis, Insights and Forecast - by Satellite Orbit
- 8.2.1. Low Earth Orbit
- 8.2.2. Medium Earth Orbit
- 8.2.3. Geostationary Orbit
- 8.3. Market Analysis, Insights and Forecast - by End-use
- 8.3.1. Urban Development and Cultural Heritage
- 8.3.2. Agriculture
- 8.3.3. Climate Services
- 8.3.4. Energy and Raw Materials
- 8.3.5. Infrastructure
- 8.3.6. Others
- 8.1. Market Analysis, Insights and Forecast - by Type
- 9. Middle East & Africa ANZ Satellite-based Earth Observation Market Analysis, Insights and Forecast, 2019-2031
- 9.1. Market Analysis, Insights and Forecast - by Type
- 9.1.1. Earth Observation Data
- 9.1.2. Value Added Services
- 9.2. Market Analysis, Insights and Forecast - by Satellite Orbit
- 9.2.1. Low Earth Orbit
- 9.2.2. Medium Earth Orbit
- 9.2.3. Geostationary Orbit
- 9.3. Market Analysis, Insights and Forecast - by End-use
- 9.3.1. Urban Development and Cultural Heritage
- 9.3.2. Agriculture
- 9.3.3. Climate Services
- 9.3.4. Energy and Raw Materials
- 9.3.5. Infrastructure
- 9.3.6. Others
- 9.1. Market Analysis, Insights and Forecast - by Type
- 10. Asia Pacific ANZ Satellite-based Earth Observation Market Analysis, Insights and Forecast, 2019-2031
- 10.1. Market Analysis, Insights and Forecast - by Type
- 10.1.1. Earth Observation Data
- 10.1.2. Value Added Services
- 10.2. Market Analysis, Insights and Forecast - by Satellite Orbit
- 10.2.1. Low Earth Orbit
- 10.2.2. Medium Earth Orbit
- 10.2.3. Geostationary Orbit
- 10.3. Market Analysis, Insights and Forecast - by End-use
- 10.3.1. Urban Development and Cultural Heritage
- 10.3.2. Agriculture
- 10.3.3. Climate Services
- 10.3.4. Energy and Raw Materials
- 10.3.5. Infrastructure
- 10.3.6. Others
- 10.1. Market Analysis, Insights and Forecast - by Type
- 11. North America ANZ Satellite-based Earth Observation Market Analysis, Insights and Forecast, 2019-2031
- 11.1. Market Analysis, Insights and Forecast - By Country/Sub-region
- 11.1.1 United States
- 11.1.2 Canada
- 12. Europe ANZ Satellite-based Earth Observation Market Analysis, Insights and Forecast, 2019-2031
- 12.1. Market Analysis, Insights and Forecast - By Country/Sub-region
- 12.1.1 United Kingdom
- 12.1.2 Germany
- 12.1.3 France
- 12.1.4 Italy
- 12.1.5 Spain
- 12.1.6 Nordics
- 12.1.7 Benelux
- 12.1.8 Rest of Europe
- 13. Asia Pacific ANZ Satellite-based Earth Observation Market Analysis, Insights and Forecast, 2019-2031
- 13.1. Market Analysis, Insights and Forecast - By Country/Sub-region
- 13.1.1 China
- 13.1.2 Japan
- 13.1.3 India
- 13.1.4 Rest of Asia Pacific
- 14. Rest of the World ANZ Satellite-based Earth Observation Market Analysis, Insights and Forecast, 2019-2031
- 14.1. Market Analysis, Insights and Forecast - By Country/Sub-region
- 14.1.1.
- 15. Competitive Analysis
- 15.1. Global Market Share Analysis 2024
- 15.2. Company Profiles
- 15.2.1 Spiral Blue
- 15.2.1.1. Overview
- 15.2.1.2. Products
- 15.2.1.3. SWOT Analysis
- 15.2.1.4. Recent Developments
- 15.2.1.5. Financials (Based on Availability)
- 15.2.2 Critchlow Geospatial
- 15.2.2.1. Overview
- 15.2.2.2. Products
- 15.2.2.3. SWOT Analysis
- 15.2.2.4. Recent Developments
- 15.2.2.5. Financials (Based on Availability)
- 15.2.3 lockheed martin corporation
- 15.2.3.1. Overview
- 15.2.3.2. Products
- 15.2.3.3. SWOT Analysis
- 15.2.3.4. Recent Developments
- 15.2.3.5. Financials (Based on Availability)
- 15.2.4 Airbus SE
- 15.2.4.1. Overview
- 15.2.4.2. Products
- 15.2.4.3. SWOT Analysis
- 15.2.4.4. Recent Developments
- 15.2.4.5. Financials (Based on Availability)
- 15.2.5 Arlula Pty Ltd
- 15.2.5.1. Overview
- 15.2.5.2. Products
- 15.2.5.3. SWOT Analysis
- 15.2.5.4. Recent Developments
- 15.2.5.5. Financials (Based on Availability)
- 15.2.6 Geoscience Australia
- 15.2.6.1. Overview
- 15.2.6.2. Products
- 15.2.6.3. SWOT Analysis
- 15.2.6.4. Recent Developments
- 15.2.6.5. Financials (Based on Availability)
- 15.2.7 NEC Corporation
- 15.2.7.1. Overview
- 15.2.7.2. Products
- 15.2.7.3. SWOT Analysis
- 15.2.7.4. Recent Developments
- 15.2.7.5. Financials (Based on Availability)
- 15.2.8 maitec
- 15.2.8.1. Overview
- 15.2.8.2. Products
- 15.2.8.3. SWOT Analysis
- 15.2.8.4. Recent Developments
- 15.2.8.5. Financials (Based on Availability)
- 15.2.9 Go2Q Pty Ltd
- 15.2.9.1. Overview
- 15.2.9.2. Products
- 15.2.9.3. SWOT Analysis
- 15.2.9.4. Recent Developments
- 15.2.9.5. Financials (Based on Availability)
- 15.2.10 LatConnect60 Pty Ltd
- 15.2.10.1. Overview
- 15.2.10.2. Products
- 15.2.10.3. SWOT Analysis
- 15.2.10.4. Recent Developments
- 15.2.10.5. Financials (Based on Availability)
- 15.2.11 Geoimage Australia
- 15.2.11.1. Overview
- 15.2.11.2. Products
- 15.2.11.3. SWOT Analysis
- 15.2.11.4. Recent Developments
- 15.2.11.5. Financials (Based on Availability)
- 15.2.1 Spiral Blue
List of Figures
- Figure 1: Global ANZ Satellite-based Earth Observation Market Revenue Breakdown (Million, %) by Region 2024 & 2032
- Figure 2: Global ANZ Satellite-based Earth Observation Market Volume Breakdown (K Unit, %) by Region 2024 & 2032
- Figure 3: North America ANZ Satellite-based Earth Observation Market Revenue (Million), by Country 2024 & 2032
- Figure 4: North America ANZ Satellite-based Earth Observation Market Volume (K Unit), by Country 2024 & 2032
- Figure 5: North America ANZ Satellite-based Earth Observation Market Revenue Share (%), by Country 2024 & 2032
- Figure 6: North America ANZ Satellite-based Earth Observation Market Volume Share (%), by Country 2024 & 2032
- Figure 7: Europe ANZ Satellite-based Earth Observation Market Revenue (Million), by Country 2024 & 2032
- Figure 8: Europe ANZ Satellite-based Earth Observation Market Volume (K Unit), by Country 2024 & 2032
- Figure 9: Europe ANZ Satellite-based Earth Observation Market Revenue Share (%), by Country 2024 & 2032
- Figure 10: Europe ANZ Satellite-based Earth Observation Market Volume Share (%), by Country 2024 & 2032
- Figure 11: Asia Pacific ANZ Satellite-based Earth Observation Market Revenue (Million), by Country 2024 & 2032
- Figure 12: Asia Pacific ANZ Satellite-based Earth Observation Market Volume (K Unit), by Country 2024 & 2032
- Figure 13: Asia Pacific ANZ Satellite-based Earth Observation Market Revenue Share (%), by Country 2024 & 2032
- Figure 14: Asia Pacific ANZ Satellite-based Earth Observation Market Volume Share (%), by Country 2024 & 2032
- Figure 15: Rest of the World ANZ Satellite-based Earth Observation Market Revenue (Million), by Country 2024 & 2032
- Figure 16: Rest of the World ANZ Satellite-based Earth Observation Market Volume (K Unit), by Country 2024 & 2032
- Figure 17: Rest of the World ANZ Satellite-based Earth Observation Market Revenue Share (%), by Country 2024 & 2032
- Figure 18: Rest of the World ANZ Satellite-based Earth Observation Market Volume Share (%), by Country 2024 & 2032
- Figure 19: North America ANZ Satellite-based Earth Observation Market Revenue (Million), by Type 2024 & 2032
- Figure 20: North America ANZ Satellite-based Earth Observation Market Volume (K Unit), by Type 2024 & 2032
- Figure 21: North America ANZ Satellite-based Earth Observation Market Revenue Share (%), by Type 2024 & 2032
- Figure 22: North America ANZ Satellite-based Earth Observation Market Volume Share (%), by Type 2024 & 2032
- Figure 23: North America ANZ Satellite-based Earth Observation Market Revenue (Million), by Satellite Orbit 2024 & 2032
- Figure 24: North America ANZ Satellite-based Earth Observation Market Volume (K Unit), by Satellite Orbit 2024 & 2032
- Figure 25: North America ANZ Satellite-based Earth Observation Market Revenue Share (%), by Satellite Orbit 2024 & 2032
- Figure 26: North America ANZ Satellite-based Earth Observation Market Volume Share (%), by Satellite Orbit 2024 & 2032
- Figure 27: North America ANZ Satellite-based Earth Observation Market Revenue (Million), by End-use 2024 & 2032
- Figure 28: North America ANZ Satellite-based Earth Observation Market Volume (K Unit), by End-use 2024 & 2032
- Figure 29: North America ANZ Satellite-based Earth Observation Market Revenue Share (%), by End-use 2024 & 2032
- Figure 30: North America ANZ Satellite-based Earth Observation Market Volume Share (%), by End-use 2024 & 2032
- Figure 31: North America ANZ Satellite-based Earth Observation Market Revenue (Million), by Country 2024 & 2032
- Figure 32: North America ANZ Satellite-based Earth Observation Market Volume (K Unit), by Country 2024 & 2032
- Figure 33: North America ANZ Satellite-based Earth Observation Market Revenue Share (%), by Country 2024 & 2032
- Figure 34: North America ANZ Satellite-based Earth Observation Market Volume Share (%), by Country 2024 & 2032
- Figure 35: South America ANZ Satellite-based Earth Observation Market Revenue (Million), by Type 2024 & 2032
- Figure 36: South America ANZ Satellite-based Earth Observation Market Volume (K Unit), by Type 2024 & 2032
- Figure 37: South America ANZ Satellite-based Earth Observation Market Revenue Share (%), by Type 2024 & 2032
- Figure 38: South America ANZ Satellite-based Earth Observation Market Volume Share (%), by Type 2024 & 2032
- Figure 39: South America ANZ Satellite-based Earth Observation Market Revenue (Million), by Satellite Orbit 2024 & 2032
- Figure 40: South America ANZ Satellite-based Earth Observation Market Volume (K Unit), by Satellite Orbit 2024 & 2032
- Figure 41: South America ANZ Satellite-based Earth Observation Market Revenue Share (%), by Satellite Orbit 2024 & 2032
- Figure 42: South America ANZ Satellite-based Earth Observation Market Volume Share (%), by Satellite Orbit 2024 & 2032
- Figure 43: South America ANZ Satellite-based Earth Observation Market Revenue (Million), by End-use 2024 & 2032
- Figure 44: South America ANZ Satellite-based Earth Observation Market Volume (K Unit), by End-use 2024 & 2032
- Figure 45: South America ANZ Satellite-based Earth Observation Market Revenue Share (%), by End-use 2024 & 2032
- Figure 46: South America ANZ Satellite-based Earth Observation Market Volume Share (%), by End-use 2024 & 2032
- Figure 47: South America ANZ Satellite-based Earth Observation Market Revenue (Million), by Country 2024 & 2032
- Figure 48: South America ANZ Satellite-based Earth Observation Market Volume (K Unit), by Country 2024 & 2032
- Figure 49: South America ANZ Satellite-based Earth Observation Market Revenue Share (%), by Country 2024 & 2032
- Figure 50: South America ANZ Satellite-based Earth Observation Market Volume Share (%), by Country 2024 & 2032
- Figure 51: Europe ANZ Satellite-based Earth Observation Market Revenue (Million), by Type 2024 & 2032
- Figure 52: Europe ANZ Satellite-based Earth Observation Market Volume (K Unit), by Type 2024 & 2032
- Figure 53: Europe ANZ Satellite-based Earth Observation Market Revenue Share (%), by Type 2024 & 2032
- Figure 54: Europe ANZ Satellite-based Earth Observation Market Volume Share (%), by Type 2024 & 2032
- Figure 55: Europe ANZ Satellite-based Earth Observation Market Revenue (Million), by Satellite Orbit 2024 & 2032
- Figure 56: Europe ANZ Satellite-based Earth Observation Market Volume (K Unit), by Satellite Orbit 2024 & 2032
- Figure 57: Europe ANZ Satellite-based Earth Observation Market Revenue Share (%), by Satellite Orbit 2024 & 2032
- Figure 58: Europe ANZ Satellite-based Earth Observation Market Volume Share (%), by Satellite Orbit 2024 & 2032
- Figure 59: Europe ANZ Satellite-based Earth Observation Market Revenue (Million), by End-use 2024 & 2032
- Figure 60: Europe ANZ Satellite-based Earth Observation Market Volume (K Unit), by End-use 2024 & 2032
- Figure 61: Europe ANZ Satellite-based Earth Observation Market Revenue Share (%), by End-use 2024 & 2032
- Figure 62: Europe ANZ Satellite-based Earth Observation Market Volume Share (%), by End-use 2024 & 2032
- Figure 63: Europe ANZ Satellite-based Earth Observation Market Revenue (Million), by Country 2024 & 2032
- Figure 64: Europe ANZ Satellite-based Earth Observation Market Volume (K Unit), by Country 2024 & 2032
- Figure 65: Europe ANZ Satellite-based Earth Observation Market Revenue Share (%), by Country 2024 & 2032
- Figure 66: Europe ANZ Satellite-based Earth Observation Market Volume Share (%), by Country 2024 & 2032
- Figure 67: Middle East & Africa ANZ Satellite-based Earth Observation Market Revenue (Million), by Type 2024 & 2032
- Figure 68: Middle East & Africa ANZ Satellite-based Earth Observation Market Volume (K Unit), by Type 2024 & 2032
- Figure 69: Middle East & Africa ANZ Satellite-based Earth Observation Market Revenue Share (%), by Type 2024 & 2032
- Figure 70: Middle East & Africa ANZ Satellite-based Earth Observation Market Volume Share (%), by Type 2024 & 2032
- Figure 71: Middle East & Africa ANZ Satellite-based Earth Observation Market Revenue (Million), by Satellite Orbit 2024 & 2032
- Figure 72: Middle East & Africa ANZ Satellite-based Earth Observation Market Volume (K Unit), by Satellite Orbit 2024 & 2032
- Figure 73: Middle East & Africa ANZ Satellite-based Earth Observation Market Revenue Share (%), by Satellite Orbit 2024 & 2032
- Figure 74: Middle East & Africa ANZ Satellite-based Earth Observation Market Volume Share (%), by Satellite Orbit 2024 & 2032
- Figure 75: Middle East & Africa ANZ Satellite-based Earth Observation Market Revenue (Million), by End-use 2024 & 2032
- Figure 76: Middle East & Africa ANZ Satellite-based Earth Observation Market Volume (K Unit), by End-use 2024 & 2032
- Figure 77: Middle East & Africa ANZ Satellite-based Earth Observation Market Revenue Share (%), by End-use 2024 & 2032
- Figure 78: Middle East & Africa ANZ Satellite-based Earth Observation Market Volume Share (%), by End-use 2024 & 2032
- Figure 79: Middle East & Africa ANZ Satellite-based Earth Observation Market Revenue (Million), by Country 2024 & 2032
- Figure 80: Middle East & Africa ANZ Satellite-based Earth Observation Market Volume (K Unit), by Country 2024 & 2032
- Figure 81: Middle East & Africa ANZ Satellite-based Earth Observation Market Revenue Share (%), by Country 2024 & 2032
- Figure 82: Middle East & Africa ANZ Satellite-based Earth Observation Market Volume Share (%), by Country 2024 & 2032
- Figure 83: Asia Pacific ANZ Satellite-based Earth Observation Market Revenue (Million), by Type 2024 & 2032
- Figure 84: Asia Pacific ANZ Satellite-based Earth Observation Market Volume (K Unit), by Type 2024 & 2032
- Figure 85: Asia Pacific ANZ Satellite-based Earth Observation Market Revenue Share (%), by Type 2024 & 2032
- Figure 86: Asia Pacific ANZ Satellite-based Earth Observation Market Volume Share (%), by Type 2024 & 2032
- Figure 87: Asia Pacific ANZ Satellite-based Earth Observation Market Revenue (Million), by Satellite Orbit 2024 & 2032
- Figure 88: Asia Pacific ANZ Satellite-based Earth Observation Market Volume (K Unit), by Satellite Orbit 2024 & 2032
- Figure 89: Asia Pacific ANZ Satellite-based Earth Observation Market Revenue Share (%), by Satellite Orbit 2024 & 2032
- Figure 90: Asia Pacific ANZ Satellite-based Earth Observation Market Volume Share (%), by Satellite Orbit 2024 & 2032
- Figure 91: Asia Pacific ANZ Satellite-based Earth Observation Market Revenue (Million), by End-use 2024 & 2032
- Figure 92: Asia Pacific ANZ Satellite-based Earth Observation Market Volume (K Unit), by End-use 2024 & 2032
- Figure 93: Asia Pacific ANZ Satellite-based Earth Observation Market Revenue Share (%), by End-use 2024 & 2032
- Figure 94: Asia Pacific ANZ Satellite-based Earth Observation Market Volume Share (%), by End-use 2024 & 2032
- Figure 95: Asia Pacific ANZ Satellite-based Earth Observation Market Revenue (Million), by Country 2024 & 2032
- Figure 96: Asia Pacific ANZ Satellite-based Earth Observation Market Volume (K Unit), by Country 2024 & 2032
- Figure 97: Asia Pacific ANZ Satellite-based Earth Observation Market Revenue Share (%), by Country 2024 & 2032
- Figure 98: Asia Pacific ANZ Satellite-based Earth Observation Market Volume Share (%), by Country 2024 & 2032
List of Tables
- Table 1: Global ANZ Satellite-based Earth Observation Market Revenue Million Forecast, by Region 2019 & 2032
- Table 2: Global ANZ Satellite-based Earth Observation Market Volume K Unit Forecast, by Region 2019 & 2032
- Table 3: Global ANZ Satellite-based Earth Observation Market Revenue Million Forecast, by Type 2019 & 2032
- Table 4: Global ANZ Satellite-based Earth Observation Market Volume K Unit Forecast, by Type 2019 & 2032
- Table 5: Global ANZ Satellite-based Earth Observation Market Revenue Million Forecast, by Satellite Orbit 2019 & 2032
- Table 6: Global ANZ Satellite-based Earth Observation Market Volume K Unit Forecast, by Satellite Orbit 2019 & 2032
- Table 7: Global ANZ Satellite-based Earth Observation Market Revenue Million Forecast, by End-use 2019 & 2032
- Table 8: Global ANZ Satellite-based Earth Observation Market Volume K Unit Forecast, by End-use 2019 & 2032
- Table 9: Global ANZ Satellite-based Earth Observation Market Revenue Million Forecast, by Region 2019 & 2032
- Table 10: Global ANZ Satellite-based Earth Observation Market Volume K Unit Forecast, by Region 2019 & 2032
- Table 11: Global ANZ Satellite-based Earth Observation Market Revenue Million Forecast, by Country 2019 & 2032
- Table 12: Global ANZ Satellite-based Earth Observation Market Volume K Unit Forecast, by Country 2019 & 2032
- Table 13: United States ANZ Satellite-based Earth Observation Market Revenue (Million) Forecast, by Application 2019 & 2032
- Table 14: United States ANZ Satellite-based Earth Observation Market Volume (K Unit) Forecast, by Application 2019 & 2032
- Table 15: Canada ANZ Satellite-based Earth Observation Market Revenue (Million) Forecast, by Application 2019 & 2032
- Table 16: Canada ANZ Satellite-based Earth Observation Market Volume (K Unit) Forecast, by Application 2019 & 2032
- Table 17: Global ANZ Satellite-based Earth Observation Market Revenue Million Forecast, by Country 2019 & 2032
- Table 18: Global ANZ Satellite-based Earth Observation Market Volume K Unit Forecast, by Country 2019 & 2032
- Table 19: United Kingdom ANZ Satellite-based Earth Observation Market Revenue (Million) Forecast, by Application 2019 & 2032
- Table 20: United Kingdom ANZ Satellite-based Earth Observation Market Volume (K Unit) Forecast, by Application 2019 & 2032
- Table 21: Germany ANZ Satellite-based Earth Observation Market Revenue (Million) Forecast, by Application 2019 & 2032
- Table 22: Germany ANZ Satellite-based Earth Observation Market Volume (K Unit) Forecast, by Application 2019 & 2032
- Table 23: France ANZ Satellite-based Earth Observation Market Revenue (Million) Forecast, by Application 2019 & 2032
- Table 24: France ANZ Satellite-based Earth Observation Market Volume (K Unit) Forecast, by Application 2019 & 2032
- Table 25: Italy ANZ Satellite-based Earth Observation Market Revenue (Million) Forecast, by Application 2019 & 2032
- Table 26: Italy ANZ Satellite-based Earth Observation Market Volume (K Unit) Forecast, by Application 2019 & 2032
- Table 27: Spain ANZ Satellite-based Earth Observation Market Revenue (Million) Forecast, by Application 2019 & 2032
- Table 28: Spain ANZ Satellite-based Earth Observation Market Volume (K Unit) Forecast, by Application 2019 & 2032
- Table 29: Nordics ANZ Satellite-based Earth Observation Market Revenue (Million) Forecast, by Application 2019 & 2032
- Table 30: Nordics ANZ Satellite-based Earth Observation Market Volume (K Unit) Forecast, by Application 2019 & 2032
- Table 31: Benelux ANZ Satellite-based Earth Observation Market Revenue (Million) Forecast, by Application 2019 & 2032
- Table 32: Benelux ANZ Satellite-based Earth Observation Market Volume (K Unit) Forecast, by Application 2019 & 2032
- Table 33: Rest of Europe ANZ Satellite-based Earth Observation Market Revenue (Million) Forecast, by Application 2019 & 2032
- Table 34: Rest of Europe ANZ Satellite-based Earth Observation Market Volume (K Unit) Forecast, by Application 2019 & 2032
- Table 35: Global ANZ Satellite-based Earth Observation Market Revenue Million Forecast, by Country 2019 & 2032
- Table 36: Global ANZ Satellite-based Earth Observation Market Volume K Unit Forecast, by Country 2019 & 2032
- Table 37: China ANZ Satellite-based Earth Observation Market Revenue (Million) Forecast, by Application 2019 & 2032
- Table 38: China ANZ Satellite-based Earth Observation Market Volume (K Unit) Forecast, by Application 2019 & 2032
- Table 39: Japan ANZ Satellite-based Earth Observation Market Revenue (Million) Forecast, by Application 2019 & 2032
- Table 40: Japan ANZ Satellite-based Earth Observation Market Volume (K Unit) Forecast, by Application 2019 & 2032
- Table 41: India ANZ Satellite-based Earth Observation Market Revenue (Million) Forecast, by Application 2019 & 2032
- Table 42: India ANZ Satellite-based Earth Observation Market Volume (K Unit) Forecast, by Application 2019 & 2032
- Table 43: Rest of Asia Pacific ANZ Satellite-based Earth Observation Market Revenue (Million) Forecast, by Application 2019 & 2032
- Table 44: Rest of Asia Pacific ANZ Satellite-based Earth Observation Market Volume (K Unit) Forecast, by Application 2019 & 2032
- Table 45: Global ANZ Satellite-based Earth Observation Market Revenue Million Forecast, by Country 2019 & 2032
- Table 46: Global ANZ Satellite-based Earth Observation Market Volume K Unit Forecast, by Country 2019 & 2032
- Table 47: ANZ Satellite-based Earth Observation Market Revenue (Million) Forecast, by Application 2019 & 2032
- Table 48: ANZ Satellite-based Earth Observation Market Volume (K Unit) Forecast, by Application 2019 & 2032
- Table 49: Global ANZ Satellite-based Earth Observation Market Revenue Million Forecast, by Type 2019 & 2032
- Table 50: Global ANZ Satellite-based Earth Observation Market Volume K Unit Forecast, by Type 2019 & 2032
- Table 51: Global ANZ Satellite-based Earth Observation Market Revenue Million Forecast, by Satellite Orbit 2019 & 2032
- Table 52: Global ANZ Satellite-based Earth Observation Market Volume K Unit Forecast, by Satellite Orbit 2019 & 2032
- Table 53: Global ANZ Satellite-based Earth Observation Market Revenue Million Forecast, by End-use 2019 & 2032
- Table 54: Global ANZ Satellite-based Earth Observation Market Volume K Unit Forecast, by End-use 2019 & 2032
- Table 55: Global ANZ Satellite-based Earth Observation Market Revenue Million Forecast, by Country 2019 & 2032
- Table 56: Global ANZ Satellite-based Earth Observation Market Volume K Unit Forecast, by Country 2019 & 2032
- Table 57: United States ANZ Satellite-based Earth Observation Market Revenue (Million) Forecast, by Application 2019 & 2032
- Table 58: United States ANZ Satellite-based Earth Observation Market Volume (K Unit) Forecast, by Application 2019 & 2032
- Table 59: Canada ANZ Satellite-based Earth Observation Market Revenue (Million) Forecast, by Application 2019 & 2032
- Table 60: Canada ANZ Satellite-based Earth Observation Market Volume (K Unit) Forecast, by Application 2019 & 2032
- Table 61: Mexico ANZ Satellite-based Earth Observation Market Revenue (Million) Forecast, by Application 2019 & 2032
- Table 62: Mexico ANZ Satellite-based Earth Observation Market Volume (K Unit) Forecast, by Application 2019 & 2032
- Table 63: Global ANZ Satellite-based Earth Observation Market Revenue Million Forecast, by Type 2019 & 2032
- Table 64: Global ANZ Satellite-based Earth Observation Market Volume K Unit Forecast, by Type 2019 & 2032
- Table 65: Global ANZ Satellite-based Earth Observation Market Revenue Million Forecast, by Satellite Orbit 2019 & 2032
- Table 66: Global ANZ Satellite-based Earth Observation Market Volume K Unit Forecast, by Satellite Orbit 2019 & 2032
- Table 67: Global ANZ Satellite-based Earth Observation Market Revenue Million Forecast, by End-use 2019 & 2032
- Table 68: Global ANZ Satellite-based Earth Observation Market Volume K Unit Forecast, by End-use 2019 & 2032
- Table 69: Global ANZ Satellite-based Earth Observation Market Revenue Million Forecast, by Country 2019 & 2032
- Table 70: Global ANZ Satellite-based Earth Observation Market Volume K Unit Forecast, by Country 2019 & 2032
- Table 71: Brazil ANZ Satellite-based Earth Observation Market Revenue (Million) Forecast, by Application 2019 & 2032
- Table 72: Brazil ANZ Satellite-based Earth Observation Market Volume (K Unit) Forecast, by Application 2019 & 2032
- Table 73: Argentina ANZ Satellite-based Earth Observation Market Revenue (Million) Forecast, by Application 2019 & 2032
- Table 74: Argentina ANZ Satellite-based Earth Observation Market Volume (K Unit) Forecast, by Application 2019 & 2032
- Table 75: Rest of South America ANZ Satellite-based Earth Observation Market Revenue (Million) Forecast, by Application 2019 & 2032
- Table 76: Rest of South America ANZ Satellite-based Earth Observation Market Volume (K Unit) Forecast, by Application 2019 & 2032
- Table 77: Global ANZ Satellite-based Earth Observation Market Revenue Million Forecast, by Type 2019 & 2032
- Table 78: Global ANZ Satellite-based Earth Observation Market Volume K Unit Forecast, by Type 2019 & 2032
- Table 79: Global ANZ Satellite-based Earth Observation Market Revenue Million Forecast, by Satellite Orbit 2019 & 2032
- Table 80: Global ANZ Satellite-based Earth Observation Market Volume K Unit Forecast, by Satellite Orbit 2019 & 2032
- Table 81: Global ANZ Satellite-based Earth Observation Market Revenue Million Forecast, by End-use 2019 & 2032
- Table 82: Global ANZ Satellite-based Earth Observation Market Volume K Unit Forecast, by End-use 2019 & 2032
- Table 83: Global ANZ Satellite-based Earth Observation Market Revenue Million Forecast, by Country 2019 & 2032
- Table 84: Global ANZ Satellite-based Earth Observation Market Volume K Unit Forecast, by Country 2019 & 2032
- Table 85: United Kingdom ANZ Satellite-based Earth Observation Market Revenue (Million) Forecast, by Application 2019 & 2032
- Table 86: United Kingdom ANZ Satellite-based Earth Observation Market Volume (K Unit) Forecast, by Application 2019 & 2032
- Table 87: Germany ANZ Satellite-based Earth Observation Market Revenue (Million) Forecast, by Application 2019 & 2032
- Table 88: Germany ANZ Satellite-based Earth Observation Market Volume (K Unit) Forecast, by Application 2019 & 2032
- Table 89: France ANZ Satellite-based Earth Observation Market Revenue (Million) Forecast, by Application 2019 & 2032
- Table 90: France ANZ Satellite-based Earth Observation Market Volume (K Unit) Forecast, by Application 2019 & 2032
- Table 91: Italy ANZ Satellite-based Earth Observation Market Revenue (Million) Forecast, by Application 2019 & 2032
- Table 92: Italy ANZ Satellite-based Earth Observation Market Volume (K Unit) Forecast, by Application 2019 & 2032
- Table 93: Spain ANZ Satellite-based Earth Observation Market Revenue (Million) Forecast, by Application 2019 & 2032
- Table 94: Spain ANZ Satellite-based Earth Observation Market Volume (K Unit) Forecast, by Application 2019 & 2032
- Table 95: Russia ANZ Satellite-based Earth Observation Market Revenue (Million) Forecast, by Application 2019 & 2032
- Table 96: Russia ANZ Satellite-based Earth Observation Market Volume (K Unit) Forecast, by Application 2019 & 2032
- Table 97: Benelux ANZ Satellite-based Earth Observation Market Revenue (Million) Forecast, by Application 2019 & 2032
- Table 98: Benelux ANZ Satellite-based Earth Observation Market Volume (K Unit) Forecast, by Application 2019 & 2032
- Table 99: Nordics ANZ Satellite-based Earth Observation Market Revenue (Million) Forecast, by Application 2019 & 2032
- Table 100: Nordics ANZ Satellite-based Earth Observation Market Volume (K Unit) Forecast, by Application 2019 & 2032
- Table 101: Rest of Europe ANZ Satellite-based Earth Observation Market Revenue (Million) Forecast, by Application 2019 & 2032
- Table 102: Rest of Europe ANZ Satellite-based Earth Observation Market Volume (K Unit) Forecast, by Application 2019 & 2032
- Table 103: Global ANZ Satellite-based Earth Observation Market Revenue Million Forecast, by Type 2019 & 2032
- Table 104: Global ANZ Satellite-based Earth Observation Market Volume K Unit Forecast, by Type 2019 & 2032
- Table 105: Global ANZ Satellite-based Earth Observation Market Revenue Million Forecast, by Satellite Orbit 2019 & 2032
- Table 106: Global ANZ Satellite-based Earth Observation Market Volume K Unit Forecast, by Satellite Orbit 2019 & 2032
- Table 107: Global ANZ Satellite-based Earth Observation Market Revenue Million Forecast, by End-use 2019 & 2032
- Table 108: Global ANZ Satellite-based Earth Observation Market Volume K Unit Forecast, by End-use 2019 & 2032
- Table 109: Global ANZ Satellite-based Earth Observation Market Revenue Million Forecast, by Country 2019 & 2032
- Table 110: Global ANZ Satellite-based Earth Observation Market Volume K Unit Forecast, by Country 2019 & 2032
- Table 111: Turkey ANZ Satellite-based Earth Observation Market Revenue (Million) Forecast, by Application 2019 & 2032
- Table 112: Turkey ANZ Satellite-based Earth Observation Market Volume (K Unit) Forecast, by Application 2019 & 2032
- Table 113: Israel ANZ Satellite-based Earth Observation Market Revenue (Million) Forecast, by Application 2019 & 2032
- Table 114: Israel ANZ Satellite-based Earth Observation Market Volume (K Unit) Forecast, by Application 2019 & 2032
- Table 115: GCC ANZ Satellite-based Earth Observation Market Revenue (Million) Forecast, by Application 2019 & 2032
- Table 116: GCC ANZ Satellite-based Earth Observation Market Volume (K Unit) Forecast, by Application 2019 & 2032
- Table 117: North Africa ANZ Satellite-based Earth Observation Market Revenue (Million) Forecast, by Application 2019 & 2032
- Table 118: North Africa ANZ Satellite-based Earth Observation Market Volume (K Unit) Forecast, by Application 2019 & 2032
- Table 119: South Africa ANZ Satellite-based Earth Observation Market Revenue (Million) Forecast, by Application 2019 & 2032
- Table 120: South Africa ANZ Satellite-based Earth Observation Market Volume (K Unit) Forecast, by Application 2019 & 2032
- Table 121: Rest of Middle East & Africa ANZ Satellite-based Earth Observation Market Revenue (Million) Forecast, by Application 2019 & 2032
- Table 122: Rest of Middle East & Africa ANZ Satellite-based Earth Observation Market Volume (K Unit) Forecast, by Application 2019 & 2032
- Table 123: Global ANZ Satellite-based Earth Observation Market Revenue Million Forecast, by Type 2019 & 2032
- Table 124: Global ANZ Satellite-based Earth Observation Market Volume K Unit Forecast, by Type 2019 & 2032
- Table 125: Global ANZ Satellite-based Earth Observation Market Revenue Million Forecast, by Satellite Orbit 2019 & 2032
- Table 126: Global ANZ Satellite-based Earth Observation Market Volume K Unit Forecast, by Satellite Orbit 2019 & 2032
- Table 127: Global ANZ Satellite-based Earth Observation Market Revenue Million Forecast, by End-use 2019 & 2032
- Table 128: Global ANZ Satellite-based Earth Observation Market Volume K Unit Forecast, by End-use 2019 & 2032
- Table 129: Global ANZ Satellite-based Earth Observation Market Revenue Million Forecast, by Country 2019 & 2032
- Table 130: Global ANZ Satellite-based Earth Observation Market Volume K Unit Forecast, by Country 2019 & 2032
- Table 131: China ANZ Satellite-based Earth Observation Market Revenue (Million) Forecast, by Application 2019 & 2032
- Table 132: China ANZ Satellite-based Earth Observation Market Volume (K Unit) Forecast, by Application 2019 & 2032
- Table 133: India ANZ Satellite-based Earth Observation Market Revenue (Million) Forecast, by Application 2019 & 2032
- Table 134: India ANZ Satellite-based Earth Observation Market Volume (K Unit) Forecast, by Application 2019 & 2032
- Table 135: Japan ANZ Satellite-based Earth Observation Market Revenue (Million) Forecast, by Application 2019 & 2032
- Table 136: Japan ANZ Satellite-based Earth Observation Market Volume (K Unit) Forecast, by Application 2019 & 2032
- Table 137: South Korea ANZ Satellite-based Earth Observation Market Revenue (Million) Forecast, by Application 2019 & 2032
- Table 138: South Korea ANZ Satellite-based Earth Observation Market Volume (K Unit) Forecast, by Application 2019 & 2032
- Table 139: ASEAN ANZ Satellite-based Earth Observation Market Revenue (Million) Forecast, by Application 2019 & 2032
- Table 140: ASEAN ANZ Satellite-based Earth Observation Market Volume (K Unit) Forecast, by Application 2019 & 2032
- Table 141: Oceania ANZ Satellite-based Earth Observation Market Revenue (Million) Forecast, by Application 2019 & 2032
- Table 142: Oceania ANZ Satellite-based Earth Observation Market Volume (K Unit) Forecast, by Application 2019 & 2032
- Table 143: Rest of Asia Pacific ANZ Satellite-based Earth Observation Market Revenue (Million) Forecast, by Application 2019 & 2032
- Table 144: Rest of Asia Pacific ANZ Satellite-based Earth Observation Market Volume (K Unit) Forecast, by Application 2019 & 2032
Frequently Asked Questions
1. What is the projected Compound Annual Growth Rate (CAGR) of the ANZ Satellite-based Earth Observation Market?
The projected CAGR is approximately 9.62%.
2. Which companies are prominent players in the ANZ Satellite-based Earth Observation Market?
Key companies in the market include Spiral Blue, Critchlow Geospatial, lockheed martin corporation, Airbus SE, Arlula Pty Ltd, Geoscience Australia, NEC Corporation, maitec, Go2Q Pty Ltd, LatConnect60 Pty Ltd, Geoimage Australia.
3. What are the main segments of the ANZ Satellite-based Earth Observation Market?
The market segments include Type, Satellite Orbit, End-use.
4. Can you provide details about the market size?
The market size is estimated to be USD XX Million as of 2022.
5. What are some drivers contributing to market growth?
Government Initiatives and Investments; Technological Advancements.
6. What are the notable trends driving market growth?
Government Initiatives and Investments is Driving the Market.
7. Are there any restraints impacting market growth?
Budget Constraints and Technological Limitations; Regulatory and Legal Challenges.
8. Can you provide examples of recent developments in the market?
March 2023: Rocket Lab USA, Inc, a global leader in launch services and space systems, announced the establishment of a new wholly-owned subsidiary, Rocket Lab Australia, to explore opportunities to support the expansion of Australia's national space capabilities, which shows the market growth potential for the satellite-based earth observation market in the region.
9. What pricing options are available for accessing the report?
Pricing options include single-user, multi-user, and enterprise licenses priced at USD 3800, USD 4500, and USD 5800 respectively.
10. Is the market size provided in terms of value or volume?
The market size is provided in terms of value, measured in Million and volume, measured in K Unit.
11. Are there any specific market keywords associated with the report?
Yes, the market keyword associated with the report is "ANZ Satellite-based Earth Observation Market," which aids in identifying and referencing the specific market segment covered.
12. How do I determine which pricing option suits my needs best?
The pricing options vary based on user requirements and access needs. Individual users may opt for single-user licenses, while businesses requiring broader access may choose multi-user or enterprise licenses for cost-effective access to the report.
13. Are there any additional resources or data provided in the ANZ Satellite-based Earth Observation Market report?
While the report offers comprehensive insights, it's advisable to review the specific contents or supplementary materials provided to ascertain if additional resources or data are available.
14. How can I stay updated on further developments or reports in the ANZ Satellite-based Earth Observation Market?
To stay informed about further developments, trends, and reports in the ANZ Satellite-based Earth Observation Market, consider subscribing to industry newsletters, following relevant companies and organizations, or regularly checking reputable industry news sources and publications.
Methodology
Step 1 - Identification of Relevant Samples Size from Population Database


Step 2 - Approaches for Defining Global Market Size (Value, Volume* & Price*)

Note*: In applicable scenarios
Step 3 - Data Sources
Primary Research
- Web Analytics
- Survey Reports
- Research Institute
- Latest Research Reports
- Opinion Leaders
Secondary Research
- Annual Reports
- White Paper
- Latest Press Release
- Industry Association
- Paid Database
- Investor Presentations

Step 4 - Data Triangulation
Involves using different sources of information in order to increase the validity of a study
These sources are likely to be stakeholders in a program - participants, other researchers, program staff, other community members, and so on.
Then we put all data in single framework & apply various statistical tools to find out the dynamic on the market.
During the analysis stage, feedback from the stakeholder groups would be compared to determine areas of agreement as well as areas of divergence


