
Key Insights
The Analytics as a Service (AaaS) market is experiencing robust growth, driven by the increasing adoption of cloud computing, the proliferation of big data, and the growing need for real-time insights across various industries. The market's Compound Annual Growth Rate (CAGR) of 25% from 2019 to 2024 indicates significant expansion, projected to continue through 2033. Key drivers include the cost-effectiveness of AaaS compared to on-premise solutions, its scalability to meet fluctuating demands, and the advanced analytical capabilities offered by leading providers like Amazon Web Services, Microsoft, and Google. The diverse range of industries adopting AaaS, including IT & Telecommunications, BFSI (Banking, Financial Services, and Insurance), healthcare, retail, and manufacturing, fuels this growth. Large enterprises are currently major adopters, but the increasing digital transformation initiatives of small and medium-sized enterprises (SMEs) present a significant untapped market potential. While data security concerns and integration complexities remain as restraints, the market’s inherent advantages, coupled with ongoing technological advancements, are expected to mitigate these challenges.
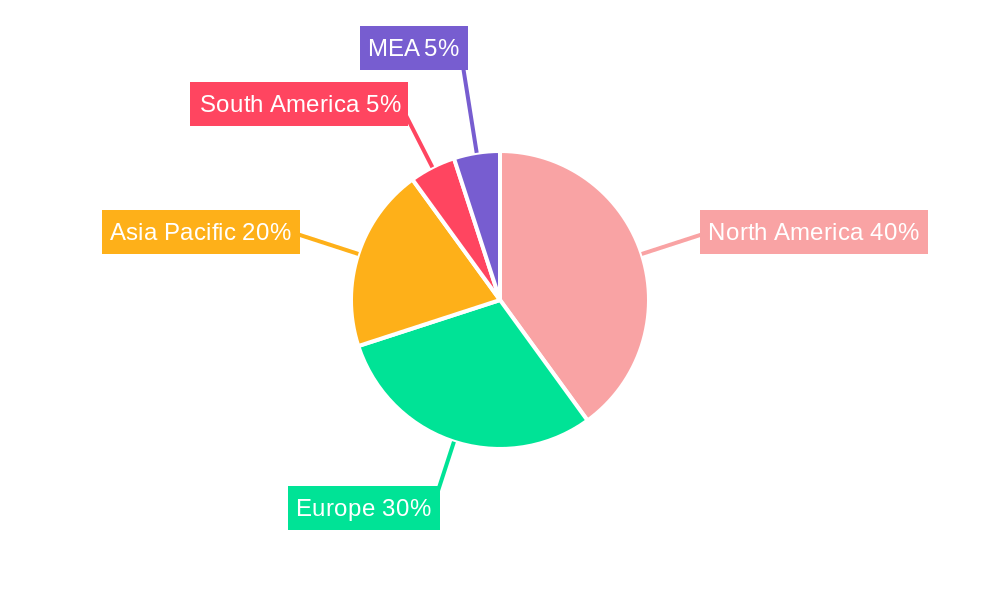
The geographic distribution of the AaaS market reflects global digitalization trends. North America currently holds a significant market share, driven by early adoption and the presence of major technology companies. However, the Asia-Pacific region is poised for substantial growth, propelled by rapid technological advancements and increasing digitalization efforts in countries like China and India. Europe also represents a considerable market, with Germany, the UK, and France as key contributors. Sustained investment in research and development, coupled with the ongoing development of advanced analytics techniques such as artificial intelligence (AI) and machine learning (ML) integration within AaaS platforms, will further shape the market landscape. This continuous evolution will lead to increased sophistication and accessibility of analytics, attracting a wider range of users and expanding the overall market size significantly in the coming years.
Analytics as a Service (AaaS) Industry Market Report: 2019-2033
This comprehensive report provides a detailed analysis of the Analytics as a Service (AaaS) industry, encompassing market dynamics, growth trends, regional segmentation, product landscape, key players, and future outlook. With a focus on both parent and child markets, this report is invaluable for industry professionals, investors, and strategic decision-makers seeking to navigate this rapidly evolving landscape. The report covers the period 2019-2033, with 2025 as the base and estimated year.
Study Period: 2019–2033 Base Year: 2025 Estimated Year: 2025 Forecast Period: 2025–2033 Historical Period: 2019–2024
Analytics as a Service Industry Market Dynamics & Structure
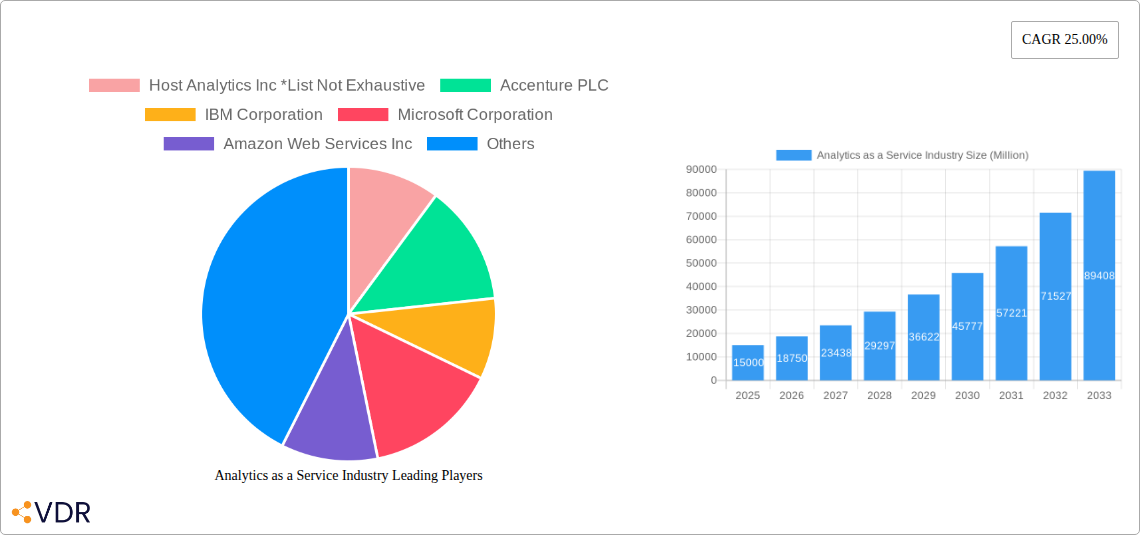
The AaaS market is characterized by a moderately concentrated landscape, with several major players competing alongside numerous niche providers. Technological innovation, particularly in areas like AI, machine learning, and big data analytics, is a primary growth driver. Regulatory frameworks, such as data privacy regulations (e.g., GDPR, CCPA), significantly influence market practices and adoption rates. Competitive substitutes include on-premise analytics solutions, although AaaS offers greater scalability and cost-effectiveness. End-user demographics are shifting towards greater adoption by SMEs, driven by accessibility and affordability. M&A activity remains significant, with approximately xx deals recorded in the historical period (2019-2024), representing an average annual value of xx Million. This trend reflects consolidation within the market and expansion into new segments.
- Market Concentration: Moderately concentrated, with top 5 players holding approximately xx% market share in 2024.
- Technological Innovation: Rapid advancements in AI, machine learning, and cloud computing are key drivers.
- Regulatory Frameworks: Data privacy regulations present both challenges and opportunities.
- Competitive Substitutes: On-premise analytics solutions, but with reduced flexibility and scalability.
- M&A Activity: xx deals valued at xx Million (2019-2024), indicative of market consolidation.
- Innovation Barriers: High initial investment in R&D, integration complexities, and skills shortages.
Analytics as a Service Industry Growth Trends & Insights
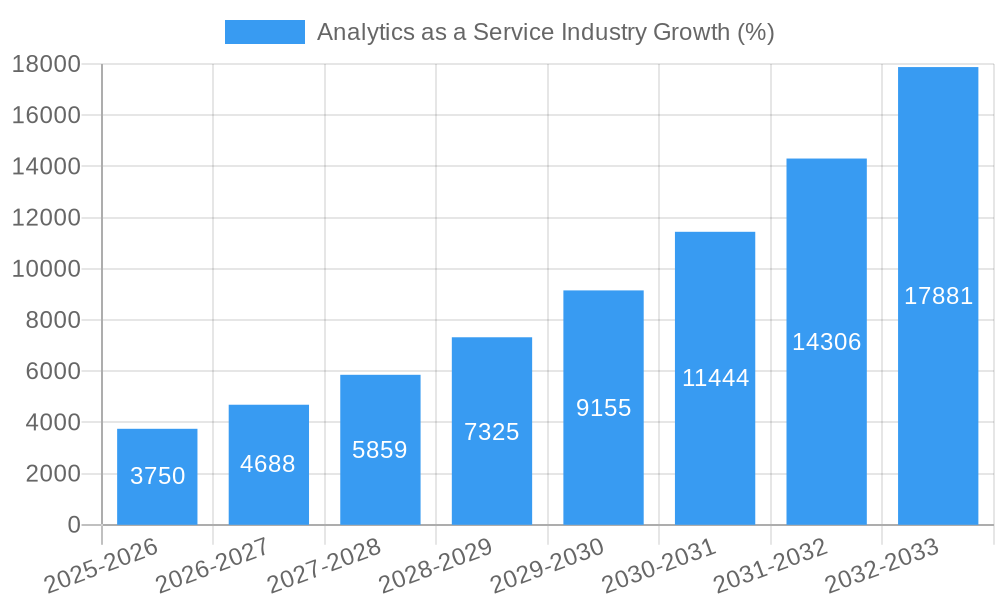
The AaaS market experienced robust growth during the historical period (2019-2024), with a CAGR of xx%. This growth is fueled by increasing data volumes, the need for real-time insights, and the rising adoption of cloud-based solutions across various industries. The market size reached xx Million in 2024 and is projected to reach xx Million by 2033, demonstrating a continued upward trajectory. Market penetration is currently at xx% and is expected to increase to xx% by 2033, driven by rising awareness and adoption among SMEs and large enterprises. Technological disruptions such as the proliferation of IoT devices and edge computing are further propelling market expansion. Consumer behavior shifts towards data-driven decision-making and the demand for predictive analytics are key contributing factors.
Dominant Regions, Countries, or Segments in Analytics as a Service Industry
North America currently dominates the AaaS market, holding approximately xx% of the global market share in 2024, followed by Europe and Asia Pacific. Within enterprise size, Large Enterprises contribute the highest revenue share (xx% in 2024), owing to their greater data volumes and need for sophisticated analytical capabilities. In terms of end-user industries, the IT & Telecommunication sector is the largest consumer of AaaS solutions (xx% market share in 2024), followed by BFSI. However, strong growth is expected from Healthcare and Retail sectors in the forecast period.
- North America: Strong presence of major technology players and high technological maturity.
- Large Enterprises: Higher budgets and complex data requirements drive higher AaaS adoption.
- IT & Telecommunication: Extensive data generation necessitates advanced analytics capabilities.
- Growth Drivers: Favorable economic policies, robust IT infrastructure, and increasing digitalization across industries.
Analytics as a Service Industry Product Landscape
The AaaS market offers a diverse range of products, including predictive analytics, descriptive analytics, prescriptive analytics, and data visualization tools. These solutions are increasingly integrated with AI and machine learning capabilities, enabling more sophisticated insights and automation. Key performance metrics include accuracy, speed of processing, ease of use, and scalability. Unique selling propositions center around customization, integration capabilities, and the ability to provide real-time insights. Technological advancements focus on improving accuracy, reducing latency, and enhancing the user experience.
Key Drivers, Barriers & Challenges in Analytics as a Service Industry
Key Drivers: Increasing data volumes, growing demand for real-time insights, rising adoption of cloud-based solutions, and the proliferation of IoT devices. Government initiatives promoting digital transformation also play a crucial role.
Key Challenges: Data security and privacy concerns, lack of skilled professionals, integration complexities, and the high cost of implementation can hinder market growth. Furthermore, vendor lock-in and the need for robust data infrastructure can present significant obstacles. Supply chain disruptions due to geopolitical factors can impact the availability of necessary hardware and software components.
Emerging Opportunities in Analytics as a Service Industry
Emerging opportunities lie in the adoption of AaaS within untapped markets like education and agriculture. Innovative applications in areas such as cybersecurity, fraud detection, and personalized medicine present significant growth potential. Evolving consumer preferences for personalized experiences drive demand for tailored AaaS solutions. The rise of edge computing and the integration of AaaS with other cloud services offer further avenues for growth.
Growth Accelerators in the Analytics as a Service Industry
Technological breakthroughs in AI and machine learning, strategic partnerships between AaaS providers and technology giants, and market expansion strategies targeting untapped sectors are major growth catalysts. Government regulations promoting data analytics adoption also accelerate market expansion. Increased investment in R&D further contributes to product innovation and expands the overall market potential.
Key Players Shaping the Analytics as a Service Industry Market
- Host Analytics Inc
- Accenture PLC
- IBM Corporation
- Microsoft Corporation
- Amazon Web Services Inc
- SAS Institute
- Atos SE
- Opera Solutions LLC
- Hewlett-Packard Enterprise Company
- Oracle Corporation
- Google Inc
- SAP SE
Notable Milestones in Analytics as a Service Industry Sector
- April 2022: Kyndryl announced its expanded partnership with SAP, enhancing digital transformation services.
- August 2022: Morae Global Corporation and Intelligent Voice Limited partnered to integrate advanced eDiscovery analytics.
In-Depth Analytics as a Service Industry Market Outlook
The AaaS market is poised for significant growth in the coming years, driven by continued technological advancements, increased adoption across diverse sectors, and strategic partnerships. The focus will shift towards more sophisticated solutions incorporating AI and machine learning, with a strong emphasis on data security and regulatory compliance. Untapped market segments and innovative applications will offer considerable opportunities for growth and expansion.
Analytics as a Service Industry Segmentation
-
1. Enterprise Size
- 1.1. Small and Medium Enterprises
- 1.2. Large Enterprises
-
2. End-User Industry
- 2.1. IT and Telecommunication
- 2.2. Energy and Power
- 2.3. BFSI
- 2.4. Healthcare
- 2.5. Retail
- 2.6. Manufacturing
- 2.7. Other End-user Industries
Analytics as a Service Industry Segmentation By Geography
- 1. North America
- 2. Europe
- 3. Asia Pacific
- 4. Latin America
- 5. Middle East and Africa
Analytics as a Service Industry REPORT HIGHLIGHTS
| Aspects | Details |
|---|---|
| Study Period | 2019-2033 |
| Base Year | 2024 |
| Estimated Year | 2025 |
| Forecast Period | 2025-2033 |
| Historical Period | 2019-2024 |
| Growth Rate | CAGR of 25.00% from 2019-2033 |
| Segmentation |
|
Table of Contents
- 1. Introduction
- 1.1. Research Scope
- 1.2. Market Segmentation
- 1.3. Research Methodology
- 1.4. Definitions and Assumptions
- 2. Executive Summary
- 2.1. Introduction
- 3. Market Dynamics
- 3.1. Introduction
- 3.2. Market Drivers
- 3.2.1. Increasing Cloud Adoption and Rise in the Data Volume Generated; Increasing Demand for Improving Organizations Internal Efficiency
- 3.3. Market Restrains
- 3.3.1. Data Security Concerns
- 3.4. Market Trends
- 3.4.1. Telecom and IT Segment to Grow Significantly
- 4. Market Factor Analysis
- 4.1. Porters Five Forces
- 4.2. Supply/Value Chain
- 4.3. PESTEL analysis
- 4.4. Market Entropy
- 4.5. Patent/Trademark Analysis
- 5. Global Analytics as a Service Industry Analysis, Insights and Forecast, 2019-2031
- 5.1. Market Analysis, Insights and Forecast - by Enterprise Size
- 5.1.1. Small and Medium Enterprises
- 5.1.2. Large Enterprises
- 5.2. Market Analysis, Insights and Forecast - by End-User Industry
- 5.2.1. IT and Telecommunication
- 5.2.2. Energy and Power
- 5.2.3. BFSI
- 5.2.4. Healthcare
- 5.2.5. Retail
- 5.2.6. Manufacturing
- 5.2.7. Other End-user Industries
- 5.3. Market Analysis, Insights and Forecast - by Region
- 5.3.1. North America
- 5.3.2. Europe
- 5.3.3. Asia Pacific
- 5.3.4. Latin America
- 5.3.5. Middle East and Africa
- 5.1. Market Analysis, Insights and Forecast - by Enterprise Size
- 6. North America Analytics as a Service Industry Analysis, Insights and Forecast, 2019-2031
- 6.1. Market Analysis, Insights and Forecast - by Enterprise Size
- 6.1.1. Small and Medium Enterprises
- 6.1.2. Large Enterprises
- 6.2. Market Analysis, Insights and Forecast - by End-User Industry
- 6.2.1. IT and Telecommunication
- 6.2.2. Energy and Power
- 6.2.3. BFSI
- 6.2.4. Healthcare
- 6.2.5. Retail
- 6.2.6. Manufacturing
- 6.2.7. Other End-user Industries
- 6.1. Market Analysis, Insights and Forecast - by Enterprise Size
- 7. Europe Analytics as a Service Industry Analysis, Insights and Forecast, 2019-2031
- 7.1. Market Analysis, Insights and Forecast - by Enterprise Size
- 7.1.1. Small and Medium Enterprises
- 7.1.2. Large Enterprises
- 7.2. Market Analysis, Insights and Forecast - by End-User Industry
- 7.2.1. IT and Telecommunication
- 7.2.2. Energy and Power
- 7.2.3. BFSI
- 7.2.4. Healthcare
- 7.2.5. Retail
- 7.2.6. Manufacturing
- 7.2.7. Other End-user Industries
- 7.1. Market Analysis, Insights and Forecast - by Enterprise Size
- 8. Asia Pacific Analytics as a Service Industry Analysis, Insights and Forecast, 2019-2031
- 8.1. Market Analysis, Insights and Forecast - by Enterprise Size
- 8.1.1. Small and Medium Enterprises
- 8.1.2. Large Enterprises
- 8.2. Market Analysis, Insights and Forecast - by End-User Industry
- 8.2.1. IT and Telecommunication
- 8.2.2. Energy and Power
- 8.2.3. BFSI
- 8.2.4. Healthcare
- 8.2.5. Retail
- 8.2.6. Manufacturing
- 8.2.7. Other End-user Industries
- 8.1. Market Analysis, Insights and Forecast - by Enterprise Size
- 9. Latin America Analytics as a Service Industry Analysis, Insights and Forecast, 2019-2031
- 9.1. Market Analysis, Insights and Forecast - by Enterprise Size
- 9.1.1. Small and Medium Enterprises
- 9.1.2. Large Enterprises
- 9.2. Market Analysis, Insights and Forecast - by End-User Industry
- 9.2.1. IT and Telecommunication
- 9.2.2. Energy and Power
- 9.2.3. BFSI
- 9.2.4. Healthcare
- 9.2.5. Retail
- 9.2.6. Manufacturing
- 9.2.7. Other End-user Industries
- 9.1. Market Analysis, Insights and Forecast - by Enterprise Size
- 10. Middle East and Africa Analytics as a Service Industry Analysis, Insights and Forecast, 2019-2031
- 10.1. Market Analysis, Insights and Forecast - by Enterprise Size
- 10.1.1. Small and Medium Enterprises
- 10.1.2. Large Enterprises
- 10.2. Market Analysis, Insights and Forecast - by End-User Industry
- 10.2.1. IT and Telecommunication
- 10.2.2. Energy and Power
- 10.2.3. BFSI
- 10.2.4. Healthcare
- 10.2.5. Retail
- 10.2.6. Manufacturing
- 10.2.7. Other End-user Industries
- 10.1. Market Analysis, Insights and Forecast - by Enterprise Size
- 11. North America Analytics as a Service Industry Analysis, Insights and Forecast, 2019-2031
- 11.1. Market Analysis, Insights and Forecast - By Country/Sub-region
- 11.1.1 United States
- 11.1.2 Canada
- 11.1.3 Mexico
- 12. Europe Analytics as a Service Industry Analysis, Insights and Forecast, 2019-2031
- 12.1. Market Analysis, Insights and Forecast - By Country/Sub-region
- 12.1.1 Germany
- 12.1.2 United Kingdom
- 12.1.3 France
- 12.1.4 Spain
- 12.1.5 Italy
- 12.1.6 Spain
- 12.1.7 Belgium
- 12.1.8 Netherland
- 12.1.9 Nordics
- 12.1.10 Rest of Europe
- 13. Asia Pacific Analytics as a Service Industry Analysis, Insights and Forecast, 2019-2031
- 13.1. Market Analysis, Insights and Forecast - By Country/Sub-region
- 13.1.1 China
- 13.1.2 Japan
- 13.1.3 India
- 13.1.4 South Korea
- 13.1.5 Southeast Asia
- 13.1.6 Australia
- 13.1.7 Indonesia
- 13.1.8 Phillipes
- 13.1.9 Singapore
- 13.1.10 Thailandc
- 13.1.11 Rest of Asia Pacific
- 14. South America Analytics as a Service Industry Analysis, Insights and Forecast, 2019-2031
- 14.1. Market Analysis, Insights and Forecast - By Country/Sub-region
- 14.1.1 Brazil
- 14.1.2 Argentina
- 14.1.3 Peru
- 14.1.4 Chile
- 14.1.5 Colombia
- 14.1.6 Ecuador
- 14.1.7 Venezuela
- 14.1.8 Rest of South America
- 15. North America Analytics as a Service Industry Analysis, Insights and Forecast, 2019-2031
- 15.1. Market Analysis, Insights and Forecast - By Country/Sub-region
- 15.1.1 United States
- 15.1.2 Canada
- 15.1.3 Mexico
- 16. MEA Analytics as a Service Industry Analysis, Insights and Forecast, 2019-2031
- 16.1. Market Analysis, Insights and Forecast - By Country/Sub-region
- 16.1.1 United Arab Emirates
- 16.1.2 Saudi Arabia
- 16.1.3 South Africa
- 16.1.4 Rest of Middle East and Africa
- 17. Competitive Analysis
- 17.1. Global Market Share Analysis 2024
- 17.2. Company Profiles
- 17.2.1 Host Analytics Inc *List Not Exhaustive
- 17.2.1.1. Overview
- 17.2.1.2. Products
- 17.2.1.3. SWOT Analysis
- 17.2.1.4. Recent Developments
- 17.2.1.5. Financials (Based on Availability)
- 17.2.2 Accenture PLC
- 17.2.2.1. Overview
- 17.2.2.2. Products
- 17.2.2.3. SWOT Analysis
- 17.2.2.4. Recent Developments
- 17.2.2.5. Financials (Based on Availability)
- 17.2.3 IBM Corporation
- 17.2.3.1. Overview
- 17.2.3.2. Products
- 17.2.3.3. SWOT Analysis
- 17.2.3.4. Recent Developments
- 17.2.3.5. Financials (Based on Availability)
- 17.2.4 Microsoft Corporation
- 17.2.4.1. Overview
- 17.2.4.2. Products
- 17.2.4.3. SWOT Analysis
- 17.2.4.4. Recent Developments
- 17.2.4.5. Financials (Based on Availability)
- 17.2.5 Amazon Web Services Inc
- 17.2.5.1. Overview
- 17.2.5.2. Products
- 17.2.5.3. SWOT Analysis
- 17.2.5.4. Recent Developments
- 17.2.5.5. Financials (Based on Availability)
- 17.2.6 SAS Institute
- 17.2.6.1. Overview
- 17.2.6.2. Products
- 17.2.6.3. SWOT Analysis
- 17.2.6.4. Recent Developments
- 17.2.6.5. Financials (Based on Availability)
- 17.2.7 Atos SE
- 17.2.7.1. Overview
- 17.2.7.2. Products
- 17.2.7.3. SWOT Analysis
- 17.2.7.4. Recent Developments
- 17.2.7.5. Financials (Based on Availability)
- 17.2.8 Opera Solutions LLC
- 17.2.8.1. Overview
- 17.2.8.2. Products
- 17.2.8.3. SWOT Analysis
- 17.2.8.4. Recent Developments
- 17.2.8.5. Financials (Based on Availability)
- 17.2.9 Hewlett-Packard Enterprise Company
- 17.2.9.1. Overview
- 17.2.9.2. Products
- 17.2.9.3. SWOT Analysis
- 17.2.9.4. Recent Developments
- 17.2.9.5. Financials (Based on Availability)
- 17.2.10 Oracle Corporation
- 17.2.10.1. Overview
- 17.2.10.2. Products
- 17.2.10.3. SWOT Analysis
- 17.2.10.4. Recent Developments
- 17.2.10.5. Financials (Based on Availability)
- 17.2.11 Google Inc
- 17.2.11.1. Overview
- 17.2.11.2. Products
- 17.2.11.3. SWOT Analysis
- 17.2.11.4. Recent Developments
- 17.2.11.5. Financials (Based on Availability)
- 17.2.12 SAP SE
- 17.2.12.1. Overview
- 17.2.12.2. Products
- 17.2.12.3. SWOT Analysis
- 17.2.12.4. Recent Developments
- 17.2.12.5. Financials (Based on Availability)
- 17.2.1 Host Analytics Inc *List Not Exhaustive
List of Figures
- Figure 1: Global Analytics as a Service Industry Revenue Breakdown (Million, %) by Region 2024 & 2032
- Figure 2: North America Analytics as a Service Industry Revenue (Million), by Country 2024 & 2032
- Figure 3: North America Analytics as a Service Industry Revenue Share (%), by Country 2024 & 2032
- Figure 4: Europe Analytics as a Service Industry Revenue (Million), by Country 2024 & 2032
- Figure 5: Europe Analytics as a Service Industry Revenue Share (%), by Country 2024 & 2032
- Figure 6: Asia Pacific Analytics as a Service Industry Revenue (Million), by Country 2024 & 2032
- Figure 7: Asia Pacific Analytics as a Service Industry Revenue Share (%), by Country 2024 & 2032
- Figure 8: South America Analytics as a Service Industry Revenue (Million), by Country 2024 & 2032
- Figure 9: South America Analytics as a Service Industry Revenue Share (%), by Country 2024 & 2032
- Figure 10: North America Analytics as a Service Industry Revenue (Million), by Country 2024 & 2032
- Figure 11: North America Analytics as a Service Industry Revenue Share (%), by Country 2024 & 2032
- Figure 12: MEA Analytics as a Service Industry Revenue (Million), by Country 2024 & 2032
- Figure 13: MEA Analytics as a Service Industry Revenue Share (%), by Country 2024 & 2032
- Figure 14: North America Analytics as a Service Industry Revenue (Million), by Enterprise Size 2024 & 2032
- Figure 15: North America Analytics as a Service Industry Revenue Share (%), by Enterprise Size 2024 & 2032
- Figure 16: North America Analytics as a Service Industry Revenue (Million), by End-User Industry 2024 & 2032
- Figure 17: North America Analytics as a Service Industry Revenue Share (%), by End-User Industry 2024 & 2032
- Figure 18: North America Analytics as a Service Industry Revenue (Million), by Country 2024 & 2032
- Figure 19: North America Analytics as a Service Industry Revenue Share (%), by Country 2024 & 2032
- Figure 20: Europe Analytics as a Service Industry Revenue (Million), by Enterprise Size 2024 & 2032
- Figure 21: Europe Analytics as a Service Industry Revenue Share (%), by Enterprise Size 2024 & 2032
- Figure 22: Europe Analytics as a Service Industry Revenue (Million), by End-User Industry 2024 & 2032
- Figure 23: Europe Analytics as a Service Industry Revenue Share (%), by End-User Industry 2024 & 2032
- Figure 24: Europe Analytics as a Service Industry Revenue (Million), by Country 2024 & 2032
- Figure 25: Europe Analytics as a Service Industry Revenue Share (%), by Country 2024 & 2032
- Figure 26: Asia Pacific Analytics as a Service Industry Revenue (Million), by Enterprise Size 2024 & 2032
- Figure 27: Asia Pacific Analytics as a Service Industry Revenue Share (%), by Enterprise Size 2024 & 2032
- Figure 28: Asia Pacific Analytics as a Service Industry Revenue (Million), by End-User Industry 2024 & 2032
- Figure 29: Asia Pacific Analytics as a Service Industry Revenue Share (%), by End-User Industry 2024 & 2032
- Figure 30: Asia Pacific Analytics as a Service Industry Revenue (Million), by Country 2024 & 2032
- Figure 31: Asia Pacific Analytics as a Service Industry Revenue Share (%), by Country 2024 & 2032
- Figure 32: Latin America Analytics as a Service Industry Revenue (Million), by Enterprise Size 2024 & 2032
- Figure 33: Latin America Analytics as a Service Industry Revenue Share (%), by Enterprise Size 2024 & 2032
- Figure 34: Latin America Analytics as a Service Industry Revenue (Million), by End-User Industry 2024 & 2032
- Figure 35: Latin America Analytics as a Service Industry Revenue Share (%), by End-User Industry 2024 & 2032
- Figure 36: Latin America Analytics as a Service Industry Revenue (Million), by Country 2024 & 2032
- Figure 37: Latin America Analytics as a Service Industry Revenue Share (%), by Country 2024 & 2032
- Figure 38: Middle East and Africa Analytics as a Service Industry Revenue (Million), by Enterprise Size 2024 & 2032
- Figure 39: Middle East and Africa Analytics as a Service Industry Revenue Share (%), by Enterprise Size 2024 & 2032
- Figure 40: Middle East and Africa Analytics as a Service Industry Revenue (Million), by End-User Industry 2024 & 2032
- Figure 41: Middle East and Africa Analytics as a Service Industry Revenue Share (%), by End-User Industry 2024 & 2032
- Figure 42: Middle East and Africa Analytics as a Service Industry Revenue (Million), by Country 2024 & 2032
- Figure 43: Middle East and Africa Analytics as a Service Industry Revenue Share (%), by Country 2024 & 2032
List of Tables
- Table 1: Global Analytics as a Service Industry Revenue Million Forecast, by Region 2019 & 2032
- Table 2: Global Analytics as a Service Industry Revenue Million Forecast, by Enterprise Size 2019 & 2032
- Table 3: Global Analytics as a Service Industry Revenue Million Forecast, by End-User Industry 2019 & 2032
- Table 4: Global Analytics as a Service Industry Revenue Million Forecast, by Region 2019 & 2032
- Table 5: Global Analytics as a Service Industry Revenue Million Forecast, by Country 2019 & 2032
- Table 6: United States Analytics as a Service Industry Revenue (Million) Forecast, by Application 2019 & 2032
- Table 7: Canada Analytics as a Service Industry Revenue (Million) Forecast, by Application 2019 & 2032
- Table 8: Mexico Analytics as a Service Industry Revenue (Million) Forecast, by Application 2019 & 2032
- Table 9: Global Analytics as a Service Industry Revenue Million Forecast, by Country 2019 & 2032
- Table 10: Germany Analytics as a Service Industry Revenue (Million) Forecast, by Application 2019 & 2032
- Table 11: United Kingdom Analytics as a Service Industry Revenue (Million) Forecast, by Application 2019 & 2032
- Table 12: France Analytics as a Service Industry Revenue (Million) Forecast, by Application 2019 & 2032
- Table 13: Spain Analytics as a Service Industry Revenue (Million) Forecast, by Application 2019 & 2032
- Table 14: Italy Analytics as a Service Industry Revenue (Million) Forecast, by Application 2019 & 2032
- Table 15: Spain Analytics as a Service Industry Revenue (Million) Forecast, by Application 2019 & 2032
- Table 16: Belgium Analytics as a Service Industry Revenue (Million) Forecast, by Application 2019 & 2032
- Table 17: Netherland Analytics as a Service Industry Revenue (Million) Forecast, by Application 2019 & 2032
- Table 18: Nordics Analytics as a Service Industry Revenue (Million) Forecast, by Application 2019 & 2032
- Table 19: Rest of Europe Analytics as a Service Industry Revenue (Million) Forecast, by Application 2019 & 2032
- Table 20: Global Analytics as a Service Industry Revenue Million Forecast, by Country 2019 & 2032
- Table 21: China Analytics as a Service Industry Revenue (Million) Forecast, by Application 2019 & 2032
- Table 22: Japan Analytics as a Service Industry Revenue (Million) Forecast, by Application 2019 & 2032
- Table 23: India Analytics as a Service Industry Revenue (Million) Forecast, by Application 2019 & 2032
- Table 24: South Korea Analytics as a Service Industry Revenue (Million) Forecast, by Application 2019 & 2032
- Table 25: Southeast Asia Analytics as a Service Industry Revenue (Million) Forecast, by Application 2019 & 2032
- Table 26: Australia Analytics as a Service Industry Revenue (Million) Forecast, by Application 2019 & 2032
- Table 27: Indonesia Analytics as a Service Industry Revenue (Million) Forecast, by Application 2019 & 2032
- Table 28: Phillipes Analytics as a Service Industry Revenue (Million) Forecast, by Application 2019 & 2032
- Table 29: Singapore Analytics as a Service Industry Revenue (Million) Forecast, by Application 2019 & 2032
- Table 30: Thailandc Analytics as a Service Industry Revenue (Million) Forecast, by Application 2019 & 2032
- Table 31: Rest of Asia Pacific Analytics as a Service Industry Revenue (Million) Forecast, by Application 2019 & 2032
- Table 32: Global Analytics as a Service Industry Revenue Million Forecast, by Country 2019 & 2032
- Table 33: Brazil Analytics as a Service Industry Revenue (Million) Forecast, by Application 2019 & 2032
- Table 34: Argentina Analytics as a Service Industry Revenue (Million) Forecast, by Application 2019 & 2032
- Table 35: Peru Analytics as a Service Industry Revenue (Million) Forecast, by Application 2019 & 2032
- Table 36: Chile Analytics as a Service Industry Revenue (Million) Forecast, by Application 2019 & 2032
- Table 37: Colombia Analytics as a Service Industry Revenue (Million) Forecast, by Application 2019 & 2032
- Table 38: Ecuador Analytics as a Service Industry Revenue (Million) Forecast, by Application 2019 & 2032
- Table 39: Venezuela Analytics as a Service Industry Revenue (Million) Forecast, by Application 2019 & 2032
- Table 40: Rest of South America Analytics as a Service Industry Revenue (Million) Forecast, by Application 2019 & 2032
- Table 41: Global Analytics as a Service Industry Revenue Million Forecast, by Country 2019 & 2032
- Table 42: United States Analytics as a Service Industry Revenue (Million) Forecast, by Application 2019 & 2032
- Table 43: Canada Analytics as a Service Industry Revenue (Million) Forecast, by Application 2019 & 2032
- Table 44: Mexico Analytics as a Service Industry Revenue (Million) Forecast, by Application 2019 & 2032
- Table 45: Global Analytics as a Service Industry Revenue Million Forecast, by Country 2019 & 2032
- Table 46: United Arab Emirates Analytics as a Service Industry Revenue (Million) Forecast, by Application 2019 & 2032
- Table 47: Saudi Arabia Analytics as a Service Industry Revenue (Million) Forecast, by Application 2019 & 2032
- Table 48: South Africa Analytics as a Service Industry Revenue (Million) Forecast, by Application 2019 & 2032
- Table 49: Rest of Middle East and Africa Analytics as a Service Industry Revenue (Million) Forecast, by Application 2019 & 2032
- Table 50: Global Analytics as a Service Industry Revenue Million Forecast, by Enterprise Size 2019 & 2032
- Table 51: Global Analytics as a Service Industry Revenue Million Forecast, by End-User Industry 2019 & 2032
- Table 52: Global Analytics as a Service Industry Revenue Million Forecast, by Country 2019 & 2032
- Table 53: Global Analytics as a Service Industry Revenue Million Forecast, by Enterprise Size 2019 & 2032
- Table 54: Global Analytics as a Service Industry Revenue Million Forecast, by End-User Industry 2019 & 2032
- Table 55: Global Analytics as a Service Industry Revenue Million Forecast, by Country 2019 & 2032
- Table 56: Global Analytics as a Service Industry Revenue Million Forecast, by Enterprise Size 2019 & 2032
- Table 57: Global Analytics as a Service Industry Revenue Million Forecast, by End-User Industry 2019 & 2032
- Table 58: Global Analytics as a Service Industry Revenue Million Forecast, by Country 2019 & 2032
- Table 59: Global Analytics as a Service Industry Revenue Million Forecast, by Enterprise Size 2019 & 2032
- Table 60: Global Analytics as a Service Industry Revenue Million Forecast, by End-User Industry 2019 & 2032
- Table 61: Global Analytics as a Service Industry Revenue Million Forecast, by Country 2019 & 2032
- Table 62: Global Analytics as a Service Industry Revenue Million Forecast, by Enterprise Size 2019 & 2032
- Table 63: Global Analytics as a Service Industry Revenue Million Forecast, by End-User Industry 2019 & 2032
- Table 64: Global Analytics as a Service Industry Revenue Million Forecast, by Country 2019 & 2032
Frequently Asked Questions
1. What is the projected Compound Annual Growth Rate (CAGR) of the Analytics as a Service Industry?
The projected CAGR is approximately 25.00%.
2. Which companies are prominent players in the Analytics as a Service Industry?
Key companies in the market include Host Analytics Inc *List Not Exhaustive, Accenture PLC, IBM Corporation, Microsoft Corporation, Amazon Web Services Inc, SAS Institute, Atos SE, Opera Solutions LLC, Hewlett-Packard Enterprise Company, Oracle Corporation, Google Inc, SAP SE.
3. What are the main segments of the Analytics as a Service Industry?
The market segments include Enterprise Size, End-User Industry.
4. Can you provide details about the market size?
The market size is estimated to be USD XX Million as of 2022.
5. What are some drivers contributing to market growth?
Increasing Cloud Adoption and Rise in the Data Volume Generated; Increasing Demand for Improving Organizations Internal Efficiency.
6. What are the notable trends driving market growth?
Telecom and IT Segment to Grow Significantly.
7. Are there any restraints impacting market growth?
Data Security Concerns.
8. Can you provide examples of recent developments in the market?
April 2022 - Kyndryl announced the expansion of strategic partnership with SAP to assist customers in overcoming digital transformation challenges Kyndryl will provide services that complement the RISE with an SAP solution, such as proven migration tools and scalable offerings, AI-driven business data management and analytics solutions, application modernization, and more, as part of the expanded collaboration.
9. What pricing options are available for accessing the report?
Pricing options include single-user, multi-user, and enterprise licenses priced at USD 4750, USD 5250, and USD 8750 respectively.
10. Is the market size provided in terms of value or volume?
The market size is provided in terms of value, measured in Million.
11. Are there any specific market keywords associated with the report?
Yes, the market keyword associated with the report is "Analytics as a Service Industry," which aids in identifying and referencing the specific market segment covered.
12. How do I determine which pricing option suits my needs best?
The pricing options vary based on user requirements and access needs. Individual users may opt for single-user licenses, while businesses requiring broader access may choose multi-user or enterprise licenses for cost-effective access to the report.
13. Are there any additional resources or data provided in the Analytics as a Service Industry report?
While the report offers comprehensive insights, it's advisable to review the specific contents or supplementary materials provided to ascertain if additional resources or data are available.
14. How can I stay updated on further developments or reports in the Analytics as a Service Industry?
To stay informed about further developments, trends, and reports in the Analytics as a Service Industry, consider subscribing to industry newsletters, following relevant companies and organizations, or regularly checking reputable industry news sources and publications.
Methodology
Step 1 - Identification of Relevant Samples Size from Population Database


Step 2 - Approaches for Defining Global Market Size (Value, Volume* & Price*)

Note*: In applicable scenarios
Step 3 - Data Sources
Primary Research
- Web Analytics
- Survey Reports
- Research Institute
- Latest Research Reports
- Opinion Leaders
Secondary Research
- Annual Reports
- White Paper
- Latest Press Release
- Industry Association
- Paid Database
- Investor Presentations

Step 4 - Data Triangulation
Involves using different sources of information in order to increase the validity of a study
These sources are likely to be stakeholders in a program - participants, other researchers, program staff, other community members, and so on.
Then we put all data in single framework & apply various statistical tools to find out the dynamic on the market.
During the analysis stage, feedback from the stakeholder groups would be compared to determine areas of agreement as well as areas of divergence


