
Key Insights
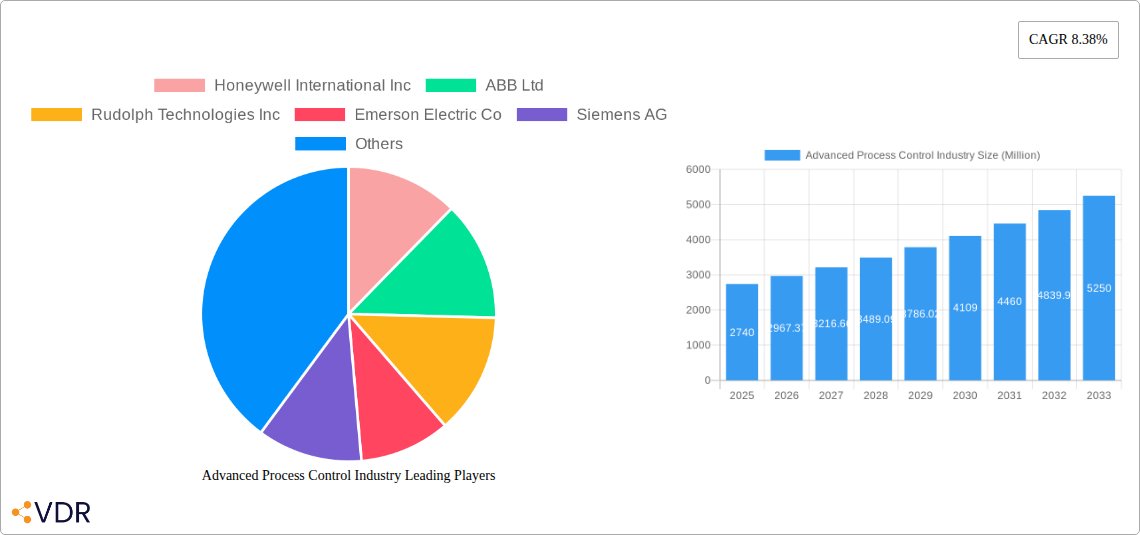
The Advanced Process Control (APC) market is experiencing robust growth, projected to reach a substantial size with a Compound Annual Growth Rate (CAGR) of 8.38% from 2025 to 2033. This expansion is driven by several key factors. Increasing automation across various industries, particularly oil and gas, petrochemicals, and pharmaceuticals, necessitates sophisticated control systems for optimizing efficiency and reducing operational costs. The demand for improved product quality, reduced waste, and enhanced safety is fueling the adoption of advanced control technologies like Model Predictive Control (MPC) and Advanced Regulatory Control (ARC). Furthermore, the growing emphasis on data analytics and the Internet of Things (IoT) integration within industrial processes is creating new opportunities for APC vendors to offer comprehensive solutions that leverage real-time data for better decision-making and process optimization. The market segmentation reveals a significant share held by the Oil and Gas sector, owing to its substantial investment in automation and efficiency improvements. However, other sectors like Pharmaceuticals and Food & Beverage are also exhibiting strong growth, driven by the stringent quality and regulatory requirements within these industries. Competition among established players like Honeywell, ABB, and Siemens, alongside emerging technology providers, is fostering innovation and driving down costs, making APC solutions more accessible to a broader range of businesses.
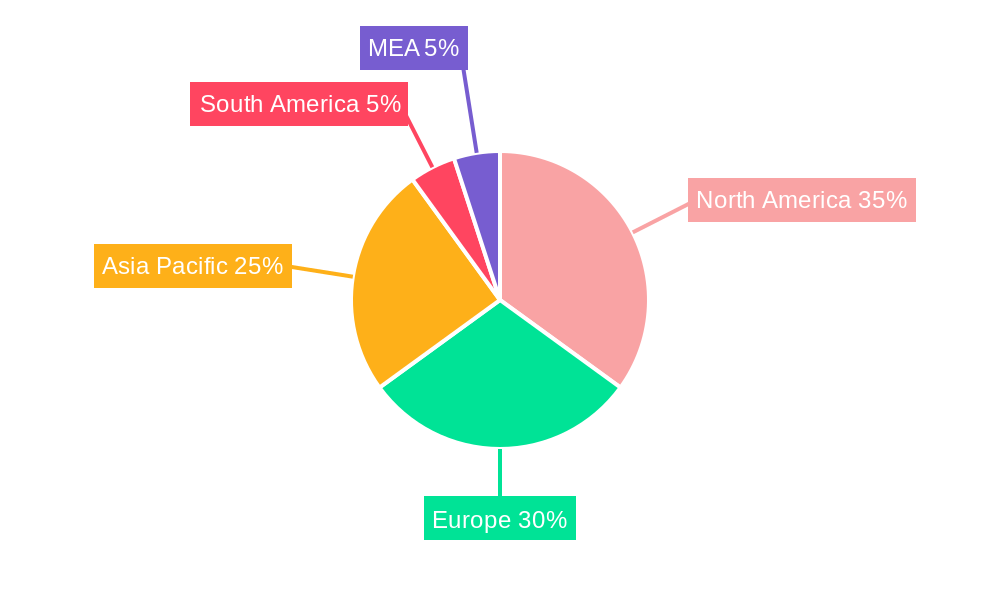
The geographical distribution of the APC market showcases a strong presence in North America and Europe, historically the leading adopters of advanced industrial automation. However, the Asia-Pacific region is poised for significant growth, driven by rapid industrialization and increasing investments in manufacturing and energy infrastructure. While North America and Europe are expected to maintain substantial market shares, the emerging economies in Asia and South America present considerable untapped potential. The ongoing development of new APC technologies, such as Artificial Intelligence (AI) and Machine Learning (ML) integrated systems, will further accelerate market growth, improving predictive capabilities and enabling proactive adjustments to optimize processes more effectively. This suggests that the APC market will continue its upward trajectory, driven by technological advancements and the growing need for efficient and reliable process control across a variety of industries worldwide.
Advanced Process Control Industry Market Report: 2019-2033
This comprehensive report provides a detailed analysis of the Advanced Process Control (APC) industry, encompassing market dynamics, growth trends, regional dominance, product landscape, key players, and future outlook. With a study period spanning 2019-2033, a base year of 2025, and a forecast period of 2025-2033, this report offers invaluable insights for industry professionals, investors, and strategic decision-makers. The market is segmented by type (Advanced Regulatory Control, Model Predictive Control, Inferential, Sequential, and Compressor Control) and end-user vertical (Oil and Gas, Petrochemical, Pharmaceutical, Food and Beverage, Energy and Power, Chemical, Other End-user Verticals). The total market size is projected to reach xx Million by 2033.
Advanced Process Control Industry Market Dynamics & Structure
The Advanced Process Control market is characterized by moderate concentration, with key players like Honeywell, ABB, and Emerson holding significant market share, estimated at 45% collectively in 2025. Technological innovation, particularly in AI and machine learning integration, is a major driver, alongside stringent regulatory frameworks promoting efficiency and sustainability. Competitive substitutes exist, primarily in the form of legacy control systems, but APC's superior optimization capabilities are increasingly favoring its adoption. The M&A activity in this space has been relatively consistent, with approximately xx deals recorded in the last 5 years, indicating consolidation and expansion strategies by established players.
- Market Concentration: Highly concentrated, with top 5 players holding approximately 45% market share in 2025.
- Technological Innovation: AI/ML integration, cloud-based solutions, and digital twin technologies are driving growth.
- Regulatory Frameworks: Stringent emission standards and energy efficiency regulations are boosting APC adoption.
- Competitive Substitutes: Legacy control systems offer competition but lack APC’s advanced optimization capabilities.
- M&A Activity: Approximately xx mergers and acquisitions over the past five years, indicating market consolidation.
- End-User Demographics: Growing demand from large-scale industrial operations across various sectors.
Advanced Process Control Industry Growth Trends & Insights
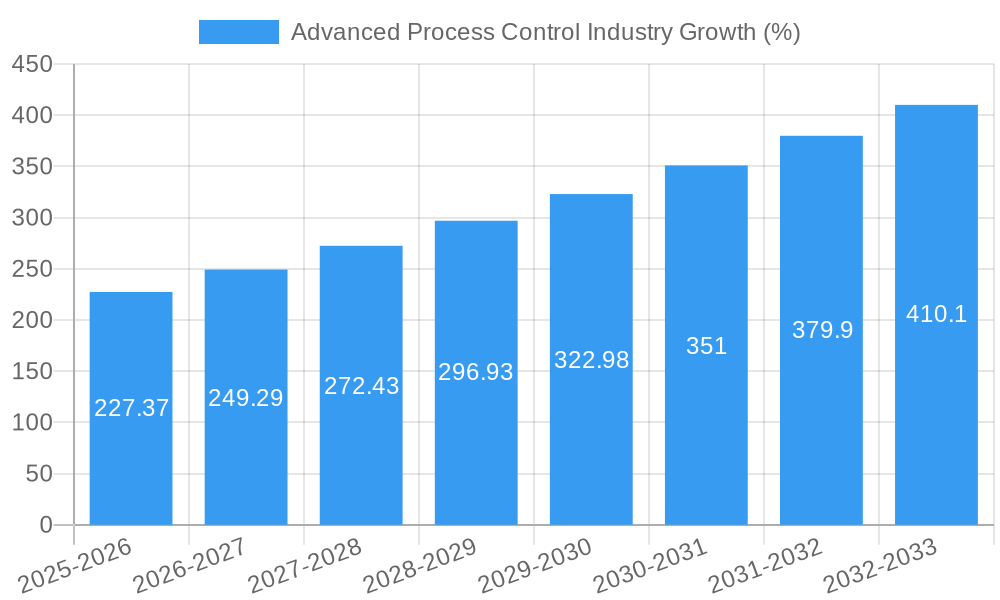
The APC market exhibits robust growth, driven by increasing automation needs, the rising complexity of industrial processes, and the urgent need for operational efficiency and cost reduction. The market size expanded from xx Million in 2019 to xx Million in 2024, demonstrating a CAGR of xx%. This growth is further fueled by the adoption of advanced analytics and the increasing integration of industrial IoT (IIoT) technologies. Consumer behavior shifts towards sustainability and the demand for enhanced product quality are also contributing factors. Technological disruptions like the emergence of AI-powered solutions are accelerating market expansion and improving process optimization capabilities. Market penetration is projected to reach xx% by 2033.
Dominant Regions, Countries, or Segments in Advanced Process Control Industry
North America and Europe currently dominate the APC market, driven by robust industrial infrastructure, technological advancements, and high adoption rates across major end-user verticals. Within the segments, Model Predictive Control (MPC) holds the largest share, due to its advanced optimization capabilities and ability to handle complex processes. The Oil and Gas sector leads end-user adoption, owing to its high capital expenditure on process optimization and the need for enhanced production efficiency. Asia-Pacific is poised for significant growth due to rapid industrialization and increasing investment in automation.
- Leading Region: North America, followed by Europe.
- Leading Segment (By Type): Model Predictive Control (MPC).
- Leading End-user Vertical: Oil and Gas.
- Key Drivers (North America): Strong industrial base, technological innovation, early adoption of advanced technologies.
- Key Drivers (Europe): Stringent environmental regulations, focus on energy efficiency.
- Key Drivers (Asia-Pacific): Rapid industrialization, increasing investment in automation.
Advanced Process Control Industry Product Landscape
The APC product landscape features advanced regulatory control systems, model predictive controllers, inferential control systems, and more specialized solutions like compressor controls and sequential controllers. These systems are continually evolving, with advanced functionalities like AI integration, machine learning algorithms, and cloud-based platforms enhancing their capabilities. Unique selling propositions focus on improved process optimization, reduced energy consumption, enhanced product quality, and streamlined operations. New advancements include real-time data analytics and predictive maintenance capabilities.
Key Drivers, Barriers & Challenges in Advanced Process Control Industry
Key Drivers: The primary drivers are increasing demand for operational efficiency, cost optimization, the need for improved product quality, and stricter environmental regulations. Technological advancements like AI and ML further accelerate market growth.
Key Barriers and Challenges: High initial investment costs, the complexity of implementation, a lack of skilled workforce, and integration challenges with existing systems pose significant barriers. Furthermore, the cybersecurity risks associated with interconnected systems and the dependence on reliable data infrastructure present ongoing challenges. These barriers collectively impact market penetration and potentially decrease the CAGR by approximately xx%.
Emerging Opportunities in Advanced Process Control Industry
Significant opportunities exist in untapped markets like developing economies with burgeoning industrial sectors. The integration of APC with emerging technologies like digital twins, blockchain, and edge computing presents substantial growth potential. Furthermore, new applications in areas such as renewable energy, sustainable manufacturing, and smart cities are creating new avenues for market expansion.
Growth Accelerators in the Advanced Process Control Industry
Long-term growth will be fueled by continued technological breakthroughs, particularly in AI, machine learning, and the IIoT. Strategic partnerships between APC vendors and end-user industries will facilitate wider adoption. Expanding into new geographical markets and developing tailored solutions for specific industries will further drive growth.
Key Players Shaping the Advanced Process Control Industry Market
- Honeywell International Inc
- ABB Ltd
- Rudolph Technologies Inc
- Emerson Electric Co
- Siemens AG
- General Electric Co
- Schneider Electric SE
- Rockwell Automation Inc
- Yokogawa Electric Corp
- Aspen Technology Inc
Notable Milestones in Advanced Process Control Industry Sector
- December 2023: Schneider Electric collaborates with National Power Investment Group Digital Technology Co. Ltd to explore the smart aluminum market, showcasing the expanding applications of APC in new industries.
- October 2023: ABB launches ABB Ability™ Expert Optimizer, demonstrating successful deployment and quantifiable benefits (3% reduction in thermal energy consumption) in a major industrial setting.
In-Depth Advanced Process Control Industry Market Outlook
The future of the APC market appears promising, with significant growth potential driven by the factors discussed above. Strategic investments in research and development, coupled with targeted market expansion and strategic partnerships, will be crucial for success in this dynamic and evolving market. The market's continued focus on sustainable practices and optimized efficiency will drive even greater adoption rates across various sectors in the coming years.
Advanced Process Control Industry Segmentation
-
1. Type
- 1.1. Advanced Regulatory Control
- 1.2. Model Predictive Control
- 1.3. Other Types
-
2. End-user Industry
- 2.1. Oil and Gas
- 2.2. Chemicals and Petrochemicals
- 2.3. Pharmaceutical
- 2.4. Food and Beverage
- 2.5. Energy and Power
- 2.6. Cement Industry
- 2.7. Metal Processing
- 2.8. Pulp and Paper
- 2.9. Other End-user Industries
Advanced Process Control Industry Segmentation By Geography
- 1. North America
- 2. Europe
- 3. Asia
- 4. Australia and New Zealand
- 5. Latin America
- 6. Middle East and Africa
Advanced Process Control Industry REPORT HIGHLIGHTS
| Aspects | Details |
|---|---|
| Study Period | 2019-2033 |
| Base Year | 2024 |
| Estimated Year | 2025 |
| Forecast Period | 2025-2033 |
| Historical Period | 2019-2024 |
| Growth Rate | CAGR of 8.38% from 2019-2033 |
| Segmentation |
|
Table of Contents
- 1. Introduction
- 1.1. Research Scope
- 1.2. Market Segmentation
- 1.3. Research Methodology
- 1.4. Definitions and Assumptions
- 2. Executive Summary
- 2.1. Introduction
- 3. Market Dynamics
- 3.1. Introduction
- 3.2. Market Drivers
- 3.2.1. Increasing Demand for Automation Solutions across Various Industries; Rising Safety and Security Concerns are Expected to Boost the Demand for APC Systems; Inclination of Enterprises Toward Energy-efficient Processes
- 3.3. Market Restrains
- 3.3.1. Associated Complexities Challenge the Market Growth
- 3.4. Market Trends
- 3.4.1. Oil and Gas is Expected to be the Largest Segment
- 4. Market Factor Analysis
- 4.1. Porters Five Forces
- 4.2. Supply/Value Chain
- 4.3. PESTEL analysis
- 4.4. Market Entropy
- 4.5. Patent/Trademark Analysis
- 5. Global Advanced Process Control Industry Analysis, Insights and Forecast, 2019-2031
- 5.1. Market Analysis, Insights and Forecast - by Type
- 5.1.1. Advanced Regulatory Control
- 5.1.2. Model Predictive Control
- 5.1.3. Other Types
- 5.2. Market Analysis, Insights and Forecast - by End-user Industry
- 5.2.1. Oil and Gas
- 5.2.2. Chemicals and Petrochemicals
- 5.2.3. Pharmaceutical
- 5.2.4. Food and Beverage
- 5.2.5. Energy and Power
- 5.2.6. Cement Industry
- 5.2.7. Metal Processing
- 5.2.8. Pulp and Paper
- 5.2.9. Other End-user Industries
- 5.3. Market Analysis, Insights and Forecast - by Region
- 5.3.1. North America
- 5.3.2. Europe
- 5.3.3. Asia
- 5.3.4. Australia and New Zealand
- 5.3.5. Latin America
- 5.3.6. Middle East and Africa
- 5.1. Market Analysis, Insights and Forecast - by Type
- 6. North America Advanced Process Control Industry Analysis, Insights and Forecast, 2019-2031
- 6.1. Market Analysis, Insights and Forecast - by Type
- 6.1.1. Advanced Regulatory Control
- 6.1.2. Model Predictive Control
- 6.1.3. Other Types
- 6.2. Market Analysis, Insights and Forecast - by End-user Industry
- 6.2.1. Oil and Gas
- 6.2.2. Chemicals and Petrochemicals
- 6.2.3. Pharmaceutical
- 6.2.4. Food and Beverage
- 6.2.5. Energy and Power
- 6.2.6. Cement Industry
- 6.2.7. Metal Processing
- 6.2.8. Pulp and Paper
- 6.2.9. Other End-user Industries
- 6.1. Market Analysis, Insights and Forecast - by Type
- 7. Europe Advanced Process Control Industry Analysis, Insights and Forecast, 2019-2031
- 7.1. Market Analysis, Insights and Forecast - by Type
- 7.1.1. Advanced Regulatory Control
- 7.1.2. Model Predictive Control
- 7.1.3. Other Types
- 7.2. Market Analysis, Insights and Forecast - by End-user Industry
- 7.2.1. Oil and Gas
- 7.2.2. Chemicals and Petrochemicals
- 7.2.3. Pharmaceutical
- 7.2.4. Food and Beverage
- 7.2.5. Energy and Power
- 7.2.6. Cement Industry
- 7.2.7. Metal Processing
- 7.2.8. Pulp and Paper
- 7.2.9. Other End-user Industries
- 7.1. Market Analysis, Insights and Forecast - by Type
- 8. Asia Advanced Process Control Industry Analysis, Insights and Forecast, 2019-2031
- 8.1. Market Analysis, Insights and Forecast - by Type
- 8.1.1. Advanced Regulatory Control
- 8.1.2. Model Predictive Control
- 8.1.3. Other Types
- 8.2. Market Analysis, Insights and Forecast - by End-user Industry
- 8.2.1. Oil and Gas
- 8.2.2. Chemicals and Petrochemicals
- 8.2.3. Pharmaceutical
- 8.2.4. Food and Beverage
- 8.2.5. Energy and Power
- 8.2.6. Cement Industry
- 8.2.7. Metal Processing
- 8.2.8. Pulp and Paper
- 8.2.9. Other End-user Industries
- 8.1. Market Analysis, Insights and Forecast - by Type
- 9. Australia and New Zealand Advanced Process Control Industry Analysis, Insights and Forecast, 2019-2031
- 9.1. Market Analysis, Insights and Forecast - by Type
- 9.1.1. Advanced Regulatory Control
- 9.1.2. Model Predictive Control
- 9.1.3. Other Types
- 9.2. Market Analysis, Insights and Forecast - by End-user Industry
- 9.2.1. Oil and Gas
- 9.2.2. Chemicals and Petrochemicals
- 9.2.3. Pharmaceutical
- 9.2.4. Food and Beverage
- 9.2.5. Energy and Power
- 9.2.6. Cement Industry
- 9.2.7. Metal Processing
- 9.2.8. Pulp and Paper
- 9.2.9. Other End-user Industries
- 9.1. Market Analysis, Insights and Forecast - by Type
- 10. Latin America Advanced Process Control Industry Analysis, Insights and Forecast, 2019-2031
- 10.1. Market Analysis, Insights and Forecast - by Type
- 10.1.1. Advanced Regulatory Control
- 10.1.2. Model Predictive Control
- 10.1.3. Other Types
- 10.2. Market Analysis, Insights and Forecast - by End-user Industry
- 10.2.1. Oil and Gas
- 10.2.2. Chemicals and Petrochemicals
- 10.2.3. Pharmaceutical
- 10.2.4. Food and Beverage
- 10.2.5. Energy and Power
- 10.2.6. Cement Industry
- 10.2.7. Metal Processing
- 10.2.8. Pulp and Paper
- 10.2.9. Other End-user Industries
- 10.1. Market Analysis, Insights and Forecast - by Type
- 11. Middle East and Africa Advanced Process Control Industry Analysis, Insights and Forecast, 2019-2031
- 11.1. Market Analysis, Insights and Forecast - by Type
- 11.1.1. Advanced Regulatory Control
- 11.1.2. Model Predictive Control
- 11.1.3. Other Types
- 11.2. Market Analysis, Insights and Forecast - by End-user Industry
- 11.2.1. Oil and Gas
- 11.2.2. Chemicals and Petrochemicals
- 11.2.3. Pharmaceutical
- 11.2.4. Food and Beverage
- 11.2.5. Energy and Power
- 11.2.6. Cement Industry
- 11.2.7. Metal Processing
- 11.2.8. Pulp and Paper
- 11.2.9. Other End-user Industries
- 11.1. Market Analysis, Insights and Forecast - by Type
- 12. North America Advanced Process Control Industry Analysis, Insights and Forecast, 2019-2031
- 12.1. Market Analysis, Insights and Forecast - By Country/Sub-region
- 12.1.1 United States
- 12.1.2 Canada
- 12.1.3 Mexico
- 13. Europe Advanced Process Control Industry Analysis, Insights and Forecast, 2019-2031
- 13.1. Market Analysis, Insights and Forecast - By Country/Sub-region
- 13.1.1 Germany
- 13.1.2 United Kingdom
- 13.1.3 France
- 13.1.4 Spain
- 13.1.5 Italy
- 13.1.6 Spain
- 13.1.7 Belgium
- 13.1.8 Netherland
- 13.1.9 Nordics
- 13.1.10 Rest of Europe
- 14. Asia Pacific Advanced Process Control Industry Analysis, Insights and Forecast, 2019-2031
- 14.1. Market Analysis, Insights and Forecast - By Country/Sub-region
- 14.1.1 China
- 14.1.2 Japan
- 14.1.3 India
- 14.1.4 South Korea
- 14.1.5 Southeast Asia
- 14.1.6 Australia
- 14.1.7 Indonesia
- 14.1.8 Phillipes
- 14.1.9 Singapore
- 14.1.10 Thailandc
- 14.1.11 Rest of Asia Pacific
- 15. South America Advanced Process Control Industry Analysis, Insights and Forecast, 2019-2031
- 15.1. Market Analysis, Insights and Forecast - By Country/Sub-region
- 15.1.1 Brazil
- 15.1.2 Argentina
- 15.1.3 Peru
- 15.1.4 Chile
- 15.1.5 Colombia
- 15.1.6 Ecuador
- 15.1.7 Venezuela
- 15.1.8 Rest of South America
- 16. North America Advanced Process Control Industry Analysis, Insights and Forecast, 2019-2031
- 16.1. Market Analysis, Insights and Forecast - By Country/Sub-region
- 16.1.1 United States
- 16.1.2 Canada
- 16.1.3 Mexico
- 17. MEA Advanced Process Control Industry Analysis, Insights and Forecast, 2019-2031
- 17.1. Market Analysis, Insights and Forecast - By Country/Sub-region
- 17.1.1 United Arab Emirates
- 17.1.2 Saudi Arabia
- 17.1.3 South Africa
- 17.1.4 Rest of Middle East and Africa
- 18. Competitive Analysis
- 18.1. Global Market Share Analysis 2024
- 18.2. Company Profiles
- 18.2.1 Honeywell International Inc
- 18.2.1.1. Overview
- 18.2.1.2. Products
- 18.2.1.3. SWOT Analysis
- 18.2.1.4. Recent Developments
- 18.2.1.5. Financials (Based on Availability)
- 18.2.2 ABB Ltd
- 18.2.2.1. Overview
- 18.2.2.2. Products
- 18.2.2.3. SWOT Analysis
- 18.2.2.4. Recent Developments
- 18.2.2.5. Financials (Based on Availability)
- 18.2.3 Rudolph Technologies Inc
- 18.2.3.1. Overview
- 18.2.3.2. Products
- 18.2.3.3. SWOT Analysis
- 18.2.3.4. Recent Developments
- 18.2.3.5. Financials (Based on Availability)
- 18.2.4 Emerson Electric Co
- 18.2.4.1. Overview
- 18.2.4.2. Products
- 18.2.4.3. SWOT Analysis
- 18.2.4.4. Recent Developments
- 18.2.4.5. Financials (Based on Availability)
- 18.2.5 Siemens AG
- 18.2.5.1. Overview
- 18.2.5.2. Products
- 18.2.5.3. SWOT Analysis
- 18.2.5.4. Recent Developments
- 18.2.5.5. Financials (Based on Availability)
- 18.2.6 General Electric Co
- 18.2.6.1. Overview
- 18.2.6.2. Products
- 18.2.6.3. SWOT Analysis
- 18.2.6.4. Recent Developments
- 18.2.6.5. Financials (Based on Availability)
- 18.2.7 Schneider Electric SE
- 18.2.7.1. Overview
- 18.2.7.2. Products
- 18.2.7.3. SWOT Analysis
- 18.2.7.4. Recent Developments
- 18.2.7.5. Financials (Based on Availability)
- 18.2.8 Rockwell Automation Inc
- 18.2.8.1. Overview
- 18.2.8.2. Products
- 18.2.8.3. SWOT Analysis
- 18.2.8.4. Recent Developments
- 18.2.8.5. Financials (Based on Availability)
- 18.2.9 Yokogawa Electric Corp
- 18.2.9.1. Overview
- 18.2.9.2. Products
- 18.2.9.3. SWOT Analysis
- 18.2.9.4. Recent Developments
- 18.2.9.5. Financials (Based on Availability)
- 18.2.10 Aspen Technology Inc
- 18.2.10.1. Overview
- 18.2.10.2. Products
- 18.2.10.3. SWOT Analysis
- 18.2.10.4. Recent Developments
- 18.2.10.5. Financials (Based on Availability)
- 18.2.1 Honeywell International Inc
List of Figures
- Figure 1: Global Advanced Process Control Industry Revenue Breakdown (Million, %) by Region 2024 & 2032
- Figure 2: North America Advanced Process Control Industry Revenue (Million), by Country 2024 & 2032
- Figure 3: North America Advanced Process Control Industry Revenue Share (%), by Country 2024 & 2032
- Figure 4: Europe Advanced Process Control Industry Revenue (Million), by Country 2024 & 2032
- Figure 5: Europe Advanced Process Control Industry Revenue Share (%), by Country 2024 & 2032
- Figure 6: Asia Pacific Advanced Process Control Industry Revenue (Million), by Country 2024 & 2032
- Figure 7: Asia Pacific Advanced Process Control Industry Revenue Share (%), by Country 2024 & 2032
- Figure 8: South America Advanced Process Control Industry Revenue (Million), by Country 2024 & 2032
- Figure 9: South America Advanced Process Control Industry Revenue Share (%), by Country 2024 & 2032
- Figure 10: North America Advanced Process Control Industry Revenue (Million), by Country 2024 & 2032
- Figure 11: North America Advanced Process Control Industry Revenue Share (%), by Country 2024 & 2032
- Figure 12: MEA Advanced Process Control Industry Revenue (Million), by Country 2024 & 2032
- Figure 13: MEA Advanced Process Control Industry Revenue Share (%), by Country 2024 & 2032
- Figure 14: North America Advanced Process Control Industry Revenue (Million), by Type 2024 & 2032
- Figure 15: North America Advanced Process Control Industry Revenue Share (%), by Type 2024 & 2032
- Figure 16: North America Advanced Process Control Industry Revenue (Million), by End-user Industry 2024 & 2032
- Figure 17: North America Advanced Process Control Industry Revenue Share (%), by End-user Industry 2024 & 2032
- Figure 18: North America Advanced Process Control Industry Revenue (Million), by Country 2024 & 2032
- Figure 19: North America Advanced Process Control Industry Revenue Share (%), by Country 2024 & 2032
- Figure 20: Europe Advanced Process Control Industry Revenue (Million), by Type 2024 & 2032
- Figure 21: Europe Advanced Process Control Industry Revenue Share (%), by Type 2024 & 2032
- Figure 22: Europe Advanced Process Control Industry Revenue (Million), by End-user Industry 2024 & 2032
- Figure 23: Europe Advanced Process Control Industry Revenue Share (%), by End-user Industry 2024 & 2032
- Figure 24: Europe Advanced Process Control Industry Revenue (Million), by Country 2024 & 2032
- Figure 25: Europe Advanced Process Control Industry Revenue Share (%), by Country 2024 & 2032
- Figure 26: Asia Advanced Process Control Industry Revenue (Million), by Type 2024 & 2032
- Figure 27: Asia Advanced Process Control Industry Revenue Share (%), by Type 2024 & 2032
- Figure 28: Asia Advanced Process Control Industry Revenue (Million), by End-user Industry 2024 & 2032
- Figure 29: Asia Advanced Process Control Industry Revenue Share (%), by End-user Industry 2024 & 2032
- Figure 30: Asia Advanced Process Control Industry Revenue (Million), by Country 2024 & 2032
- Figure 31: Asia Advanced Process Control Industry Revenue Share (%), by Country 2024 & 2032
- Figure 32: Australia and New Zealand Advanced Process Control Industry Revenue (Million), by Type 2024 & 2032
- Figure 33: Australia and New Zealand Advanced Process Control Industry Revenue Share (%), by Type 2024 & 2032
- Figure 34: Australia and New Zealand Advanced Process Control Industry Revenue (Million), by End-user Industry 2024 & 2032
- Figure 35: Australia and New Zealand Advanced Process Control Industry Revenue Share (%), by End-user Industry 2024 & 2032
- Figure 36: Australia and New Zealand Advanced Process Control Industry Revenue (Million), by Country 2024 & 2032
- Figure 37: Australia and New Zealand Advanced Process Control Industry Revenue Share (%), by Country 2024 & 2032
- Figure 38: Latin America Advanced Process Control Industry Revenue (Million), by Type 2024 & 2032
- Figure 39: Latin America Advanced Process Control Industry Revenue Share (%), by Type 2024 & 2032
- Figure 40: Latin America Advanced Process Control Industry Revenue (Million), by End-user Industry 2024 & 2032
- Figure 41: Latin America Advanced Process Control Industry Revenue Share (%), by End-user Industry 2024 & 2032
- Figure 42: Latin America Advanced Process Control Industry Revenue (Million), by Country 2024 & 2032
- Figure 43: Latin America Advanced Process Control Industry Revenue Share (%), by Country 2024 & 2032
- Figure 44: Middle East and Africa Advanced Process Control Industry Revenue (Million), by Type 2024 & 2032
- Figure 45: Middle East and Africa Advanced Process Control Industry Revenue Share (%), by Type 2024 & 2032
- Figure 46: Middle East and Africa Advanced Process Control Industry Revenue (Million), by End-user Industry 2024 & 2032
- Figure 47: Middle East and Africa Advanced Process Control Industry Revenue Share (%), by End-user Industry 2024 & 2032
- Figure 48: Middle East and Africa Advanced Process Control Industry Revenue (Million), by Country 2024 & 2032
- Figure 49: Middle East and Africa Advanced Process Control Industry Revenue Share (%), by Country 2024 & 2032
List of Tables
- Table 1: Global Advanced Process Control Industry Revenue Million Forecast, by Region 2019 & 2032
- Table 2: Global Advanced Process Control Industry Revenue Million Forecast, by Type 2019 & 2032
- Table 3: Global Advanced Process Control Industry Revenue Million Forecast, by End-user Industry 2019 & 2032
- Table 4: Global Advanced Process Control Industry Revenue Million Forecast, by Region 2019 & 2032
- Table 5: Global Advanced Process Control Industry Revenue Million Forecast, by Country 2019 & 2032
- Table 6: United States Advanced Process Control Industry Revenue (Million) Forecast, by Application 2019 & 2032
- Table 7: Canada Advanced Process Control Industry Revenue (Million) Forecast, by Application 2019 & 2032
- Table 8: Mexico Advanced Process Control Industry Revenue (Million) Forecast, by Application 2019 & 2032
- Table 9: Global Advanced Process Control Industry Revenue Million Forecast, by Country 2019 & 2032
- Table 10: Germany Advanced Process Control Industry Revenue (Million) Forecast, by Application 2019 & 2032
- Table 11: United Kingdom Advanced Process Control Industry Revenue (Million) Forecast, by Application 2019 & 2032
- Table 12: France Advanced Process Control Industry Revenue (Million) Forecast, by Application 2019 & 2032
- Table 13: Spain Advanced Process Control Industry Revenue (Million) Forecast, by Application 2019 & 2032
- Table 14: Italy Advanced Process Control Industry Revenue (Million) Forecast, by Application 2019 & 2032
- Table 15: Spain Advanced Process Control Industry Revenue (Million) Forecast, by Application 2019 & 2032
- Table 16: Belgium Advanced Process Control Industry Revenue (Million) Forecast, by Application 2019 & 2032
- Table 17: Netherland Advanced Process Control Industry Revenue (Million) Forecast, by Application 2019 & 2032
- Table 18: Nordics Advanced Process Control Industry Revenue (Million) Forecast, by Application 2019 & 2032
- Table 19: Rest of Europe Advanced Process Control Industry Revenue (Million) Forecast, by Application 2019 & 2032
- Table 20: Global Advanced Process Control Industry Revenue Million Forecast, by Country 2019 & 2032
- Table 21: China Advanced Process Control Industry Revenue (Million) Forecast, by Application 2019 & 2032
- Table 22: Japan Advanced Process Control Industry Revenue (Million) Forecast, by Application 2019 & 2032
- Table 23: India Advanced Process Control Industry Revenue (Million) Forecast, by Application 2019 & 2032
- Table 24: South Korea Advanced Process Control Industry Revenue (Million) Forecast, by Application 2019 & 2032
- Table 25: Southeast Asia Advanced Process Control Industry Revenue (Million) Forecast, by Application 2019 & 2032
- Table 26: Australia Advanced Process Control Industry Revenue (Million) Forecast, by Application 2019 & 2032
- Table 27: Indonesia Advanced Process Control Industry Revenue (Million) Forecast, by Application 2019 & 2032
- Table 28: Phillipes Advanced Process Control Industry Revenue (Million) Forecast, by Application 2019 & 2032
- Table 29: Singapore Advanced Process Control Industry Revenue (Million) Forecast, by Application 2019 & 2032
- Table 30: Thailandc Advanced Process Control Industry Revenue (Million) Forecast, by Application 2019 & 2032
- Table 31: Rest of Asia Pacific Advanced Process Control Industry Revenue (Million) Forecast, by Application 2019 & 2032
- Table 32: Global Advanced Process Control Industry Revenue Million Forecast, by Country 2019 & 2032
- Table 33: Brazil Advanced Process Control Industry Revenue (Million) Forecast, by Application 2019 & 2032
- Table 34: Argentina Advanced Process Control Industry Revenue (Million) Forecast, by Application 2019 & 2032
- Table 35: Peru Advanced Process Control Industry Revenue (Million) Forecast, by Application 2019 & 2032
- Table 36: Chile Advanced Process Control Industry Revenue (Million) Forecast, by Application 2019 & 2032
- Table 37: Colombia Advanced Process Control Industry Revenue (Million) Forecast, by Application 2019 & 2032
- Table 38: Ecuador Advanced Process Control Industry Revenue (Million) Forecast, by Application 2019 & 2032
- Table 39: Venezuela Advanced Process Control Industry Revenue (Million) Forecast, by Application 2019 & 2032
- Table 40: Rest of South America Advanced Process Control Industry Revenue (Million) Forecast, by Application 2019 & 2032
- Table 41: Global Advanced Process Control Industry Revenue Million Forecast, by Country 2019 & 2032
- Table 42: United States Advanced Process Control Industry Revenue (Million) Forecast, by Application 2019 & 2032
- Table 43: Canada Advanced Process Control Industry Revenue (Million) Forecast, by Application 2019 & 2032
- Table 44: Mexico Advanced Process Control Industry Revenue (Million) Forecast, by Application 2019 & 2032
- Table 45: Global Advanced Process Control Industry Revenue Million Forecast, by Country 2019 & 2032
- Table 46: United Arab Emirates Advanced Process Control Industry Revenue (Million) Forecast, by Application 2019 & 2032
- Table 47: Saudi Arabia Advanced Process Control Industry Revenue (Million) Forecast, by Application 2019 & 2032
- Table 48: South Africa Advanced Process Control Industry Revenue (Million) Forecast, by Application 2019 & 2032
- Table 49: Rest of Middle East and Africa Advanced Process Control Industry Revenue (Million) Forecast, by Application 2019 & 2032
- Table 50: Global Advanced Process Control Industry Revenue Million Forecast, by Type 2019 & 2032
- Table 51: Global Advanced Process Control Industry Revenue Million Forecast, by End-user Industry 2019 & 2032
- Table 52: Global Advanced Process Control Industry Revenue Million Forecast, by Country 2019 & 2032
- Table 53: Global Advanced Process Control Industry Revenue Million Forecast, by Type 2019 & 2032
- Table 54: Global Advanced Process Control Industry Revenue Million Forecast, by End-user Industry 2019 & 2032
- Table 55: Global Advanced Process Control Industry Revenue Million Forecast, by Country 2019 & 2032
- Table 56: Global Advanced Process Control Industry Revenue Million Forecast, by Type 2019 & 2032
- Table 57: Global Advanced Process Control Industry Revenue Million Forecast, by End-user Industry 2019 & 2032
- Table 58: Global Advanced Process Control Industry Revenue Million Forecast, by Country 2019 & 2032
- Table 59: Global Advanced Process Control Industry Revenue Million Forecast, by Type 2019 & 2032
- Table 60: Global Advanced Process Control Industry Revenue Million Forecast, by End-user Industry 2019 & 2032
- Table 61: Global Advanced Process Control Industry Revenue Million Forecast, by Country 2019 & 2032
- Table 62: Global Advanced Process Control Industry Revenue Million Forecast, by Type 2019 & 2032
- Table 63: Global Advanced Process Control Industry Revenue Million Forecast, by End-user Industry 2019 & 2032
- Table 64: Global Advanced Process Control Industry Revenue Million Forecast, by Country 2019 & 2032
- Table 65: Global Advanced Process Control Industry Revenue Million Forecast, by Type 2019 & 2032
- Table 66: Global Advanced Process Control Industry Revenue Million Forecast, by End-user Industry 2019 & 2032
- Table 67: Global Advanced Process Control Industry Revenue Million Forecast, by Country 2019 & 2032
Frequently Asked Questions
1. What is the projected Compound Annual Growth Rate (CAGR) of the Advanced Process Control Industry?
The projected CAGR is approximately 8.38%.
2. Which companies are prominent players in the Advanced Process Control Industry?
Key companies in the market include Honeywell International Inc, ABB Ltd, Rudolph Technologies Inc, Emerson Electric Co, Siemens AG, General Electric Co, Schneider Electric SE, Rockwell Automation Inc, Yokogawa Electric Corp, Aspen Technology Inc.
3. What are the main segments of the Advanced Process Control Industry?
The market segments include Type, End-user Industry.
4. Can you provide details about the market size?
The market size is estimated to be USD 2.74 Million as of 2022.
5. What are some drivers contributing to market growth?
Increasing Demand for Automation Solutions across Various Industries; Rising Safety and Security Concerns are Expected to Boost the Demand for APC Systems; Inclination of Enterprises Toward Energy-efficient Processes.
6. What are the notable trends driving market growth?
Oil and Gas is Expected to be the Largest Segment.
7. Are there any restraints impacting market growth?
Associated Complexities Challenge the Market Growth.
8. Can you provide examples of recent developments in the market?
December 2023: Schneider Electric collaborated with National Power Investment Group Digital Technology Co. Ltd (hereafter referred to as "Power Investment Digital Division") to jointly explore the smart aluminum (electrolytic aluminum, alumina) market. As part of the agreement, Schneider Electric and Power Investment Data will collaborate extensively in smart factories and smart manufacturing based on their vast accumulation and application experience in new-generation information technology and digital technology.
9. What pricing options are available for accessing the report?
Pricing options include single-user, multi-user, and enterprise licenses priced at USD 4750, USD 5250, and USD 8750 respectively.
10. Is the market size provided in terms of value or volume?
The market size is provided in terms of value, measured in Million.
11. Are there any specific market keywords associated with the report?
Yes, the market keyword associated with the report is "Advanced Process Control Industry," which aids in identifying and referencing the specific market segment covered.
12. How do I determine which pricing option suits my needs best?
The pricing options vary based on user requirements and access needs. Individual users may opt for single-user licenses, while businesses requiring broader access may choose multi-user or enterprise licenses for cost-effective access to the report.
13. Are there any additional resources or data provided in the Advanced Process Control Industry report?
While the report offers comprehensive insights, it's advisable to review the specific contents or supplementary materials provided to ascertain if additional resources or data are available.
14. How can I stay updated on further developments or reports in the Advanced Process Control Industry?
To stay informed about further developments, trends, and reports in the Advanced Process Control Industry, consider subscribing to industry newsletters, following relevant companies and organizations, or regularly checking reputable industry news sources and publications.
Methodology
Step 1 - Identification of Relevant Samples Size from Population Database


Step 2 - Approaches for Defining Global Market Size (Value, Volume* & Price*)

Note*: In applicable scenarios
Step 3 - Data Sources
Primary Research
- Web Analytics
- Survey Reports
- Research Institute
- Latest Research Reports
- Opinion Leaders
Secondary Research
- Annual Reports
- White Paper
- Latest Press Release
- Industry Association
- Paid Database
- Investor Presentations

Step 4 - Data Triangulation
Involves using different sources of information in order to increase the validity of a study
These sources are likely to be stakeholders in a program - participants, other researchers, program staff, other community members, and so on.
Then we put all data in single framework & apply various statistical tools to find out the dynamic on the market.
During the analysis stage, feedback from the stakeholder groups would be compared to determine areas of agreement as well as areas of divergence


