
Key Insights
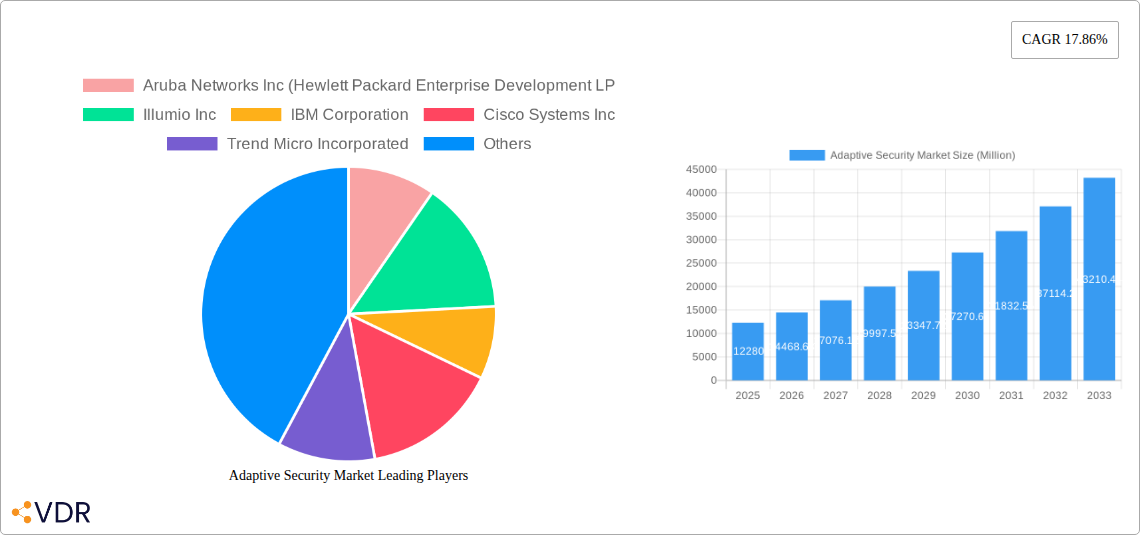
The adaptive security market, valued at $12.28 billion in 2025, is experiencing robust growth, projected to expand at a compound annual growth rate (CAGR) of 17.86% from 2025 to 2033. This significant expansion is driven by several key factors. The increasing sophistication of cyber threats, coupled with the rise of cloud computing and remote work environments, necessitates agile and adaptable security solutions. Businesses across all sectors, particularly BFSI, government and defense, and healthcare, are prioritizing investments in adaptive security to mitigate evolving risks like ransomware, advanced persistent threats (APTs), and insider threats. The shift towards cloud-based deployments is also fueling market growth, as organizations seek solutions that can seamlessly protect their hybrid and multi-cloud infrastructures. Furthermore, the growing adoption of artificial intelligence (AI) and machine learning (ML) in security solutions is enhancing their ability to proactively detect and respond to threats, further boosting market demand.
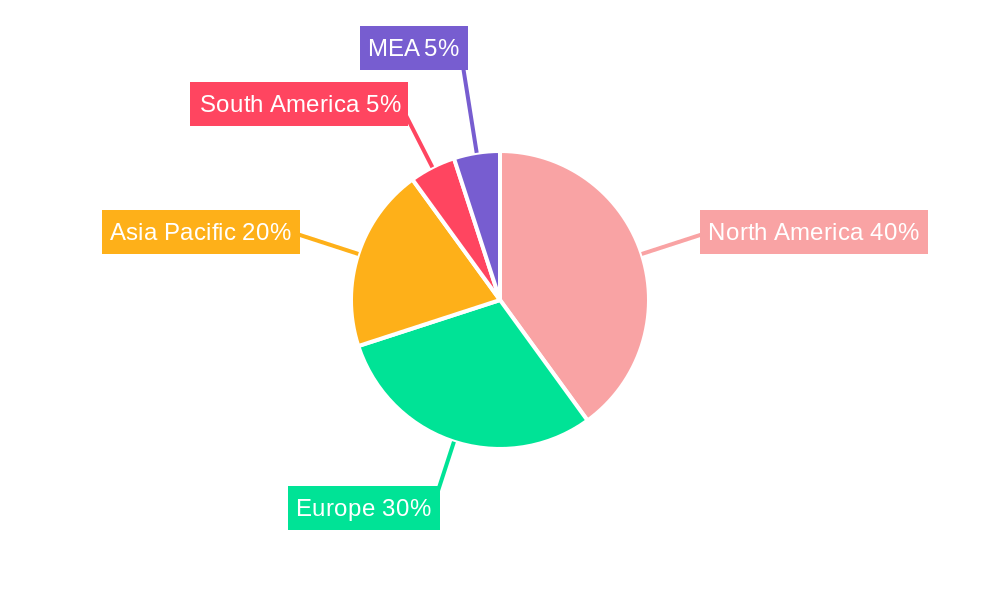
The market segmentation reveals a diverse landscape. While the service offering currently dominates, the solution segment is expected to witness substantial growth driven by the increasing need for comprehensive, integrated security platforms. Within deployment models, cloud-based solutions are gaining traction, reflecting the broader industry shift towards cloud adoption. Among end-users, the BFSI sector leads in adoption due to the stringent regulatory requirements and the high value of sensitive data. However, significant growth is anticipated from other sectors like healthcare and manufacturing, as they increasingly recognize the criticality of robust cybersecurity defenses. Geographical analysis suggests North America and Europe will remain dominant markets, but the Asia-Pacific region, particularly China and India, presents a significant growth opportunity due to rising digitalization and increasing cybersecurity awareness. Competition is fierce, with established players like Cisco, IBM, and Palo Alto Networks alongside innovative startups vying for market share. This dynamic competitive environment is likely to drive further innovation and market consolidation in the coming years.
Adaptive Security Market: A Comprehensive Report (2019-2033)
This comprehensive report provides an in-depth analysis of the Adaptive Security Market, encompassing market dynamics, growth trends, regional dominance, product landscape, key players, and future outlook. With a study period spanning 2019-2033, a base year of 2025, and a forecast period of 2025-2033, this report is an invaluable resource for industry professionals, investors, and strategic decision-makers. The market is segmented by application (Application Security, Network Security, Endpoint Security, Cloud Security), offering (Service, Solution), deployment model (On-premise, Cloud), and end-user (BFSI, Government & Defense, Manufacturing, Healthcare, Energy & Utilities, IT & Telecom, Other). The total market size is projected to reach xx Million by 2033.
Adaptive Security Market Dynamics & Structure
The Adaptive Security Market exhibits a moderately concentrated structure, with several key players holding significant market share. Technological innovation, particularly in AI and machine learning, is a primary driver, pushing the market toward more sophisticated and proactive security solutions. Stringent regulatory frameworks, like GDPR and CCPA, further fuel demand for robust adaptive security measures. The market also witnesses continuous evolution with competitive product substitutes and mergers & acquisitions (M&A) activities.
- Market Concentration: The top 5 players hold an estimated xx% market share in 2025.
- Technological Innovation: AI-driven threat intelligence and automation are key drivers.
- Regulatory Landscape: Compliance with data privacy regulations boosts demand.
- M&A Activity: The past five years have seen xx M&A deals, consolidating market share.
- End-User Demographics: BFSI and Government & Defense sectors are major consumers.
- Innovation Barriers: High R&D costs and skilled labor shortages pose challenges.
Adaptive Security Market Growth Trends & Insights
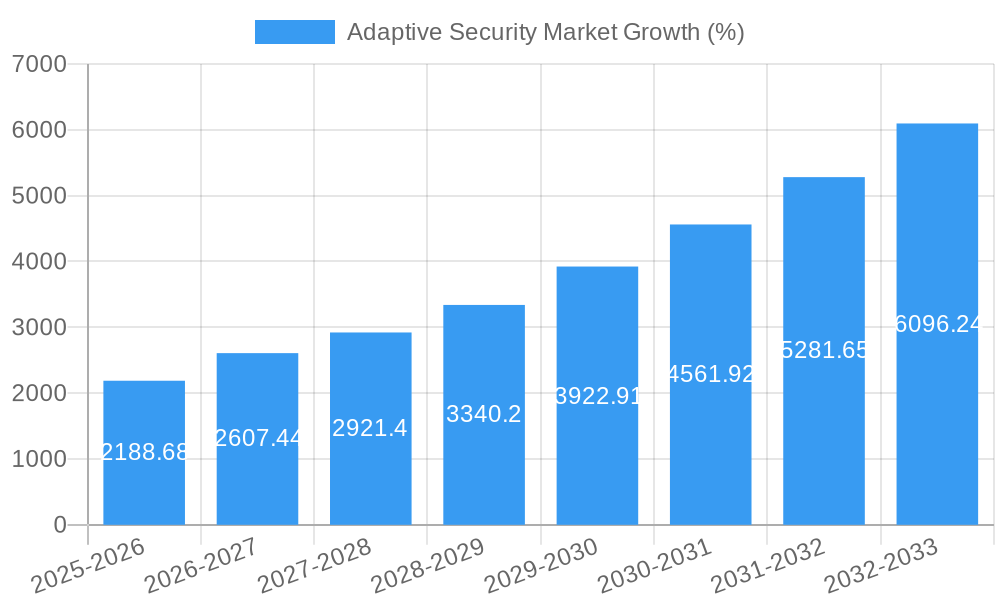
The Adaptive Security Market is experiencing robust growth, driven by increasing cyber threats and the expanding adoption of cloud technologies and IoT devices. The market size grew from xx Million in 2019 to xx Million in 2024, exhibiting a CAGR of xx%. This upward trajectory is expected to continue, with a projected CAGR of xx% during the forecast period (2025-2033). The increasing adoption of cloud-based solutions and the growing need for proactive threat detection and response contribute to high market penetration. Technological disruptions, such as the rise of AI-powered security solutions, are reshaping market dynamics and driving adoption rates. Consumer behavior shifts are also visible, with organizations moving towards holistic security approaches instead of siloed systems.
Dominant Regions, Countries, or Segments in Adaptive Security Market
North America currently holds the largest market share, followed by Europe. Within the application segment, Cloud Security is experiencing the fastest growth, driven by the increasing adoption of cloud computing. The BFSI sector dominates end-user spending due to stringent regulatory requirements and the high value of financial data.
- Leading Region: North America (Market Share: xx% in 2025)
- Fastest-Growing Segment (By Application): Cloud Security (CAGR: xx% during 2025-2033)
- Dominant End-User: BFSI (Market Share: xx% in 2025)
- Key Drivers (North America): Strong IT infrastructure, high cybersecurity awareness, and significant government investment.
- Key Drivers (Europe): Stringent data privacy regulations (GDPR) and rising cybercrime rates.
- Growth Potential: Asia-Pacific region is poised for significant growth due to increasing digitalization.
Adaptive Security Market Product Landscape
Adaptive security solutions are increasingly incorporating advanced technologies like AI, machine learning, and behavioral analytics to provide proactive threat detection and response. These solutions offer improved visibility, automation, and adaptability to evolving threats, surpassing the capabilities of traditional security measures. Unique selling propositions often include seamless integration with existing security systems, streamlined workflows, and reduced operational costs.
Key Drivers, Barriers & Challenges in Adaptive Security Market
Key Drivers:
- Rising cyber threats and data breaches.
- Increasing adoption of cloud and IoT technologies.
- Growing demand for proactive security solutions.
- Stringent data privacy regulations.
Challenges and Restraints:
- High implementation costs and complexity.
- Skill shortage in cybersecurity professionals.
- Integration challenges with existing security systems.
- Difficulty in maintaining real-time threat intelligence.
Emerging Opportunities in Adaptive Security Market
The market offers several emerging opportunities. These include:
- Expanding into untapped markets like emerging economies.
- Development of specialized solutions for niche industries (e.g., healthcare, automotive).
- Leveraging AI and machine learning for advanced threat detection.
- Offering managed security services (MSSP) to cater to SMBs.
Growth Accelerators in the Adaptive Security Market Industry
Strategic partnerships between security vendors and MSSPs are driving market expansion. Technological advancements like AI and automation are streamlining security operations and improving threat detection capabilities. Market expansion into emerging economies, driven by increasing digitalization and investment in cybersecurity infrastructure, represents a key catalyst.
Key Players Shaping the Adaptive Security Market Market
- Aruba Networks Inc (Hewlett Packard Enterprise Development LP)
- Illumio Inc
- IBM Corporation
- Cisco Systems Inc
- Trend Micro Incorporated
- Juniper Networks Inc
- Rapid7 Inc
- Lumen Technologies Inc
- Panda Security Inc (Watchguard Technologies Inc)
- Trellix (STG Partners LLC)
Notable Milestones in Adaptive Security Market Sector
- February 2024: Build38 launches Next Gen AI-Powered Active Hardening technology for mobile app security.
- January 2024: Trellix expands its strategic partnership with One Source, enhancing its XDR platform capabilities.
In-Depth Adaptive Security Market Market Outlook
The Adaptive Security Market is poised for continued strong growth, driven by increasing cybersecurity threats, the expanding adoption of cloud and IoT technologies, and the growing need for proactive security solutions. Strategic partnerships, technological advancements, and market expansion into emerging economies will further accelerate this growth, presenting significant opportunities for established players and new entrants alike. The market's future is bright, and continued innovation will be key to navigating the ever-evolving landscape of cybersecurity.
Adaptive Security Market Segmentation
-
1. Application
- 1.1. Application Security
- 1.2. Network Security
- 1.3. End Point Security
- 1.4. Cloud Security
-
2. Offering
- 2.1. Service
- 2.2. Solution
-
3. Deployment Model
- 3.1. On-premise
- 3.2. Cloud
-
4. End User
- 4.1. BFSI
- 4.2. Government and Defense
- 4.3. Manufacturing
- 4.4. Healthcare
- 4.5. Energy and Utilities
- 4.6. IT and Telecom
- 4.7. Other End Users
Adaptive Security Market Segmentation By Geography
- 1. North America
- 2. Europe
- 3. Asia
- 4. Australia and New Zealand
- 5. Latin America
- 6. Middle East and Africa
Adaptive Security Market REPORT HIGHLIGHTS
| Aspects | Details |
|---|---|
| Study Period | 2019-2033 |
| Base Year | 2024 |
| Estimated Year | 2025 |
| Forecast Period | 2025-2033 |
| Historical Period | 2019-2024 |
| Growth Rate | CAGR of 17.86% from 2019-2033 |
| Segmentation |
|
Table of Contents
- 1. Introduction
- 1.1. Research Scope
- 1.2. Market Segmentation
- 1.3. Research Methodology
- 1.4. Definitions and Assumptions
- 2. Executive Summary
- 2.1. Introduction
- 3. Market Dynamics
- 3.1. Introduction
- 3.2. Market Drivers
- 3.2.1. Need to Secure IT Resources from Advanced Cyberattacks; Need for Security Compliances and Regulations
- 3.3. Market Restrains
- 3.3.1. Lack of Skilled Cyber Security Professionals
- 3.4. Market Trends
- 3.4.1. Cloud Deployment Model to Witness Major Growth
- 4. Market Factor Analysis
- 4.1. Porters Five Forces
- 4.2. Supply/Value Chain
- 4.3. PESTEL analysis
- 4.4. Market Entropy
- 4.5. Patent/Trademark Analysis
- 5. Global Adaptive Security Market Analysis, Insights and Forecast, 2019-2031
- 5.1. Market Analysis, Insights and Forecast - by Application
- 5.1.1. Application Security
- 5.1.2. Network Security
- 5.1.3. End Point Security
- 5.1.4. Cloud Security
- 5.2. Market Analysis, Insights and Forecast - by Offering
- 5.2.1. Service
- 5.2.2. Solution
- 5.3. Market Analysis, Insights and Forecast - by Deployment Model
- 5.3.1. On-premise
- 5.3.2. Cloud
- 5.4. Market Analysis, Insights and Forecast - by End User
- 5.4.1. BFSI
- 5.4.2. Government and Defense
- 5.4.3. Manufacturing
- 5.4.4. Healthcare
- 5.4.5. Energy and Utilities
- 5.4.6. IT and Telecom
- 5.4.7. Other End Users
- 5.5. Market Analysis, Insights and Forecast - by Region
- 5.5.1. North America
- 5.5.2. Europe
- 5.5.3. Asia
- 5.5.4. Australia and New Zealand
- 5.5.5. Latin America
- 5.5.6. Middle East and Africa
- 5.1. Market Analysis, Insights and Forecast - by Application
- 6. North America Adaptive Security Market Analysis, Insights and Forecast, 2019-2031
- 6.1. Market Analysis, Insights and Forecast - by Application
- 6.1.1. Application Security
- 6.1.2. Network Security
- 6.1.3. End Point Security
- 6.1.4. Cloud Security
- 6.2. Market Analysis, Insights and Forecast - by Offering
- 6.2.1. Service
- 6.2.2. Solution
- 6.3. Market Analysis, Insights and Forecast - by Deployment Model
- 6.3.1. On-premise
- 6.3.2. Cloud
- 6.4. Market Analysis, Insights and Forecast - by End User
- 6.4.1. BFSI
- 6.4.2. Government and Defense
- 6.4.3. Manufacturing
- 6.4.4. Healthcare
- 6.4.5. Energy and Utilities
- 6.4.6. IT and Telecom
- 6.4.7. Other End Users
- 6.1. Market Analysis, Insights and Forecast - by Application
- 7. Europe Adaptive Security Market Analysis, Insights and Forecast, 2019-2031
- 7.1. Market Analysis, Insights and Forecast - by Application
- 7.1.1. Application Security
- 7.1.2. Network Security
- 7.1.3. End Point Security
- 7.1.4. Cloud Security
- 7.2. Market Analysis, Insights and Forecast - by Offering
- 7.2.1. Service
- 7.2.2. Solution
- 7.3. Market Analysis, Insights and Forecast - by Deployment Model
- 7.3.1. On-premise
- 7.3.2. Cloud
- 7.4. Market Analysis, Insights and Forecast - by End User
- 7.4.1. BFSI
- 7.4.2. Government and Defense
- 7.4.3. Manufacturing
- 7.4.4. Healthcare
- 7.4.5. Energy and Utilities
- 7.4.6. IT and Telecom
- 7.4.7. Other End Users
- 7.1. Market Analysis, Insights and Forecast - by Application
- 8. Asia Adaptive Security Market Analysis, Insights and Forecast, 2019-2031
- 8.1. Market Analysis, Insights and Forecast - by Application
- 8.1.1. Application Security
- 8.1.2. Network Security
- 8.1.3. End Point Security
- 8.1.4. Cloud Security
- 8.2. Market Analysis, Insights and Forecast - by Offering
- 8.2.1. Service
- 8.2.2. Solution
- 8.3. Market Analysis, Insights and Forecast - by Deployment Model
- 8.3.1. On-premise
- 8.3.2. Cloud
- 8.4. Market Analysis, Insights and Forecast - by End User
- 8.4.1. BFSI
- 8.4.2. Government and Defense
- 8.4.3. Manufacturing
- 8.4.4. Healthcare
- 8.4.5. Energy and Utilities
- 8.4.6. IT and Telecom
- 8.4.7. Other End Users
- 8.1. Market Analysis, Insights and Forecast - by Application
- 9. Australia and New Zealand Adaptive Security Market Analysis, Insights and Forecast, 2019-2031
- 9.1. Market Analysis, Insights and Forecast - by Application
- 9.1.1. Application Security
- 9.1.2. Network Security
- 9.1.3. End Point Security
- 9.1.4. Cloud Security
- 9.2. Market Analysis, Insights and Forecast - by Offering
- 9.2.1. Service
- 9.2.2. Solution
- 9.3. Market Analysis, Insights and Forecast - by Deployment Model
- 9.3.1. On-premise
- 9.3.2. Cloud
- 9.4. Market Analysis, Insights and Forecast - by End User
- 9.4.1. BFSI
- 9.4.2. Government and Defense
- 9.4.3. Manufacturing
- 9.4.4. Healthcare
- 9.4.5. Energy and Utilities
- 9.4.6. IT and Telecom
- 9.4.7. Other End Users
- 9.1. Market Analysis, Insights and Forecast - by Application
- 10. Latin America Adaptive Security Market Analysis, Insights and Forecast, 2019-2031
- 10.1. Market Analysis, Insights and Forecast - by Application
- 10.1.1. Application Security
- 10.1.2. Network Security
- 10.1.3. End Point Security
- 10.1.4. Cloud Security
- 10.2. Market Analysis, Insights and Forecast - by Offering
- 10.2.1. Service
- 10.2.2. Solution
- 10.3. Market Analysis, Insights and Forecast - by Deployment Model
- 10.3.1. On-premise
- 10.3.2. Cloud
- 10.4. Market Analysis, Insights and Forecast - by End User
- 10.4.1. BFSI
- 10.4.2. Government and Defense
- 10.4.3. Manufacturing
- 10.4.4. Healthcare
- 10.4.5. Energy and Utilities
- 10.4.6. IT and Telecom
- 10.4.7. Other End Users
- 10.1. Market Analysis, Insights and Forecast - by Application
- 11. Middle East and Africa Adaptive Security Market Analysis, Insights and Forecast, 2019-2031
- 11.1. Market Analysis, Insights and Forecast - by Application
- 11.1.1. Application Security
- 11.1.2. Network Security
- 11.1.3. End Point Security
- 11.1.4. Cloud Security
- 11.2. Market Analysis, Insights and Forecast - by Offering
- 11.2.1. Service
- 11.2.2. Solution
- 11.3. Market Analysis, Insights and Forecast - by Deployment Model
- 11.3.1. On-premise
- 11.3.2. Cloud
- 11.4. Market Analysis, Insights and Forecast - by End User
- 11.4.1. BFSI
- 11.4.2. Government and Defense
- 11.4.3. Manufacturing
- 11.4.4. Healthcare
- 11.4.5. Energy and Utilities
- 11.4.6. IT and Telecom
- 11.4.7. Other End Users
- 11.1. Market Analysis, Insights and Forecast - by Application
- 12. North America Adaptive Security Market Analysis, Insights and Forecast, 2019-2031
- 12.1. Market Analysis, Insights and Forecast - By Country/Sub-region
- 12.1.1 United States
- 12.1.2 Canada
- 12.1.3 Mexico
- 13. Europe Adaptive Security Market Analysis, Insights and Forecast, 2019-2031
- 13.1. Market Analysis, Insights and Forecast - By Country/Sub-region
- 13.1.1 Germany
- 13.1.2 United Kingdom
- 13.1.3 France
- 13.1.4 Spain
- 13.1.5 Italy
- 13.1.6 Spain
- 13.1.7 Belgium
- 13.1.8 Netherland
- 13.1.9 Nordics
- 13.1.10 Rest of Europe
- 14. Asia Pacific Adaptive Security Market Analysis, Insights and Forecast, 2019-2031
- 14.1. Market Analysis, Insights and Forecast - By Country/Sub-region
- 14.1.1 China
- 14.1.2 Japan
- 14.1.3 India
- 14.1.4 South Korea
- 14.1.5 Southeast Asia
- 14.1.6 Australia
- 14.1.7 Indonesia
- 14.1.8 Phillipes
- 14.1.9 Singapore
- 14.1.10 Thailandc
- 14.1.11 Rest of Asia Pacific
- 15. South America Adaptive Security Market Analysis, Insights and Forecast, 2019-2031
- 15.1. Market Analysis, Insights and Forecast - By Country/Sub-region
- 15.1.1 Brazil
- 15.1.2 Argentina
- 15.1.3 Peru
- 15.1.4 Chile
- 15.1.5 Colombia
- 15.1.6 Ecuador
- 15.1.7 Venezuela
- 15.1.8 Rest of South America
- 16. North America Adaptive Security Market Analysis, Insights and Forecast, 2019-2031
- 16.1. Market Analysis, Insights and Forecast - By Country/Sub-region
- 16.1.1 United States
- 16.1.2 Canada
- 16.1.3 Mexico
- 17. MEA Adaptive Security Market Analysis, Insights and Forecast, 2019-2031
- 17.1. Market Analysis, Insights and Forecast - By Country/Sub-region
- 17.1.1 United Arab Emirates
- 17.1.2 Saudi Arabia
- 17.1.3 South Africa
- 17.1.4 Rest of Middle East and Africa
- 18. Competitive Analysis
- 18.1. Global Market Share Analysis 2024
- 18.2. Company Profiles
- 18.2.1 Aruba Networks Inc (Hewlett Packard Enterprise Development LP
- 18.2.1.1. Overview
- 18.2.1.2. Products
- 18.2.1.3. SWOT Analysis
- 18.2.1.4. Recent Developments
- 18.2.1.5. Financials (Based on Availability)
- 18.2.2 Illumio Inc
- 18.2.2.1. Overview
- 18.2.2.2. Products
- 18.2.2.3. SWOT Analysis
- 18.2.2.4. Recent Developments
- 18.2.2.5. Financials (Based on Availability)
- 18.2.3 IBM Corporation
- 18.2.3.1. Overview
- 18.2.3.2. Products
- 18.2.3.3. SWOT Analysis
- 18.2.3.4. Recent Developments
- 18.2.3.5. Financials (Based on Availability)
- 18.2.4 Cisco Systems Inc
- 18.2.4.1. Overview
- 18.2.4.2. Products
- 18.2.4.3. SWOT Analysis
- 18.2.4.4. Recent Developments
- 18.2.4.5. Financials (Based on Availability)
- 18.2.5 Trend Micro Incorporated
- 18.2.5.1. Overview
- 18.2.5.2. Products
- 18.2.5.3. SWOT Analysis
- 18.2.5.4. Recent Developments
- 18.2.5.5. Financials (Based on Availability)
- 18.2.6 Juniper Networks Inc
- 18.2.6.1. Overview
- 18.2.6.2. Products
- 18.2.6.3. SWOT Analysis
- 18.2.6.4. Recent Developments
- 18.2.6.5. Financials (Based on Availability)
- 18.2.7 Rapid7 Inc
- 18.2.7.1. Overview
- 18.2.7.2. Products
- 18.2.7.3. SWOT Analysis
- 18.2.7.4. Recent Developments
- 18.2.7.5. Financials (Based on Availability)
- 18.2.8 Lumen Technologies Inc
- 18.2.8.1. Overview
- 18.2.8.2. Products
- 18.2.8.3. SWOT Analysis
- 18.2.8.4. Recent Developments
- 18.2.8.5. Financials (Based on Availability)
- 18.2.9 Panda Security Inc (Watchguard Technologies Inc )
- 18.2.9.1. Overview
- 18.2.9.2. Products
- 18.2.9.3. SWOT Analysis
- 18.2.9.4. Recent Developments
- 18.2.9.5. Financials (Based on Availability)
- 18.2.10 Trellix (STG Partners LLC)
- 18.2.10.1. Overview
- 18.2.10.2. Products
- 18.2.10.3. SWOT Analysis
- 18.2.10.4. Recent Developments
- 18.2.10.5. Financials (Based on Availability)
- 18.2.1 Aruba Networks Inc (Hewlett Packard Enterprise Development LP
List of Figures
- Figure 1: Global Adaptive Security Market Revenue Breakdown (Million, %) by Region 2024 & 2032
- Figure 2: North America Adaptive Security Market Revenue (Million), by Country 2024 & 2032
- Figure 3: North America Adaptive Security Market Revenue Share (%), by Country 2024 & 2032
- Figure 4: Europe Adaptive Security Market Revenue (Million), by Country 2024 & 2032
- Figure 5: Europe Adaptive Security Market Revenue Share (%), by Country 2024 & 2032
- Figure 6: Asia Pacific Adaptive Security Market Revenue (Million), by Country 2024 & 2032
- Figure 7: Asia Pacific Adaptive Security Market Revenue Share (%), by Country 2024 & 2032
- Figure 8: South America Adaptive Security Market Revenue (Million), by Country 2024 & 2032
- Figure 9: South America Adaptive Security Market Revenue Share (%), by Country 2024 & 2032
- Figure 10: North America Adaptive Security Market Revenue (Million), by Country 2024 & 2032
- Figure 11: North America Adaptive Security Market Revenue Share (%), by Country 2024 & 2032
- Figure 12: MEA Adaptive Security Market Revenue (Million), by Country 2024 & 2032
- Figure 13: MEA Adaptive Security Market Revenue Share (%), by Country 2024 & 2032
- Figure 14: North America Adaptive Security Market Revenue (Million), by Application 2024 & 2032
- Figure 15: North America Adaptive Security Market Revenue Share (%), by Application 2024 & 2032
- Figure 16: North America Adaptive Security Market Revenue (Million), by Offering 2024 & 2032
- Figure 17: North America Adaptive Security Market Revenue Share (%), by Offering 2024 & 2032
- Figure 18: North America Adaptive Security Market Revenue (Million), by Deployment Model 2024 & 2032
- Figure 19: North America Adaptive Security Market Revenue Share (%), by Deployment Model 2024 & 2032
- Figure 20: North America Adaptive Security Market Revenue (Million), by End User 2024 & 2032
- Figure 21: North America Adaptive Security Market Revenue Share (%), by End User 2024 & 2032
- Figure 22: North America Adaptive Security Market Revenue (Million), by Country 2024 & 2032
- Figure 23: North America Adaptive Security Market Revenue Share (%), by Country 2024 & 2032
- Figure 24: Europe Adaptive Security Market Revenue (Million), by Application 2024 & 2032
- Figure 25: Europe Adaptive Security Market Revenue Share (%), by Application 2024 & 2032
- Figure 26: Europe Adaptive Security Market Revenue (Million), by Offering 2024 & 2032
- Figure 27: Europe Adaptive Security Market Revenue Share (%), by Offering 2024 & 2032
- Figure 28: Europe Adaptive Security Market Revenue (Million), by Deployment Model 2024 & 2032
- Figure 29: Europe Adaptive Security Market Revenue Share (%), by Deployment Model 2024 & 2032
- Figure 30: Europe Adaptive Security Market Revenue (Million), by End User 2024 & 2032
- Figure 31: Europe Adaptive Security Market Revenue Share (%), by End User 2024 & 2032
- Figure 32: Europe Adaptive Security Market Revenue (Million), by Country 2024 & 2032
- Figure 33: Europe Adaptive Security Market Revenue Share (%), by Country 2024 & 2032
- Figure 34: Asia Adaptive Security Market Revenue (Million), by Application 2024 & 2032
- Figure 35: Asia Adaptive Security Market Revenue Share (%), by Application 2024 & 2032
- Figure 36: Asia Adaptive Security Market Revenue (Million), by Offering 2024 & 2032
- Figure 37: Asia Adaptive Security Market Revenue Share (%), by Offering 2024 & 2032
- Figure 38: Asia Adaptive Security Market Revenue (Million), by Deployment Model 2024 & 2032
- Figure 39: Asia Adaptive Security Market Revenue Share (%), by Deployment Model 2024 & 2032
- Figure 40: Asia Adaptive Security Market Revenue (Million), by End User 2024 & 2032
- Figure 41: Asia Adaptive Security Market Revenue Share (%), by End User 2024 & 2032
- Figure 42: Asia Adaptive Security Market Revenue (Million), by Country 2024 & 2032
- Figure 43: Asia Adaptive Security Market Revenue Share (%), by Country 2024 & 2032
- Figure 44: Australia and New Zealand Adaptive Security Market Revenue (Million), by Application 2024 & 2032
- Figure 45: Australia and New Zealand Adaptive Security Market Revenue Share (%), by Application 2024 & 2032
- Figure 46: Australia and New Zealand Adaptive Security Market Revenue (Million), by Offering 2024 & 2032
- Figure 47: Australia and New Zealand Adaptive Security Market Revenue Share (%), by Offering 2024 & 2032
- Figure 48: Australia and New Zealand Adaptive Security Market Revenue (Million), by Deployment Model 2024 & 2032
- Figure 49: Australia and New Zealand Adaptive Security Market Revenue Share (%), by Deployment Model 2024 & 2032
- Figure 50: Australia and New Zealand Adaptive Security Market Revenue (Million), by End User 2024 & 2032
- Figure 51: Australia and New Zealand Adaptive Security Market Revenue Share (%), by End User 2024 & 2032
- Figure 52: Australia and New Zealand Adaptive Security Market Revenue (Million), by Country 2024 & 2032
- Figure 53: Australia and New Zealand Adaptive Security Market Revenue Share (%), by Country 2024 & 2032
- Figure 54: Latin America Adaptive Security Market Revenue (Million), by Application 2024 & 2032
- Figure 55: Latin America Adaptive Security Market Revenue Share (%), by Application 2024 & 2032
- Figure 56: Latin America Adaptive Security Market Revenue (Million), by Offering 2024 & 2032
- Figure 57: Latin America Adaptive Security Market Revenue Share (%), by Offering 2024 & 2032
- Figure 58: Latin America Adaptive Security Market Revenue (Million), by Deployment Model 2024 & 2032
- Figure 59: Latin America Adaptive Security Market Revenue Share (%), by Deployment Model 2024 & 2032
- Figure 60: Latin America Adaptive Security Market Revenue (Million), by End User 2024 & 2032
- Figure 61: Latin America Adaptive Security Market Revenue Share (%), by End User 2024 & 2032
- Figure 62: Latin America Adaptive Security Market Revenue (Million), by Country 2024 & 2032
- Figure 63: Latin America Adaptive Security Market Revenue Share (%), by Country 2024 & 2032
- Figure 64: Middle East and Africa Adaptive Security Market Revenue (Million), by Application 2024 & 2032
- Figure 65: Middle East and Africa Adaptive Security Market Revenue Share (%), by Application 2024 & 2032
- Figure 66: Middle East and Africa Adaptive Security Market Revenue (Million), by Offering 2024 & 2032
- Figure 67: Middle East and Africa Adaptive Security Market Revenue Share (%), by Offering 2024 & 2032
- Figure 68: Middle East and Africa Adaptive Security Market Revenue (Million), by Deployment Model 2024 & 2032
- Figure 69: Middle East and Africa Adaptive Security Market Revenue Share (%), by Deployment Model 2024 & 2032
- Figure 70: Middle East and Africa Adaptive Security Market Revenue (Million), by End User 2024 & 2032
- Figure 71: Middle East and Africa Adaptive Security Market Revenue Share (%), by End User 2024 & 2032
- Figure 72: Middle East and Africa Adaptive Security Market Revenue (Million), by Country 2024 & 2032
- Figure 73: Middle East and Africa Adaptive Security Market Revenue Share (%), by Country 2024 & 2032
List of Tables
- Table 1: Global Adaptive Security Market Revenue Million Forecast, by Region 2019 & 2032
- Table 2: Global Adaptive Security Market Revenue Million Forecast, by Application 2019 & 2032
- Table 3: Global Adaptive Security Market Revenue Million Forecast, by Offering 2019 & 2032
- Table 4: Global Adaptive Security Market Revenue Million Forecast, by Deployment Model 2019 & 2032
- Table 5: Global Adaptive Security Market Revenue Million Forecast, by End User 2019 & 2032
- Table 6: Global Adaptive Security Market Revenue Million Forecast, by Region 2019 & 2032
- Table 7: Global Adaptive Security Market Revenue Million Forecast, by Country 2019 & 2032
- Table 8: United States Adaptive Security Market Revenue (Million) Forecast, by Application 2019 & 2032
- Table 9: Canada Adaptive Security Market Revenue (Million) Forecast, by Application 2019 & 2032
- Table 10: Mexico Adaptive Security Market Revenue (Million) Forecast, by Application 2019 & 2032
- Table 11: Global Adaptive Security Market Revenue Million Forecast, by Country 2019 & 2032
- Table 12: Germany Adaptive Security Market Revenue (Million) Forecast, by Application 2019 & 2032
- Table 13: United Kingdom Adaptive Security Market Revenue (Million) Forecast, by Application 2019 & 2032
- Table 14: France Adaptive Security Market Revenue (Million) Forecast, by Application 2019 & 2032
- Table 15: Spain Adaptive Security Market Revenue (Million) Forecast, by Application 2019 & 2032
- Table 16: Italy Adaptive Security Market Revenue (Million) Forecast, by Application 2019 & 2032
- Table 17: Spain Adaptive Security Market Revenue (Million) Forecast, by Application 2019 & 2032
- Table 18: Belgium Adaptive Security Market Revenue (Million) Forecast, by Application 2019 & 2032
- Table 19: Netherland Adaptive Security Market Revenue (Million) Forecast, by Application 2019 & 2032
- Table 20: Nordics Adaptive Security Market Revenue (Million) Forecast, by Application 2019 & 2032
- Table 21: Rest of Europe Adaptive Security Market Revenue (Million) Forecast, by Application 2019 & 2032
- Table 22: Global Adaptive Security Market Revenue Million Forecast, by Country 2019 & 2032
- Table 23: China Adaptive Security Market Revenue (Million) Forecast, by Application 2019 & 2032
- Table 24: Japan Adaptive Security Market Revenue (Million) Forecast, by Application 2019 & 2032
- Table 25: India Adaptive Security Market Revenue (Million) Forecast, by Application 2019 & 2032
- Table 26: South Korea Adaptive Security Market Revenue (Million) Forecast, by Application 2019 & 2032
- Table 27: Southeast Asia Adaptive Security Market Revenue (Million) Forecast, by Application 2019 & 2032
- Table 28: Australia Adaptive Security Market Revenue (Million) Forecast, by Application 2019 & 2032
- Table 29: Indonesia Adaptive Security Market Revenue (Million) Forecast, by Application 2019 & 2032
- Table 30: Phillipes Adaptive Security Market Revenue (Million) Forecast, by Application 2019 & 2032
- Table 31: Singapore Adaptive Security Market Revenue (Million) Forecast, by Application 2019 & 2032
- Table 32: Thailandc Adaptive Security Market Revenue (Million) Forecast, by Application 2019 & 2032
- Table 33: Rest of Asia Pacific Adaptive Security Market Revenue (Million) Forecast, by Application 2019 & 2032
- Table 34: Global Adaptive Security Market Revenue Million Forecast, by Country 2019 & 2032
- Table 35: Brazil Adaptive Security Market Revenue (Million) Forecast, by Application 2019 & 2032
- Table 36: Argentina Adaptive Security Market Revenue (Million) Forecast, by Application 2019 & 2032
- Table 37: Peru Adaptive Security Market Revenue (Million) Forecast, by Application 2019 & 2032
- Table 38: Chile Adaptive Security Market Revenue (Million) Forecast, by Application 2019 & 2032
- Table 39: Colombia Adaptive Security Market Revenue (Million) Forecast, by Application 2019 & 2032
- Table 40: Ecuador Adaptive Security Market Revenue (Million) Forecast, by Application 2019 & 2032
- Table 41: Venezuela Adaptive Security Market Revenue (Million) Forecast, by Application 2019 & 2032
- Table 42: Rest of South America Adaptive Security Market Revenue (Million) Forecast, by Application 2019 & 2032
- Table 43: Global Adaptive Security Market Revenue Million Forecast, by Country 2019 & 2032
- Table 44: United States Adaptive Security Market Revenue (Million) Forecast, by Application 2019 & 2032
- Table 45: Canada Adaptive Security Market Revenue (Million) Forecast, by Application 2019 & 2032
- Table 46: Mexico Adaptive Security Market Revenue (Million) Forecast, by Application 2019 & 2032
- Table 47: Global Adaptive Security Market Revenue Million Forecast, by Country 2019 & 2032
- Table 48: United Arab Emirates Adaptive Security Market Revenue (Million) Forecast, by Application 2019 & 2032
- Table 49: Saudi Arabia Adaptive Security Market Revenue (Million) Forecast, by Application 2019 & 2032
- Table 50: South Africa Adaptive Security Market Revenue (Million) Forecast, by Application 2019 & 2032
- Table 51: Rest of Middle East and Africa Adaptive Security Market Revenue (Million) Forecast, by Application 2019 & 2032
- Table 52: Global Adaptive Security Market Revenue Million Forecast, by Application 2019 & 2032
- Table 53: Global Adaptive Security Market Revenue Million Forecast, by Offering 2019 & 2032
- Table 54: Global Adaptive Security Market Revenue Million Forecast, by Deployment Model 2019 & 2032
- Table 55: Global Adaptive Security Market Revenue Million Forecast, by End User 2019 & 2032
- Table 56: Global Adaptive Security Market Revenue Million Forecast, by Country 2019 & 2032
- Table 57: Global Adaptive Security Market Revenue Million Forecast, by Application 2019 & 2032
- Table 58: Global Adaptive Security Market Revenue Million Forecast, by Offering 2019 & 2032
- Table 59: Global Adaptive Security Market Revenue Million Forecast, by Deployment Model 2019 & 2032
- Table 60: Global Adaptive Security Market Revenue Million Forecast, by End User 2019 & 2032
- Table 61: Global Adaptive Security Market Revenue Million Forecast, by Country 2019 & 2032
- Table 62: Global Adaptive Security Market Revenue Million Forecast, by Application 2019 & 2032
- Table 63: Global Adaptive Security Market Revenue Million Forecast, by Offering 2019 & 2032
- Table 64: Global Adaptive Security Market Revenue Million Forecast, by Deployment Model 2019 & 2032
- Table 65: Global Adaptive Security Market Revenue Million Forecast, by End User 2019 & 2032
- Table 66: Global Adaptive Security Market Revenue Million Forecast, by Country 2019 & 2032
- Table 67: Global Adaptive Security Market Revenue Million Forecast, by Application 2019 & 2032
- Table 68: Global Adaptive Security Market Revenue Million Forecast, by Offering 2019 & 2032
- Table 69: Global Adaptive Security Market Revenue Million Forecast, by Deployment Model 2019 & 2032
- Table 70: Global Adaptive Security Market Revenue Million Forecast, by End User 2019 & 2032
- Table 71: Global Adaptive Security Market Revenue Million Forecast, by Country 2019 & 2032
- Table 72: Global Adaptive Security Market Revenue Million Forecast, by Application 2019 & 2032
- Table 73: Global Adaptive Security Market Revenue Million Forecast, by Offering 2019 & 2032
- Table 74: Global Adaptive Security Market Revenue Million Forecast, by Deployment Model 2019 & 2032
- Table 75: Global Adaptive Security Market Revenue Million Forecast, by End User 2019 & 2032
- Table 76: Global Adaptive Security Market Revenue Million Forecast, by Country 2019 & 2032
- Table 77: Global Adaptive Security Market Revenue Million Forecast, by Application 2019 & 2032
- Table 78: Global Adaptive Security Market Revenue Million Forecast, by Offering 2019 & 2032
- Table 79: Global Adaptive Security Market Revenue Million Forecast, by Deployment Model 2019 & 2032
- Table 80: Global Adaptive Security Market Revenue Million Forecast, by End User 2019 & 2032
- Table 81: Global Adaptive Security Market Revenue Million Forecast, by Country 2019 & 2032
Frequently Asked Questions
1. What is the projected Compound Annual Growth Rate (CAGR) of the Adaptive Security Market?
The projected CAGR is approximately 17.86%.
2. Which companies are prominent players in the Adaptive Security Market?
Key companies in the market include Aruba Networks Inc (Hewlett Packard Enterprise Development LP, Illumio Inc, IBM Corporation, Cisco Systems Inc, Trend Micro Incorporated, Juniper Networks Inc, Rapid7 Inc, Lumen Technologies Inc, Panda Security Inc (Watchguard Technologies Inc ), Trellix (STG Partners LLC).
3. What are the main segments of the Adaptive Security Market?
The market segments include Application, Offering, Deployment Model, End User.
4. Can you provide details about the market size?
The market size is estimated to be USD 12.28 Million as of 2022.
5. What are some drivers contributing to market growth?
Need to Secure IT Resources from Advanced Cyberattacks; Need for Security Compliances and Regulations.
6. What are the notable trends driving market growth?
Cloud Deployment Model to Witness Major Growth.
7. Are there any restraints impacting market growth?
Lack of Skilled Cyber Security Professionals.
8. Can you provide examples of recent developments in the market?
February 2024 - Build38, a provider of Mobile Application Security solutions, launched its Next Gen AI-Powered Active Hardening technology, poised to redefine the future of Mobile App Security. Active Hardening represents a significant leap forward in Mobile App Security, adding AI-driven threat intelligence with adaptive security profiles to provide proactive protection against evolving threats. Unlike conventional RASP solutions, Active Hardening goes beyond on-device protection, leveraging AI to analyze and monitor real-time threat information from millions of endpoints.
9. What pricing options are available for accessing the report?
Pricing options include single-user, multi-user, and enterprise licenses priced at USD 4750, USD 5250, and USD 8750 respectively.
10. Is the market size provided in terms of value or volume?
The market size is provided in terms of value, measured in Million.
11. Are there any specific market keywords associated with the report?
Yes, the market keyword associated with the report is "Adaptive Security Market," which aids in identifying and referencing the specific market segment covered.
12. How do I determine which pricing option suits my needs best?
The pricing options vary based on user requirements and access needs. Individual users may opt for single-user licenses, while businesses requiring broader access may choose multi-user or enterprise licenses for cost-effective access to the report.
13. Are there any additional resources or data provided in the Adaptive Security Market report?
While the report offers comprehensive insights, it's advisable to review the specific contents or supplementary materials provided to ascertain if additional resources or data are available.
14. How can I stay updated on further developments or reports in the Adaptive Security Market?
To stay informed about further developments, trends, and reports in the Adaptive Security Market, consider subscribing to industry newsletters, following relevant companies and organizations, or regularly checking reputable industry news sources and publications.
Methodology
Step 1 - Identification of Relevant Samples Size from Population Database


Step 2 - Approaches for Defining Global Market Size (Value, Volume* & Price*)

Note*: In applicable scenarios
Step 3 - Data Sources
Primary Research
- Web Analytics
- Survey Reports
- Research Institute
- Latest Research Reports
- Opinion Leaders
Secondary Research
- Annual Reports
- White Paper
- Latest Press Release
- Industry Association
- Paid Database
- Investor Presentations

Step 4 - Data Triangulation
Involves using different sources of information in order to increase the validity of a study
These sources are likely to be stakeholders in a program - participants, other researchers, program staff, other community members, and so on.
Then we put all data in single framework & apply various statistical tools to find out the dynamic on the market.
During the analysis stage, feedback from the stakeholder groups would be compared to determine areas of agreement as well as areas of divergence


